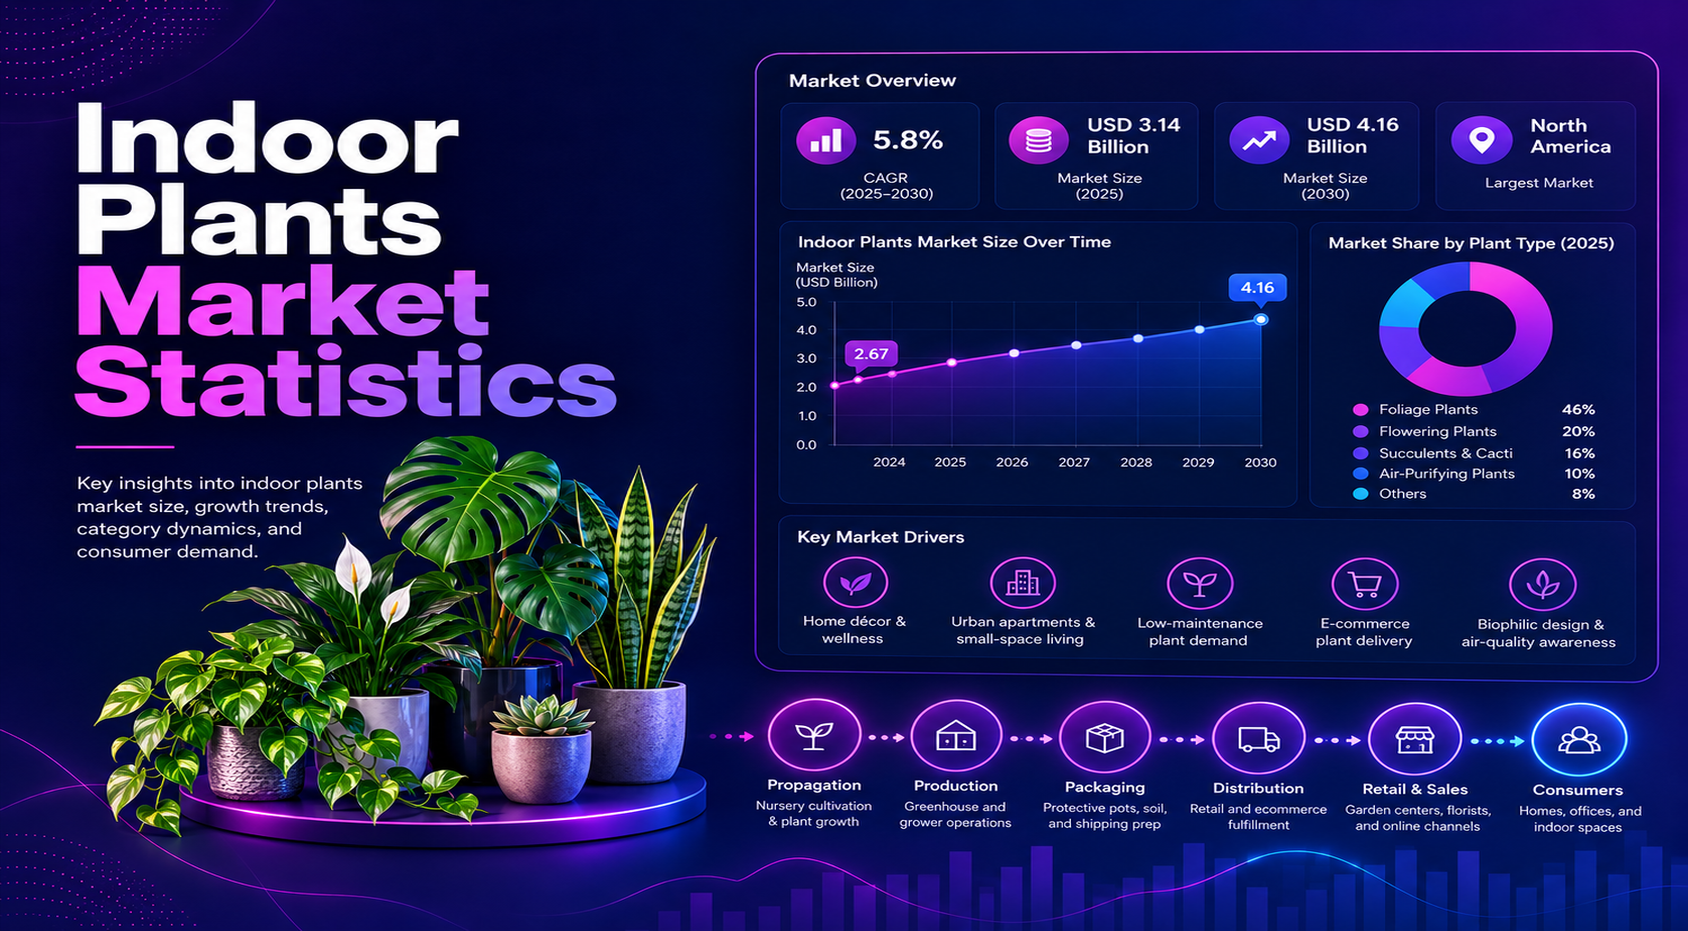
Indoor plants have moved from decorative household items into a global lifestyle and wellness market. Demand is shaped by urban apartments, home offices, interior design, gifting, ecommerce plant delivery, low-maintenance foliage, and premium plant-care products. That makes the indoor plants market a consumer category, a horticulture category, and a retail-channel story at the same time.
The strongest statistics show why indoor plants deserve a dedicated market scorecard. One benchmark places the global indoor plants market at USD 20.41 billion in 2024, USD 21.40 billion in 2025, and USD 32.78 billion by 2034 at a 4.85% CAGR. Another benchmark estimates USD 22.03 billion in 2025 and USD 27.35 billion by 2030 at a 4.42% CAGR. Product-level data also matters: foliage plants hold a 41.12% revenue share, low-light tolerant species hold a 46.05% share, and succulents and cacti are projected at a 6.88% CAGR in one segment forecast.
The best way to read the market is through a scorecard rather than a single forecast. Market size, product type, retail channel, regional supply, and country demand all explain where indoor plant revenue is growing and where brands need more localized planning.
Executive Indoor Plants Benchmarks
These are the statistics that frame the article. They show the size of the market, the product categories that carry demand, the role of online plant retail, and the difference between consumer markets and production hubs.
The numbers that define the indoor plants market
- The global indoor plants market was valued at USD 20.41 billion in 2024 in one global benchmark.
- The same benchmark places the market at USD 21.40 billion in 2025 and USD 32.78 billion by 2034.
- The long-term CAGR in that forecast is 4.85% from 2025 to 2034.
- A second benchmark places the indoor plant market at USD 22.03 billion in 2025 and USD 27.35 billion by 2030.
- That second forecast implies a 4.42% CAGR through 2030.
- Foliage plants account for 41.12% of indoor plant revenue in one product-type benchmark.
- Low-light tolerant species hold 46.05% share in one light-requirement benchmark.
- Succulents and cacti are forecast at a 6.88% CAGR in one segment outlook.
- Medium-light plants are forecast at a 6.51% CAGR in one light-requirement outlook.
- The online plant nursery market is benchmarked at USD 6.98 billion in 2024.
- U.S. foliage plants for indoor and patio use reached USD 928.4 million in 2024.
- U.S. foliage sales increased by USD 102.1 million from 2022 to 2024, equal to 12.4% growth.
- Canada greenhouse, nursery, field-grown cut flower, and sod industries reached CAD 6.0 billion in 2024.
- UK ornamentals were valued at GBP 1.7 billion in 2024.
- Netherlands ornamental horticulture exports reached EUR 12.3 billion in 2025.
- India indoor plants are forecast to rise from USD 0.25 billion in 2024 to USD 0.41 billion by 2030.
Editorial readout
Indoor plants should be measured through five connected signals: market value, household demand, plant type, retail channel, and regional production strength. A market with strong ornamental exports is not always the same as a market with the highest consumer demand. Mature markets can still grow through premium planters, online delivery, plant-care products, low-light varieties, and interior design use cases.
Why Indoor Plants Now Carry Global Lifestyle-Market Scale
Indoor plant statistics matter because the category is no longer a small add-on inside garden retail. The market touches home improvement, online gifting, interior design, office wellness, hospitality, greenhouse production, and ornamental trade. A single potted plant can be a low-ticket impulse purchase, but the full category includes decorative containers, soil, fertilizer, care kits, grow lights, plant subscriptions, rare plant collectors, and recurring replacement demand.
Market-size figures do not tell a retailer exactly which plant to place near the checkout counter or which product to push through online ads. They do show why the category should be measured carefully. When a global market moves from USD 20.41 billion to USD 32.78 billion over a forecast window, small shifts in channel mix, product survival, delivery quality, and average order value can affect meaningful revenue.
Market-size and growth benchmarks
- The global benchmark starts at USD 20.41 billion in 2024 and reaches USD 21.40 billion in 2025.
- The same forecast reaches USD 22.44 billion in 2026 and USD 23.53 billion in 2027.
- By 2030, the forecast rises to USD 27.12 billion.
- By 2034, the market reaches USD 32.78 billion.
- The cumulative increase from 2024 to 2034 is USD 12.37 billion.
- The 2034 market value is about 160.6 on a 2024 index of 100.
- The alternative 2025 benchmark of USD 22.03 billion shows that even different market definitions point to a large indoor plant category.
- The alternative 2030 benchmark of USD 27.35 billion sits close to the 2030 value in the longer global forecast.
- The online plant nursery benchmark of USD 6.98 billion in 2024 shows that digital retail is already material rather than experimental.
- A 4.85% CAGR indicates steady expansion, not a short-lived plant-buying spike.
Market-scale interpretation
Indoor plant growth is best understood as recurring lifestyle demand supported by horticulture production. The market expands when more homes buy plants, but value also rises when buyers add decorative pots, soil, fertilizers, delivery, care guides, and premium species to the same purchase.
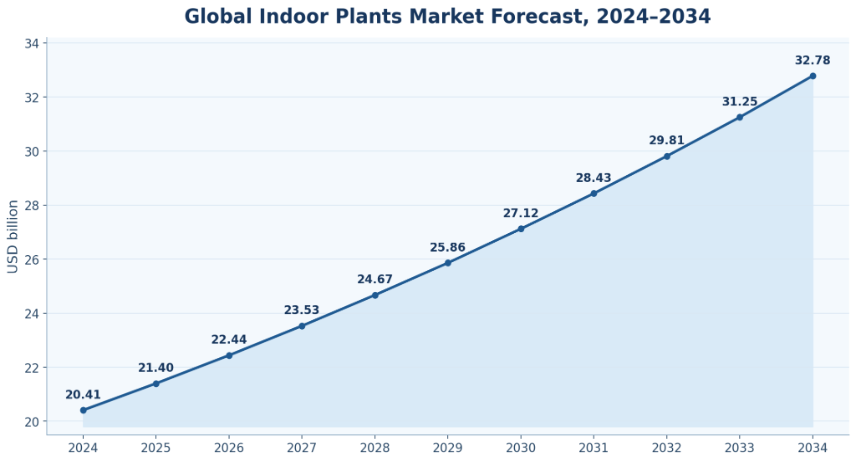
Figure 1. Indoor plants market growth should be reviewed alongside urban living, home design, and ecommerce because demand is shaped by both lifestyle adoption and horticulture supply.
Consumer Demand: Homes, Apartments, Wellness, and Design
Indoor plant demand begins with consumer behavior. A buyer may enter the category because a small apartment needs greenery, a home office feels dull, a living room needs a design accent, or a gift needs to feel personal without being disposable. That behavior makes indoor plants more complex than ordinary decorative objects. The product is living, requires aftercare, and carries emotional value.
The demand base also changes by household type. Urban buyers often need low-light plants, compact pots, hardy species, or small desk plants. Suburban buyers may use indoor plants as a bridge between home decor and gardening. Office and hospitality buyers tend to care more about maintenance plans, consistent appearance, and plant survival. Gift buyers prefer attractive packaging, simple care instructions, and lower-risk species.
Household and lifestyle demand benchmarks
- Foliage plants are the largest single product signal, with 41.12% revenue share in one indoor plant benchmark.
- Low-light tolerant species hold 46.05% share, reflecting demand from apartments, offices, and shaded interiors.
- Shade-loving plants are estimated around 40% share in another product-type benchmark.
- Medium-light plants are projected at a 6.51% CAGR in one light-requirement forecast.
- Succulents and cacti are forecast at a 6.88% CAGR, showing continued demand for low-maintenance plant ownership.
- The U.S. indoor/patio foliage category reached USD 928.4 million in 2024, showing that living-room and patio-use plants are already a sizable official crop category.
- U.S. foliage sales increased by 12.4% between 2022 and 2024.
- Potted foliage plants represented 89% of U.S. foliage value in 2024, making pots and containers central to value capture.
- Foliage hanging baskets represented 9% of foliage dollars in an earlier U.S. benchmark, showing a smaller but distinct format within the category.
| Demand driver | What it measures | Why it matters |
|---|---|---|
| Household plant ownership | Homes with indoor plants | Shows whether greenery is a mainstream household habit. |
| Urban living | Apartments, offices, and small spaces | Supports compact, low-light, and hardy species. |
| Home decor | Plants used as design objects | Links plants to furniture, pots, and interior styling. |
| Wellness interest | Plants tied to comfort and mood | Supports premium and care-based messaging. |
| Gift demand | Plants bought for occasions | Supports florists, ecommerce, packaging, and delivery. |
| Beginner demand | Easy-care and resilient plants | Reduces post-purchase disappointment and returns. |
Consumer demand readout
Indoor plant demand is strongest when plants solve a space, design, or lifestyle need. Small apartments favor compact and low-light plants, home offices favor desk plants, premium homes favor statement foliage, and gift buyers favor easy-care plants with attractive packaging.
Product Type: Foliage, Flowering Plants, Succulents, Cacti, and Low-Light Plants
Product type is one of the most important sections of an indoor plants statistics report. Market growth does not come from one generic indoor plant. It comes from specific categories that serve different buyer needs: foliage for everyday decor, flowering plants for occasion purchases, succulents and cacti for beginners, low-light species for offices and apartments, large statement plants for interior design, and rare plants for collectors.
The useful way to read product data is to separate volume anchors from value boosters. Foliage plants are the volume anchor because they suit many rooms and do not rely on temporary blooms. Flowering plants can be powerful for gifting and seasonal displays, but they often require more frequent replacement or higher care expectations. Rare plants and large plants can raise average order value, but they also increase handling, shipping, and survival risk.
Plant category and product-mix benchmarks
- Foliage plants lead product-type revenue with 41.12% share in one benchmark.
- Low-light tolerant species hold 46.05% share by light requirement, confirming the importance of apartment and office-friendly plants.
- Shade-loving plants are estimated at about 40% share in one 2026 market benchmark.
- Succulents and cacti are projected to grow at 6.88% CAGR, making them one of the faster plant-type growth signals.
- Medium-light plants are projected to grow at 6.51% CAGR in one light-requirement forecast.
- U.S. foliage plants for indoor/patio use were valued at USD 928.4 million in 2024.
- Potted foliage plants represented 89% of U.S. foliage plant value in 2024.
- Florida represented 69% of U.S. foliage production in one official 2024 benchmark, showing how concentrated the supply base can be.
- The foliage-to-potted-flowering ratio in a selected U.S. category comparison was 0.74 in 2024.
- Foliage represented 14.6% of selected 2024 U.S. floriculture categories in a derived benchmark.
| Plant type | Consumer use case | Market implication |
|---|---|---|
| Foliage plants | Everyday home decor | Core volume category for living rooms, offices, and shelves. |
| Flowering plants | Gifting and seasonal displays | Strong for florists, occasion marketing, and replacements. |
| Succulents and cacti | Low-maintenance ownership | Works well for beginners, desks, and small spaces. |
| Low-light plants | Apartments and offices | Supports urban, commercial, and shaded interiors. |
| Rare plants | Collectors and premium buyers | Raises price per plant and content-driven demand. |
| Large statement plants | Interior design accents | Raises order value but needs stronger delivery handling. |
Product mix readout
Foliage plants anchor the indoor plants market because they fit everyday decor and are easier to position than many flowering plants. Succulents, cacti, and low-light plants support beginner-friendly growth, while rare and large statement plants create premium value when retailers can protect plant quality during handling and delivery.
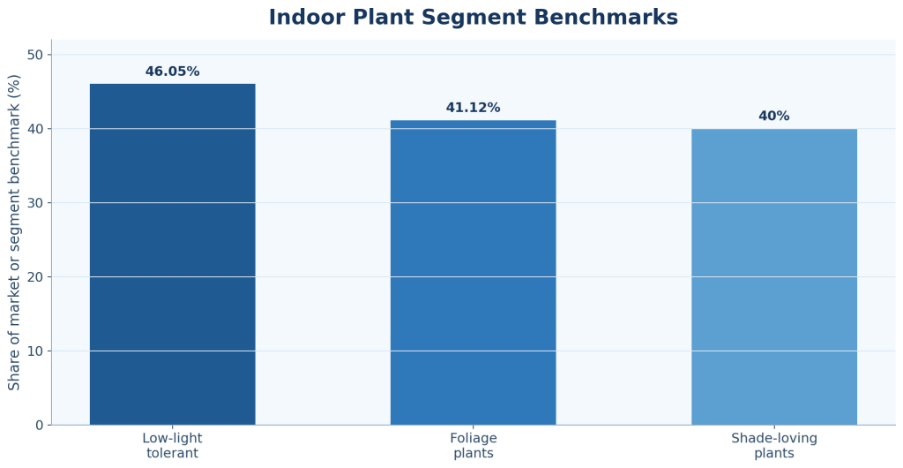
Figure 2. Product type trends show how foliage and low-light plants anchor everyday demand while succulents, cacti, and decorative formats support higher-value growth stories.
Premiumization: Decorative Pots, Rare Plants, Smart Planters, and Plant Care
Indoor plant premiumization is not only about selling a more expensive plant. It is about surrounding the plant with design, care, convenience, and confidence. A consumer may pay more for a ceramic pot, a self-watering container, a plant-care kit, a grow light, specialty soil, pest-control support, delivery protection, or a plant that arrives with clear care instructions. In that sense, the market expands through add-ons as much as through plant volume.
This premiumization logic is important because plants are living inventory. If buyers fail to keep plants alive, they may blame themselves, the retailer, or the product. Brands that reduce that risk through easy-care assortments, care cards, repotting kits, online support, and hardy species can convert occasional plant buyers into repeat buyers. Rare plants and decorative planters can lift average order value, but they must be matched with customer education and aftercare.
Premium and add-on category benchmarks
- The online plant nursery market size of USD 6.98 billion in 2024 shows that consumers are comfortable buying living products digitally when trust and delivery are strong.
- Potted foliage plants represented 89% of U.S. foliage value in 2024, underlining the role of containers and presentation.
- Foliage plants grew by USD 102.1 million between 2022 and 2024 in the U.S. official benchmark.
- The 12.4% foliage sales growth over that period shows value expansion even inside a mature horticulture market.
- Canada greenhouse product sales reached CAD 5.0 billion in 2024, showing the importance of controlled production for ornamental and plant categories.
- UK pot plants were valued at GBP 330 million in 2023 within a broader plants and trees production base.
- Netherlands ornamental horticulture exports reached EUR 12.3 billion in 2025, showing how production and trade support premium plant availability across countries.
| Premium trend | What buyers add | Market implication |
|---|---|---|
| Decorative pots | Ceramic, fiber stone, metal, and self-watering planters | Turns a plant purchase into a home-decor purchase. |
| Rare plants | Collector species and unusual foliage | Raises average ticket but narrows the buyer segment. |
| Plant-care kits | Soil, fertilizer, pruning tools, moisture meters | Creates add-on revenue and repeat purchases. |
| Smart planters | Watering support and sensor-led care | Supports convenience and beginner confidence. |
| Grow lights | Light support for apartments and winter months | Helps low-light homes expand plant choices. |
| Plant subscriptions | Recurring plant delivery and care bundles | Creates predictable demand for ecommerce brands. |
Premiumization rule
Indoor plant value grows when the plant becomes part of a designed living space. A basic plant may generate a single sale, but a plant bundled with a decorative pot, soil, fertilizer, care instructions, and delivery support can create a higher-value purchase and reduce buyer uncertainty.
Wellness, Air Quality, and Biophilic Design
Wellness is one of the strongest narratives around indoor plants, but it should be handled carefully. The market opportunity does not depend only on claims about air quality. It also depends on how people feel in rooms that include greenery, how offices use plants to soften workspaces, how hotels and restaurants create atmosphere, and how home decorators use plants to make rooms feel lived-in. In practice, indoor plants sit between horticulture and emotional design.
Biophilic design gives the category a broader business role. A plant is not only a retail item on a shelf; it can be part of a workplace wellness program, a residential staging package, a hospitality design plan, or a recurring plant-maintenance service. This expands the addressable market beyond individual consumers buying one pot at a time. It also connects indoor plants to architects, designers, facilities managers, and commercial service providers.
Wellness and design benchmarks
- Low-light tolerant species hold 46.05% share, which supports offices, apartments, and shaded interiors where wellness and decor overlap.
- Foliage plants hold 41.12% revenue share, making green leaves the core visual language of the indoor plant category.
- Shade-loving plants hold about 40% share in one benchmark, reinforcing the importance of plant types that can work away from bright windows.
- Medium-light plants are forecast at a 6.51% CAGR, showing that buyers also want plants suited to better-lit homes and offices.
- Succulents and cacti are forecast at a 6.88% CAGR, which fits beginner-friendly and low-maintenance wellness buying.
- UK ornamental plant production supports about 16,000 jobs in one benchmark, showing that the category links design demand to real horticultural employment.
- Netherlands floriculture contributed EUR 6.6 billion to GDP in 2024 in one trade benchmark, showing the economic weight behind decorative plant supply.
- UK pot plants were valued at GBP 330 million in 2023, giving a practical indicator for indoor-ready decorative plant demand.
- U.S. potted foliage plants represented 89% of foliage value in 2024, showing how presentation-ready plants dominate the indoor foliage category.
| Design use case | Typical plant need | Market implication |
|---|---|---|
| Home office | Desk plants, low-light foliage, small pots | Supports compact plants and simple care instructions. |
| Living room decor | Large foliage, statement plants, decorative containers | Raises average order value and delivery needs. |
| Apartment living | Low-light, resilient, compact plants | Favors beginner-friendly and space-saving categories. |
| Hospitality interiors | Durable plants and maintenance services | Creates B2B recurring-service demand. |
| Wellness positioning | Greenery, comfort, and softer indoor spaces | Supports premium messaging without relying only on air-purifying claims. |
| Gifting | Attractive packaging and easy-care species | Links plants to florists and ecommerce delivery. |
Wellness interpretation
The strongest wellness story is not a single claim. It is the broader use of greenery to make homes, offices, and hospitality spaces feel more comfortable. Indoor plants sell best when the product promise combines design, care confidence, durability, and the emotional value of living decor.
Distribution Channels: Garden Centers, Florists, Supermarkets, Ecommerce, and DTC
Indoor plants are channel-sensitive. A buyer in a garden center can inspect leaf condition, ask for care guidance, and compare pot sizes. An ecommerce buyer sees photos, shipping promises, reviews, and care instructions. A supermarket buyer may act on impulse, while a florist customer may be buying a plant as a gift. The same plant can therefore perform differently depending on where it is sold.
The channel shift matters because plants are fragile and trust-based. Online sellers must solve packaging, temperature exposure, damage, delivery timing, and customer education. Garden centers and florists win when customers want confidence and advice. Supermarkets and mass retail win on convenience and volume. DTC plant brands win when they combine selection, content, care guidance, and delivery reliability.
Retail and channel benchmarks
- The online plant nursery market was benchmarked at USD 6.98 billion in 2024.
- U.S. floriculture sales reached USD 6.69 billion in 2023 across the official benchmark crop base.
- U.S. published-state floriculture sales were USD 6.31 billion in 2023 across 28 program states.
- U.S. floriculture production area reached 851 million square feet in 2023, up from 833 million square feet in 2022.
- Canada greenhouse, nursery, field-grown cut flower, and sod industries reached CAD 6.0 billion in 2024.
- Greenhouse products accounted for 83.4% of Canada’s 2024 sales benchmark.
- Canadian nursery product sales/resales reached CAD 796.1 million in 2024.
- UK ornamentals were valued at GBP 1.7 billion in 2024, showing the size of a mature European ornamental retail base.
- UK ornamental plant imports were about GBP 1.5 billion in 2023, highlighting the role of imported products in channel supply.
| Channel | What it does well | Market implication |
|---|---|---|
| Garden centers | Advice, selection, local trust | Strong for serious plant buyers and higher-care products. |
| Florists | Gifting and occasion sales | Strong for flowering plants and decorative presentation. |
| Supermarkets | Convenience and impulse buying | Supports mass-market access and lower-friction purchases. |
| Home improvement stores | Seasonal and home-project traffic | Links plants to home renovation and patio spending. |
| Ecommerce | Delivery, subscriptions, and rare plant access | Expands reach but requires careful packaging and support. |
| Corporate plant services | Office and hospitality greenery | Creates B2B maintenance and replacement demand. |
Channel readout
Indoor plants are channel-sensitive because buyers often need confidence in plant condition, care difficulty, delivery safety, and aftercare. Ecommerce can expand access, but garden centers and florists remain important where advice, trust, and product quality matter.
Regional Indoor Plants Market Intelligence
Regional data is one of the most useful parts of an indoor plants statistics report. Global averages hide whether a country is mainly a production hub, a trade hub, a retail market, or a growth market. The Netherlands is a distribution and export anchor. The United States is a mature consumer and production benchmark. Canada provides greenhouse and ornamental industry signals. The United Kingdom shows mature ornamental demand and import reliance. India and China represent urban growth potential. The Middle East and Africa show smaller but targeted opportunities in premium interiors, hospitality, and climate-controlled indoor spaces.
North America
North America should be treated as a mature value market. The U.S. official data shows a meaningful indoor/patio foliage category, while Canada’s greenhouse and ornamental statistics show a strong supply and retail base. The region also supports ecommerce plant delivery, plant-care accessories, home improvement traffic, and premium decorative pots.
- U.S. foliage plants for indoor/patio use reached USD 928.4 million in 2024.
- U.S. annual bedding and garden plants were valued at USD 2.55 billion in 2024.
- U.S. potted flowering plants were valued at USD 1.2548 billion in 2024.
- U.S. herbaceous perennial plants were valued at USD 896.1 million in 2024.
- U.S. cut flowers were valued at USD 414 million in 2024.
- U.S. propagative floriculture materials were valued at USD 316.4 million in 2024.
- Florida represented 69% of U.S. foliage production in 2024.
- Canada’s greenhouse, nursery, field-grown cut flower, and sod industries reached CAD 6.0 billion in 2024.
- Canadian greenhouse product sales reached CAD 5.0 billion in 2024.
- Canadian greenhouse products represented 83.4% of total sales in that benchmark.
North America interpretation
The U.S. and Canada show why indoor plants should be connected to official floriculture and greenhouse data. Consumer demand matters, but market reliability depends on greenhouse output, regional production concentration, retail access, and quality control.
Europe
Europe combines consumer demand, production networks, import flows, and mature garden retail. The Netherlands plays an outsized trade role because ornamental horticulture exports connect growers with buyers across Europe and beyond. The United Kingdom offers a useful mature-market lens through ornamentals, pot plants, imports, and horticultural employment.
- UK ornamentals were valued at GBP 1.7 billion in 2024.
- UK ornamentals changed by –0.3% from 2023 to 2024, suggesting mature-market stability rather than rapid expansion.
- UK horticulture home production volume reached 2.4 million tones in 2024.
- UK home production volume increased by 2.3% from 2023 to 2024.
- UK plants and trees production was valued at GBP 1.7 billion in 2023.
- UK hardy ornamental nursery stock was valued at GBP 1.2 billion in 2023.
- UK pot plants were valued at GBP 330 million in 2023.
- UK flowers and bulbs were valued at GBP 179 million in 2023.
- UK ornamental plant imports were valued at GBP 1.5 billion in 2023.
- Cut flowers represented 42% of UK ornamental plant imports in 2023.
- Netherlands ornamental horticulture exports reached EUR 12.3 billion in 2025.
- Dutch ornamental horticulture exports grew 4.2% from 2024 to 2025.
- Dutch-origin products represented 84% of Netherlands ornamental horticulture exports in 2025.
- Netherlands floriculture exports were valued at EUR 9.1 billion in 2025.
- The Netherlands exported USD 10.5 billion of live trees, plants, bulbs, cut flowers, and ornamental foliage in 2024.
Europe interpretation
Europe should be read through both consumer demand and supply-chain power. The Netherlands is a trade hub, while the UK and other mature markets show how indoor plant demand interacts with garden centers, imports, pot plants, and ornamental production.
Asia-Pacific
Asia-Pacific should not be treated as one indoor plant market. India has urban apartment growth and a measurable forecast path. China has scale, digital retail behavior, and urban consumer potential. Japan is shaped by compact living, premium design, and specialty plant culture. Australia, South Korea, and Southeast Asia each have different combinations of gardening culture, climate, online retail, and local plant supply.
- India’s indoor plants market is forecast at USD 0.25 billion in 2024.
- India’s benchmark rises to USD 0.27 billion in 2025 and USD 0.29 billion in 2026.
- India reaches USD 0.32 billion in 2027 and USD 0.35 billion in 2028.
- India is forecast to reach USD 0.41 billion by 2030.
- India’s 2030 index is 162.7 when 2024 equals 100.
- Asia-Pacific indoor plants are benchmarked at USD 0.83 billion in 2024 in one regional forecast.
- Asia-Pacific rises to USD 0.88 billion in 2025 and USD 0.93 billion in 2026.
- Asia-Pacific reaches USD 1.20 billion in 2030 and USD 1.27 billion in 2031.
- The Asia-Pacific cumulative increase from 2024 to 2031 is USD 0.44 billion in that regional forecast.
- The regional index reaches 153.4 by 2031, with 2024 as the base year.
Asia-Pacific interpretation
Asia-Pacific growth is not only a market-size story. India and China point to urban households and ecommerce. Japan points to compact spaces and premium plant culture. Southeast Asia and Australia add different production, climate, and gardening dynamics.
Latin America
Latin America is not yet as visible in indoor plant market benchmarks as North America or Europe, but it has strong plant-production logic. Tropical foliage, local nurseries, climate-suited varieties, and urban home-decor demand can support plant retail in markets such as Brazil, Mexico, Colombia, Chile, and Argentina. The most useful statistics in this region often come from broader ornamental horticulture, flower, nursery, and retail data rather than indoor plant-only data.
- Latin America should be read as a production-plus-consumer opportunity rather than only a direct indoor plant forecast.
- Tropical foliage supply gives the region a natural production advantage for many indoor plant varieties.
- Urban apartment growth creates demand for compact, low-maintenance, and decorative plants.
- Local nursery networks can support lower-cost plant access when import-heavy channels are expensive.
- Ecommerce can expand plant access in large cities, but delivery quality and plant survival remain important constraints.
- Premium demand is likely to concentrate first in higher-income urban areas, design stores, and specialty plant shops.
Latin America interpretation
Latin America’s indoor plant opportunity is strongest where local plant supply, tropical foliage, city retail, and affordable decor intersect. The key challenge is building reliable retail and delivery systems that protect living inventory.
Middle East and Africa
The Middle East and Africa indoor plant market is smaller in direct market-size terms, but the region has clear pockets of demand. Premium real estate, hotels, offices, malls, restaurants, and climate-controlled indoor spaces create demand for resilient indoor greenery. In arid markets, plant selection, irrigation support, and maintenance services become part of the product value.
- MEA indoor plants were benchmarked at USD 0.33 billion in 2024 in one regional forecast.
- The MEA benchmark rises to USD 0.35 billion in 2025 and USD 0.38 billion in 2026.
- MEA reaches USD 0.43 billion in 2028 and USD 0.49 billion in 2030.
- MEA is forecast to reach USD 0.52 billion by 2031.
- The MEA index reaches 157.5 by 2031 when 2024 equals 100.
- The 2024–2031 MEA cumulative increase is about USD 0.19 billion.
- Premium interiors, offices, malls, hotels, and hospitality projects can create higher-value demand even in a smaller regional market.
MEA interpretation
MEA demand is shaped by climate-controlled indoor environments and premium interiors. The market may be smaller than North America, Europe, or Asia-Pacific, but hospitality, office greenery, imported ornamentals, and maintenance services create targeted growth opportunities.
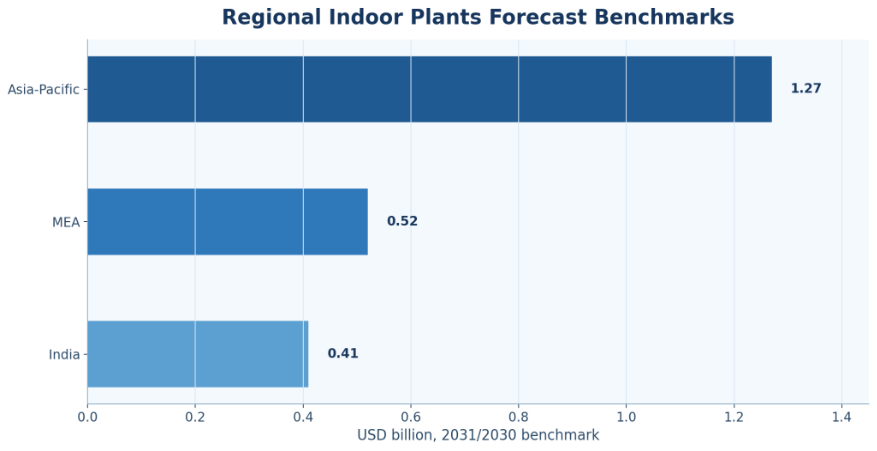
Figure 3. Regional indoor plant benchmarks show why production hubs, growth regions, and consumer demand markets should be analyzed separately.
Country-Level Indoor Plants Market Notes
Country-level notes help separate supply hubs from demand markets. A country can be important because it exports ornamental products, because its consumers buy plants, because it has official foliage or greenhouse production data, or because it shows fast urban growth. A compact table works better than a large country dump because readers need to know which statistics matter and why.
| Country/market | Key statistic or signal | Article interpretation |
|---|---|---|
| United States | Strong foliage/patio plant demand | Mature market for home decor, garden retail, and online delivery. |
| Canada | Greenhouse and floriculture benchmarks | Useful benchmark for greenhouse supply and retail plant demand. |
| Netherlands | Major ornamental horticulture trade hub | European anchor for supply, exports, and distribution. |
| United Kingdom | Important ornamental and pot plant market | Strong garden retail, gifting, and home-decor demand. |
| India | Indoor plant market forecast growth | Urban apartments and ecommerce support growth. |
| China | Urban indoor greenery and online retail demand | Scale market shaped by cities and digital channels. |
| Japan | Compact-space and premium plant culture | Small homes and specialty plants shape demand. |
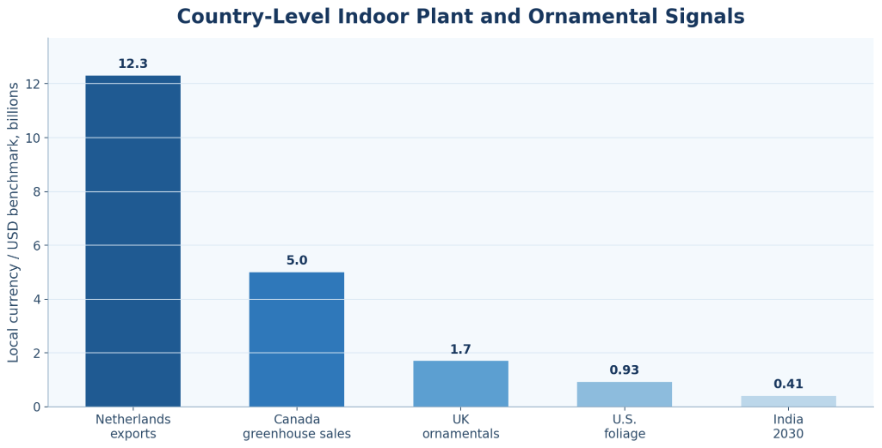
Figure 4. Country-level indoor plant and ornamental signals show why supply hubs, mature retail markets, and growth markets need different interpretation.
Production, Trade, and Supply Chain
Indoor plants are living inventory, which makes production and logistics central to market performance. A retailer can have strong demand but still lose sales through plant shrink, poor packaging, weak inventory rotation, temperature exposure, pest issues, or lack of care instructions. Supply-chain statistics help explain which countries and channels can reliably support growth.
The category depends on greenhouse capacity, nursery production, trade flows, packaging quality, transport speed, shelf-life management, and retail handling. These factors are especially important for ecommerce. A damaged plant, delayed delivery, or unclear care instruction can turn a promising plant purchase into a negative customer experience.
Supply and trade benchmarks
- U.S. floriculture production area reached 851 million square feet in 2023.
- U.S. floriculture production area was 833 million square feet in 2022, showing an 18 million square-foot increase into 2023.
- U.S. operations are captured above a USD 10,000 annual sales survey threshold in the official floriculture benchmark.
- Canada greenhouse product sales reached CAD 5.0 billion in 2024.
- Canadian greenhouse product sales grew 8.4% from 2023 to 2024.
- Canadian nursery product sales/resales reached CAD 796.1 million in 2024.
- Canadian nursery product sales grew 3.9% from 2023 to 2024.
- Ontario represented 41.7% of Canadian nursery sales in 2024.
- British Columbia represented 31.8% of Canadian nursery sales in 2024.
- Ontario, British Columbia, and Quebec together represented 88.5% of Canadian nursery sales in 2024.
- Netherlands ornamental horticulture exports reached EUR 12.3 billion in 2025.
- Dutch-origin products represented EUR 10.33 billion of that export value in a derived benchmark.
- Non-Dutch-origin products represented about EUR 1.97 billion of that export value.
| Supply signal | What it measures | Market implication |
|---|---|---|
| Greenhouse sales | Controlled production value | Shows supply capacity for living products. |
| Nursery sales | Plant and ornamental production | Supports local retail and garden center availability. |
| Export value | Cross-border ornamental trade | Identifies supply hubs and distribution power. |
| Production area | Physical growing capacity | Shows how much space supports crop output. |
| Provincial concentration | Where production is located | Helps plan logistics and regional retail supply. |
| Shrink control | Plant losses in handling | Directly affects margin and customer satisfaction. |
Supply-chain readout
Indoor plants are living inventory, so the market depends on production timing, transport quality, retail handling, shrink control, and plant health. A strong indoor plant market needs reliable growers, careful packaging, temperature-aware shipping, and retail education.
Indoor Plants Market Diagnostic
Indoor plant growth can be driven by market size, product mix, consumer demand, premium add-ons, ecommerce, regional supply, or country-level production. The diagnostic table below connects the statistics to business questions.
| Problem area | Core signals to measure | Useful benchmark from this report |
|---|---|---|
| Market scale | Market value, forecast value, CAGR | Global market moves from USD 20.41 billion in 2024 to USD 32.78 billion by 2034. |
| Consumer demand | Household decor, gifting, wellness, office greenery | Low-light plants hold 46.05% share in one benchmark. |
| Product mix | Foliage, flowering, succulents, rare plants | Foliage plants hold 41.12% revenue share. |
| Channel shift | Garden centers, florists, ecommerce, DTC | Online plant nursery market reaches USD 6.98 billion in 2024. |
| Regional mix | Country demand, export hubs, production strength | Netherlands exports reach EUR 12.3 billion in 2025. |
| Supply chain | Greenhouse output, shipping, shrink, packaging | Canada greenhouse products reach CAD 5.0 billion in 2024. |
Diagnostic principle
The market should not be reduced to one growth rate. The useful question is whether the opportunity comes from more buyers, higher-value plants, better add-ons, ecommerce expansion, regional production, or improved plant survival through the supply chain.
90-Day Indoor Plants Market Action Plan
Statistics become useful when they are translated into operating decisions. A practical 90-day review can prioritize demand, assortment, channel performance, supply reliability, and margin opportunities.
| Timing | What to do | Output |
|---|---|---|
| Days 1-30 | Finalize global, regional, country, product, and channel benchmarks. | Clear baseline of market, product, channel, and regional performance. |
| Days 31-60 | Compare market scale, product mix, consumer demand, channel performance, regional demand, and supply-chain constraints. | Prioritized product, channel, and regional opportunities with clear commercial owners. |
| Days 61-90 | Validate pricing, inventory, delivery, shrink, and plant-care execution against the strongest opportunities. | 90-day action scorecard with measurable revenue, margin, survival, and channel targets. |
Metrics Indoor Plants Market Leaders Should Track
The final scorecard should be detailed enough to locate the opportunity without becoming a vanity dashboard. These metrics separate market growth from channel execution, product strategy, and supply-chain quality.
| Metric | Why it matters |
|---|---|
| Global market value | the total indoor plants revenue opportunity. |
| CAGR | the long-term growth pace and forecast strength. |
| Regional market share | Separates mature markets from growth markets. |
| Product type share | demand for foliage, flowering, succulents, and rare plants. |
| Ecommerce value | digital plant-buying behavior and delivery opportunity. |
| Plant survival and shrink rate | Measures logistics, retail handling, and post-purchase satisfaction. |
| Country-level trade data | Identifies production hubs, import needs, and export strength. |
Indoor Plants Market Statistics FAQ
Common questions
How big is the indoor plants market?
One benchmark places the market at USD 20.41 billion in 2024 and USD 21.40 billion in 2025.
What is the expected CAGR?
One forecast projects 4.85% through 2034, while another benchmark projects 4.42% through 2030.
What will the market be worth by 2034?
One long-term benchmark projects USD 32.78 billion by 2034.
Which plant type is most important?
Foliage plants account for 41.12% revenue share in one product-type benchmark.
Why are low-light plants important?
Low-light tolerant species hold 46.05% share in one benchmark.
How is ecommerce changing sales?
The online plant nursery market is benchmarked at USD 6.98 billion in 2024.
Why is the United States important?
U.S. foliage plants used indoors and on patios reached USD 928.4 million in 2024.
Why is the Netherlands important?
It is a trade hub, with EUR 12.3 billion in ornamental horticulture exports in 2025.
Which growth markets matter?
India rises from USD 0.25 billion in 2024 to a forecast USD 0.41 billion by 2030.
What trends will shape indoor plants next?
Urban living, low-light foliage, ecommerce delivery, premium planters, rare plants, plant-care add-ons, and better supply-chain handling.
Final Takeaway
Indoor plant performance depends on five connected systems: lifestyle demand, plant-type fit, premium add-ons, regional supply strength, and channel execution. The statistics show that growth can come from any one of those areas, so the market should not be managed as one blended forecast.
The useful analysis finds the actual driver. If online sales lag, the issue may be delivery trust, packaging, or aftercare. If foliage sells well but premium value is limited, the opportunity may be pots, rare plants, care kits, or design-led bundles.
For growers, retailers, and brands, the practical goal is a market that is attractive, easy to buy, easy to keep alive, and easy to localize. That means clear care information, reliable supply, compact and low-light options, premium add-ons, and channels that match how each region buys plants.