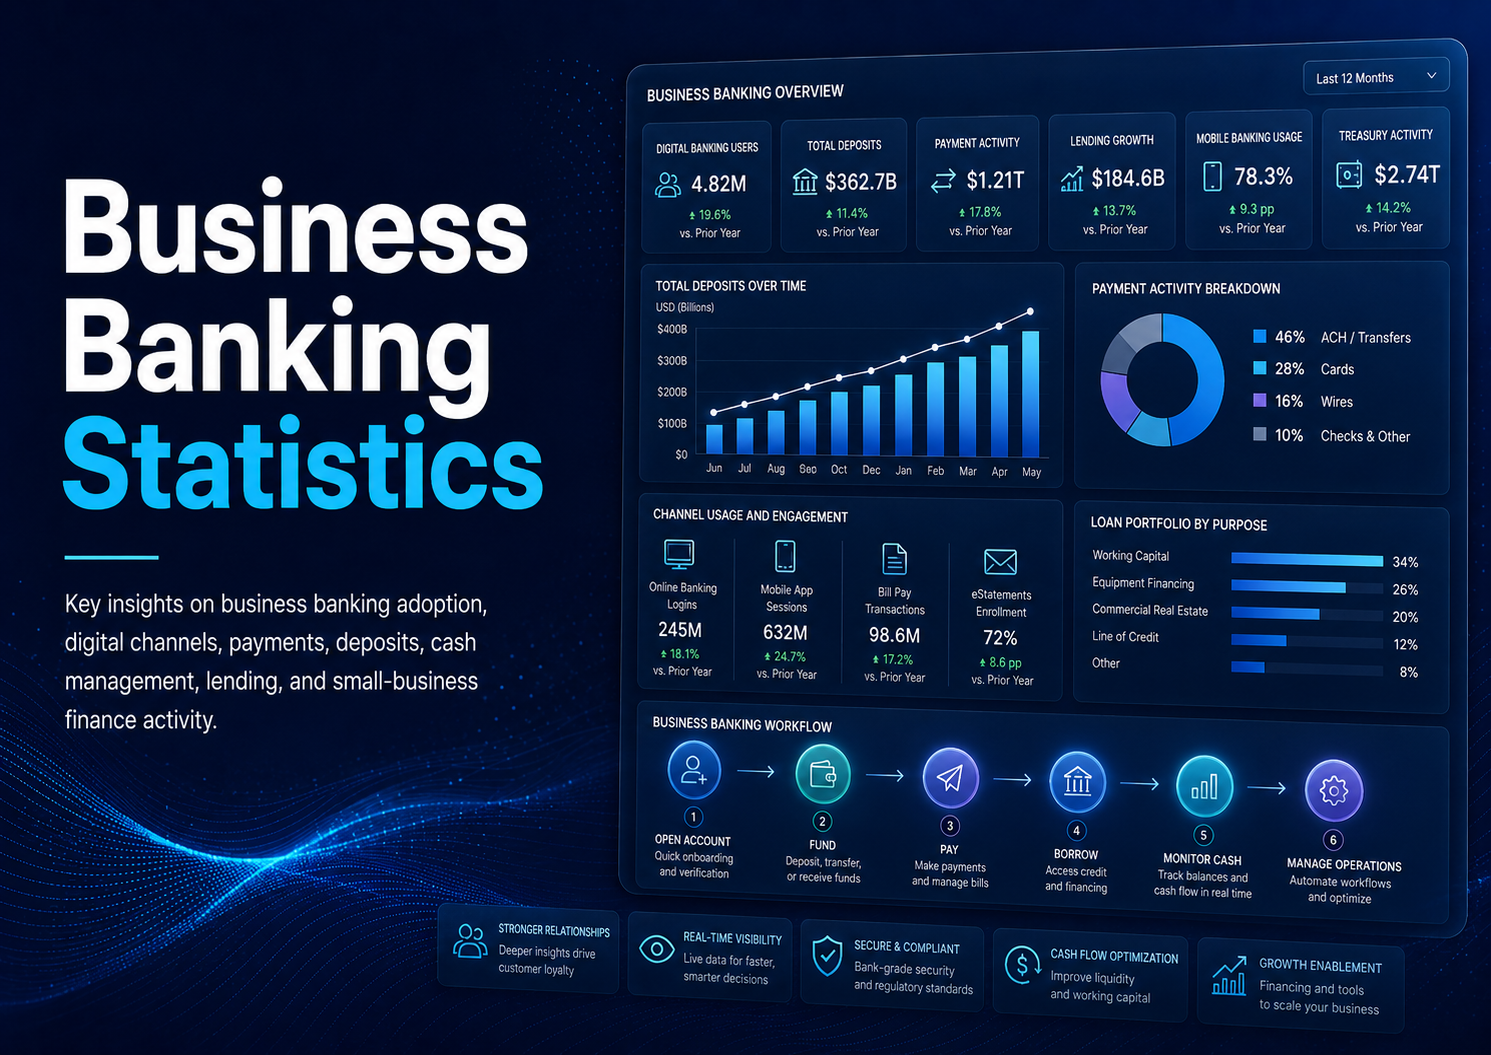
Business Banking Statistics looks at how business banking is changing the way businesses manage finance work, reporting, payments, and day-to-day decisions. The numbers matter because this is not only a software category. It is a measurement of how much financial work still depends on manual entry, delayed follow-up, disconnected records, and decisions made after the useful moment has passed.
For the businesses that use business banking heavily, the pressure usually sits in ordinary operating work: business accounts, cash-flow tools, payment collections, lending decisions, card controls, bank feeds, and account servicing. When those steps are disconnected, finance teams spend too much time explaining status, correcting records, chasing evidence, and rebuilding reports that should already be available from the system.
The best way to read these statistics is to separate market growth from operational maturity. Market forecasts show how much vendors and buyers are investing. Operating statistics show whether the workflow is actually improving. Both matter, but they answer different questions. A large market does not prove a company has a strong process, and a strong internal process does not always require the most expensive platform.
This article treats the statistics as decision tools rather than decoration. The goal is to explain what the numbers mean for business owners, finance managers, controllers, bank relationship teams, lenders, payment providers, and accountants, and how finance leaders can use them to evaluate workflow quality, cash-flow visibility, risk, and productivity without relying on generic claims.
Key Business Banking Statistics and Operational Benchmarks
Global Market Scale & Institutional Shifts
-
The $52.3 Billion SMB Digital Banking Footprint: The global small business digital banking market was valued at $22.4 billion in 2025 and is projected to expand to $52.3 billion by 2034.
-
The 9.6% Market Vector CAGR: This multi-billion-dollar trajectory represents an implied 9.6 percent CAGR, functioning as a clear signal of global enterprise migration away from legacy, manual banking portals.
-
The $87.7 Billion Macro Digital Banking Wave: Broadening the definition to encompass the aggregate individual, corporate, and SME digital ecosystems reveals a macro market climbing from a $18.91 billion baseline to $87.77 billion by 2034, clocking an aggressive 18.6% CAGR.
-
Euro-Area Asset Accumulation Trends: Documenting the steady expansion of tech-first financial infrastructure, the European Central Bank (ECB) reported that digital banks increased their total share of euro-area bank assets from 3.1 percent in 2019 to 3.9 percent in 2024.
-
The 3.5x Small-Business Revenue Premium: Highlighting why modern financial institutions target this segment, corporate analytics from Fiserv reveal that while small businesses constitute an average of only 10% of a bank’s total accounts, they generate a massive 35% of its overall revenue.
-
Real-Time Payment Network Mainstreaming: The corporate transition to instantaneous settlement is accelerating; the real-time payment (RTP) network surpassed $481 billion in transaction value in a single quarter, while the Federal Reserve’s FedNow network connected to over 1,500 financial institutions.
-
The $2 Trillion Private Credit Alternative: Corporate borrowers are increasingly bypassing traditional banking gatekeepers; the private credit asset class has exploded past $2 trillion in global assets under management (AUM), capturing market share from cautious commercial banking lines.
Cash Flow Visibility & Automated Liquidity Tools
-
The 50% Cash Tool Adoption Floor: Highlighting a sharp shift in back-office behavior, Javelin’s small-business banking research reports that integrated cash-flow forecasting and liquidity tools are projected to reach at least half (50%) of the total small-business market.
-
Reclaiming 25 Hours per Month via Bank Feeds: Streaming live transaction data directly from enterprise bank accounts into accounting platforms via secure APIs eliminates manual CSV parsing, saving finance teams an average of 25 hours of manual labor per month.
-
The 71% Reconciliation Mandate: Modern bookkeepers and corporate controllers reject disconnected systems, with 71% of surveyed software users identifying automated bank feeds and automated ledger reconciliation among their absolute most valued product features.
-
The $2.98 Billion Cash Forecasting Tool Boom: Driven by intense economic volatility, the global market for specialized SME cash flow forecasting software is projected to scale from a $1.45 billion baseline up to $2.98 billion by 2034, maintaining a steady 8.4% CAGR.
-
Financial Process Automation Capital Pools: The broader global software market for financial process automation is experiencing strong mid-decade growth, rising from $12.3 billion to $14.02 billion at an annual 14% CAGR.
Operational Risks & Servicing Disruptions
-
The 2.7% Severe Account Disruption Trap: Illustrating the operational risk of “debanking” and sudden cash freezes, a UK parliamentary review found that eight major legacy banks abruptly closed nearly 142,000 small-business accounts in a single year, effectively disrupting 2.7 percent of the market’s 5.3 million total active accounts.
-
Algorithmic Fraud Defenses: To simplify client onboarding without expanding security vulnerabilities, data from the Bank for International Settlements (BIS) shows that 55% of global banking operations have integrated AI-driven chatbots and automated biometric verification.
-
The 45% Cybersecurity Adoption Barrier: Reconciling rapid software adoption with user hesitation, the Federal Trade Commission (FTC) reports that 45% of business operators and consumers explicitly cite cybersecurity and fraud risks as the main barrier to utilizing digital banking tools.
-
The 70% Mobile-First Corporate Demand: Proving that accounting work has left the physical desk, 70% of business digital banking users state they explicitly prefer mobile-based solutions due to their immediate convenience and 24/7 operational accessibility.
Performance Scorecards & Optimization Frameworks
-
The Six-Point Balanced Corporate Banking Scorecard: High-performing finance teams optimize their capital positions by ditching vanity metrics and tracking an active scorecard built across six key variables: real-time cash positions, payment settlement timing, API bank-feed sync reliability, account service response latency, corporate lending readiness, and overall payment-method mix optimization.
-
Managing the Six Core Workflow Risk Profiles: Advanced banking automation platforms are built to isolate and eliminate six structural cash-flow leaks: account access disruptions, weak cash management tools, delayed fund transfers, erratic bank-feed connection drops, limited short-term lending visibility, and fragmented multi-channel payment flows.
-
The Cycle Time Optimization Premium: For an operating business, compressing cash deployment and transfer validation cycles by 20 percent yields significantly higher net balance-sheet value than bargaining with software vendors for a minor 5 percent reduction in standalone software licensing costs.
-
The Three-Dimensional Dashboard Standard: Corporate treasurers maintain complete ledger health by monitoring an operational dashboard that compares three distinct views simultaneously: total transaction volume throughput, active exception or error volumes, and actual business outcome movement (such as realized cash position).
-
The Embedded Banking Scorecard Rule: To see whether financial features are translating into genuine corporate value, leadership must configure system scorecards to directly connect the active user activation rate with the final platform take rate.
How to Read These Statistics Correctly
Business Banking statistics are easy to overread when every number is treated as a direct performance benchmark. A market-size estimate measures vendor revenue and spending activity. A workflow statistic measures how work is actually performed inside a company. A late-payment or cash-flow statistic measures business pressure. Those categories should be connected, but they should not be treated as the same type of evidence.
The first distinction is category demand versus process maturity. A business can buy modern software and still operate with weak controls if users keep approvals in email, update spreadsheets outside the system, or delay reconciliation until month-end. For business banking, the practical test is whether the workflow changes daily behavior in business accounts, cash-flow tools, payment collections, lending decisions, card controls, bank feeds, and account servicing.
The second distinction is adoption versus depth. A company may say it uses automation because one task is digital, but real maturity comes when status, evidence, ownership, and exception handling are visible together. That is why statistics about cash-flow tools, digital account servicing, real-time payments, nonbank finance should be paired with internal baselines such as cash position, payment timing, bank-feed reliability, account service response, lending readiness, and payment-method mix.
Definitions also vary by company size. A small business may define success as fewer owner interruptions and cleaner tax records. A midmarket company may define success as faster approvals, stronger reporting, and fewer month-end corrections. An enterprise may define success through audit trails, segregation of duties, and policy compliance across entities.
The most useful reading method is to ask what decision the statistic supports. If a number helps a manager decide where to automate, which workflow to fix, which risk to control, or which KPI to watch, it has practical value. If it only repeats that a market is growing, it belongs in context rather than at the center of the business case.
How to Read These Statistics Correctly – practical statistics and checkpoints
- The future of business banking is shaped by automation, integration, reporting, and better workflow status.
- AI will help most with repetitive classification and exception triage before it replaces high-risk finance decisions.
- The next stage of maturity will connect business accounts, cash-flow tools, payment collections, lending decisions, card controls, bank feeds, and account servicing into cleaner decision workflows.
- Companies that measure baseline quality before changing tools will be better positioned to prove improvement.
- A practical review rhythm is 30 days for baseline cleanup, 60 days for adoption review, and 90 days for confirmed process improvement.
Market Size and Growth Outlook
The market outlook for business banking shows continuing investment in digital finance infrastructure. The small business digital banking market was estimated at $22.4 billion in 2025 and projected at $52.3 billion by 2034; demand is tied to cash-flow tools, digital account servicing, real-time payments, and accounting-bank-feed integration. The chart below uses one selected public estimate as a directional view, not a universal definition of the entire category. That distinction is important because many finance software markets overlap with payments, automation, services, ERP modules, and analytics.
Growth is being driven by practical operating pressure. Companies want fewer disconnected tools, earlier visibility into status, and a better way to manage business bank accounts, cash-flow tools, payment collections, lending decisions. The demand is not only for software screens. It is for a more reliable process that gives managers usable information before a delay becomes a cash, tax, customer, or audit problem.
Vendor categories are also expanding. Platforms that once solved one narrow task increasingly include integrations, dashboards, workflow automation, AI assistance, approval controls, and document storage. That broader packaging can increase market estimates, but it also reflects how buyers now evaluate solutions: they want a workflow layer rather than another isolated database.
The market-growth statistic is most useful when it is tied back to internal readiness. A growing category means more product options and more vendor claims. It does not automatically mean every buyer should implement a large system. A company should first identify the workflow bottleneck, the volume affected, the cost of delay, and the control risk created by the current process.
For finance leaders, the forecast supports a planning conclusion: business banking will likely become more integrated, automated, and data-driven. Teams that still rely on email status updates, delayed spreadsheet exports, and after-the-fact cleanup will face a widening gap between how finance work is performed and how quickly the business expects answers.
Market Size & Growth Outlook – practical statistics and checkpoints
- The selected public forecast starts at 22.4 USD billions in 2025 and reaches 52.3 USD billions by 2034.
- The forecast CAGR used in the chart is 9.6 percent.
- The small business digital banking market was estimated at $22.4 billion in 2025 and projected at $52.3 billion by 2034; demand is tied to cash-flow tools, digital account servicing, real-time payments, and accounting-bank-feed integration.
- Market totals should be compared with operating metrics such as cash position, payment timing, bank-feed reliability, account service response, lending readiness, and payment-method mix.
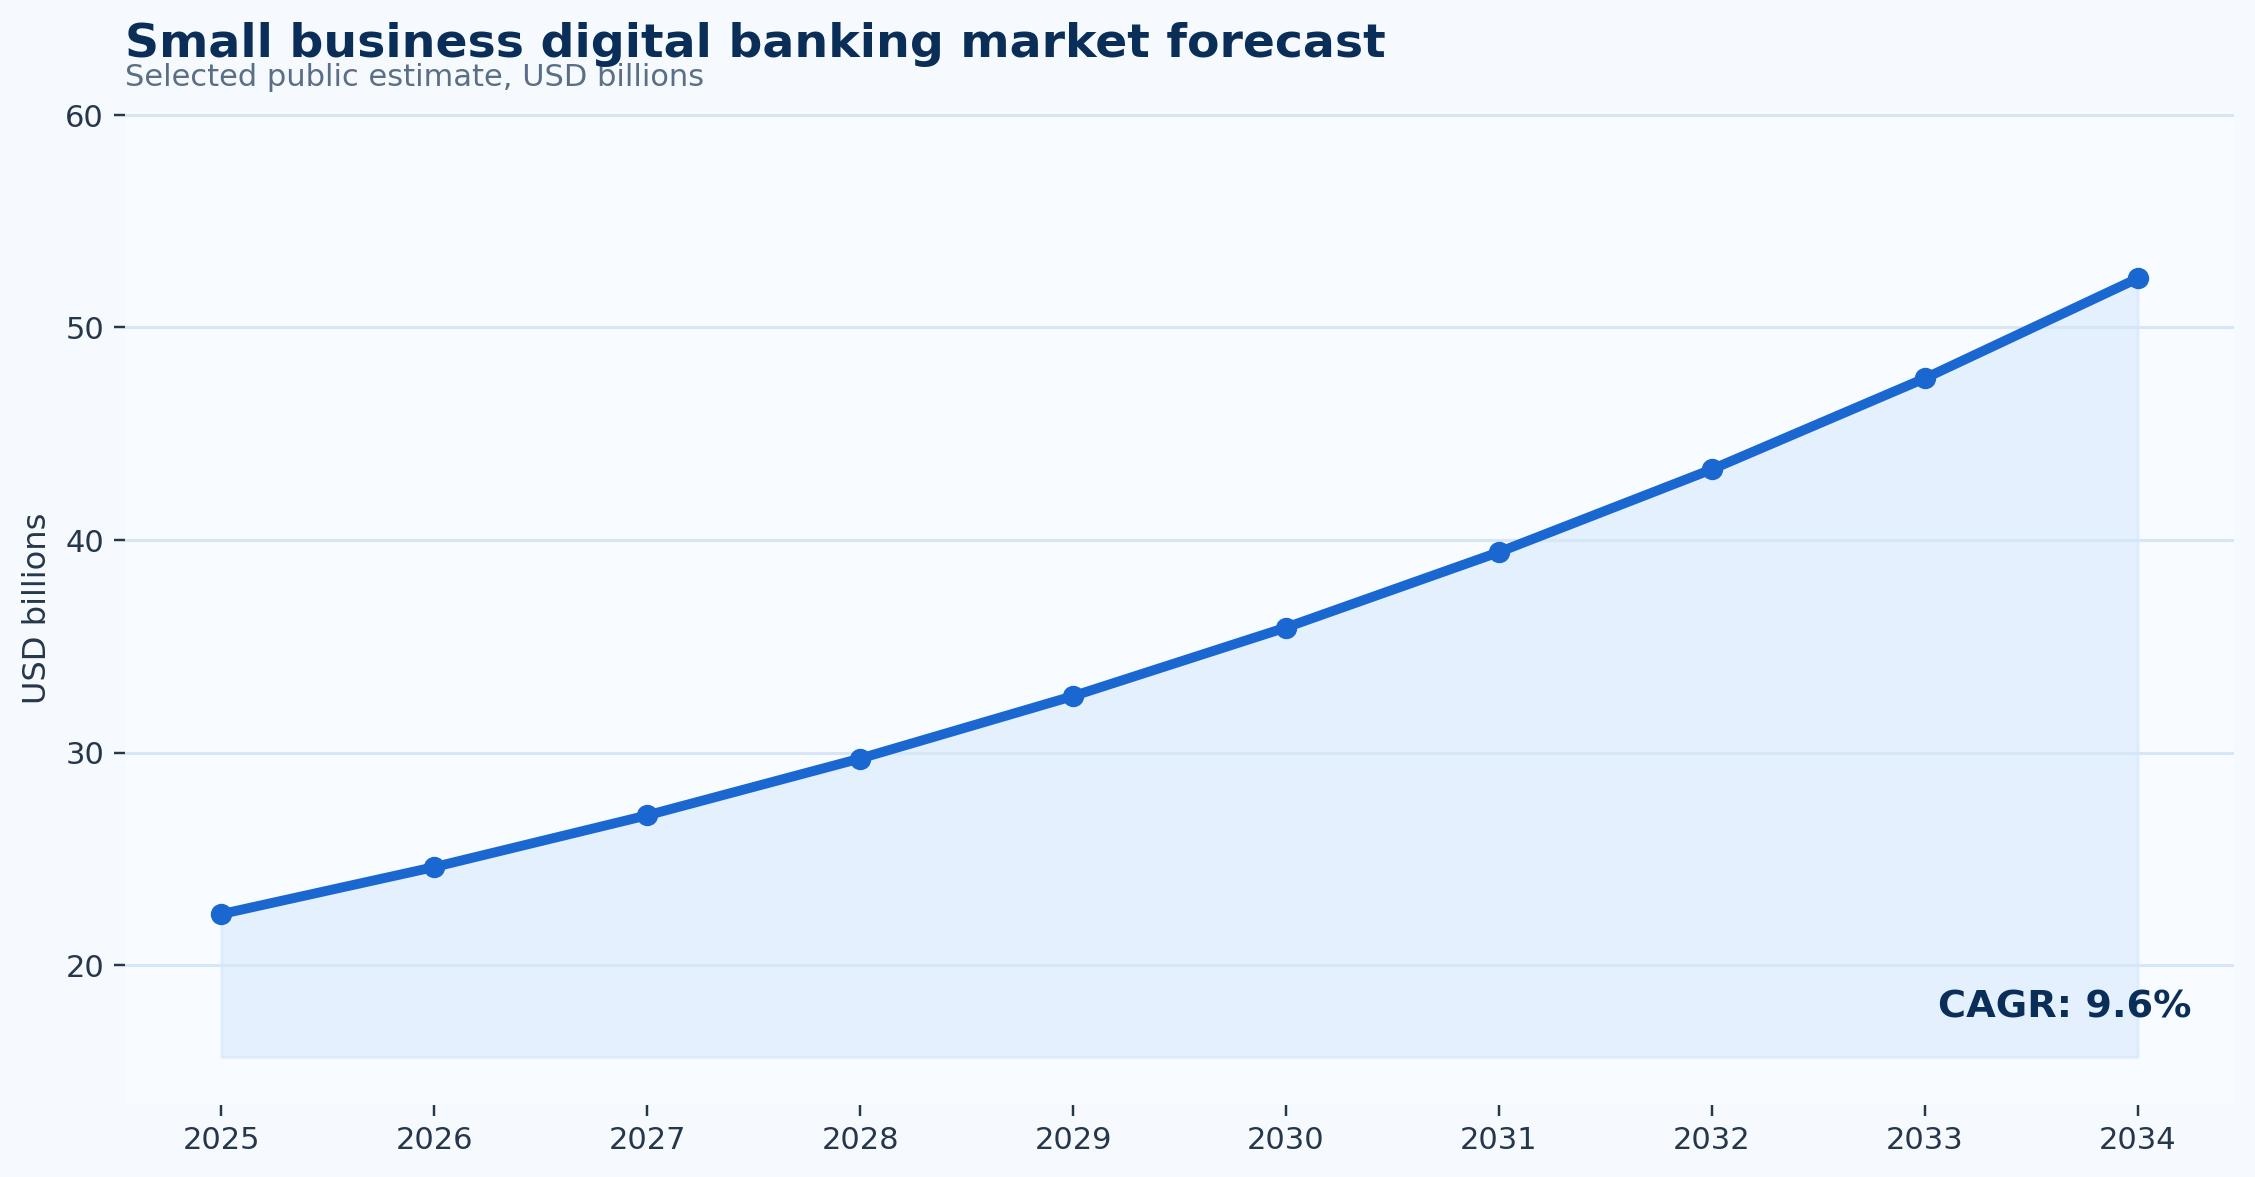
Figure 1. Public estimates show the directional growth path for business banking and adjacent finance software categories.
Why the Workflow Still Needs Improvement
Workflow improvement matters because the official system often shows only the final record, not the work required to create it. In business banking, users may collect documents, answer status questions, verify payment details, chase approvals, or correct coding before the record is ready. That invisible labor is one reason a process can feel expensive even when software is already in place.
The deepest friction usually appears at handoff points. A receipt moves from an employee to a manager. An invoice moves from sales to finance. A bank transaction moves from the feed to the ledger. A timesheet moves from a consultant to a project manager. Every handoff can create delay if ownership, evidence, and status are unclear.
Weak workflow design also makes performance hard to measure. A manager may know that reporting is late, but not whether the delay came from missing documents, slow approval, unclear coding, poor integration, customer nonpayment, or manual reconciliation. Without that breakdown, improvement becomes guesswork and teams may buy tools that do not address the real constraint.
The main risks in this topic are account access disruption, weak cash tools, delayed transfers, poor bank-feed reliability, limited lending visibility, and fragmented payment channels. These risks are not abstract. They affect cash planning, customer communication, supplier confidence, tax preparation, audit support, and the amount of time finance spends explaining what happened after the fact.
A better workflow turns status into an operating asset. Each item should show whether it is new, waiting for evidence, waiting for approval, disputed, ready for payment, paid, reconciled, or closed. Once status is visible, leaders can manage queues, aging, exceptions, and workload instead of relying on individual memory.
Why the Workflow Still Needs Improvement – practical statistics and checkpoints
- A useful workflow baseline should list every manual handoff in business accounts, cash-flow tools, payment collections, lending decisions, card controls, bank feeds, and account servicing.
- The most common risk areas are account access disruption, weak cash tools, delayed transfers, poor bank-feed reliability, limited lending visibility, and fragmented payment channels.
- A practical process map should show who owns the item, what evidence is missing, the current status, and the next action.
- A strong business banking workflow reduces repeated status questions because managers can see progress without asking finance to reconstruct it.
- A practical review rhythm is 30 days for baseline cleanup, 60 days for adoption review, and 90 days for confirmed process improvement.
Automation and AI Are Changing the Operating Model
Automation changes business banking by moving routine decisions into predefined rules and connected systems. That can include capture, categorization, reminders, approval routing, exception queues, matching, or reporting. The value comes from removing repeated low-judgment work while keeping risk-based review where it belongs.
AI adds another layer by helping identify patterns that are difficult to manage manually. In this context, AI can suggest categories, highlight unusual items, summarize status, prioritize exceptions, or detect records that look inconsistent with past behavior. These capabilities are useful only when they support a clear process rather than creating another black box.
The best automation designs preserve accountability. A system may recommend a coding choice, flag a duplicate, or route a record to the right owner, but finance still needs thresholds, review rules, audit logs, and human judgment for high-risk items. That balance is especially important when money movement, customer balances, supplier records, or tax evidence is involved.
Automation also changes what the finance team does each day. Instead of spending time on repeated entry and status chasing, staff can focus on exceptions, policy questions, customer or supplier issues, data quality, and analysis. That shift is a major part of the ROI, even when headcount does not immediately decline.
For business banking, the most mature operating model is not fully hands-off. It is a controlled workflow where routine items move quickly, unusual items are visible, and every important action is recorded. That is a better target than simply trying to automate every task without understanding which exceptions matter.
Automation & AI Are Changing the Operating Model – practical statistics and checkpoints
- Automation creates the most value when routine steps in business accounts, cash-flow tools, payment collections, lending decisions, card controls, bank feeds, and account servicing follow rules instead of individual inbox habits.
- AI is most useful as an assistant for categorization, anomaly detection, status summarization, and exception prioritization.
- High-risk finance decisions still need human review, approval thresholds, and audit evidence.
- Automation should reduce manual touches without hiding the reason a transaction moved forward.
- A practical review rhythm is 30 days for baseline cleanup, 60 days for adoption review, and 90 days for confirmed process improvement.
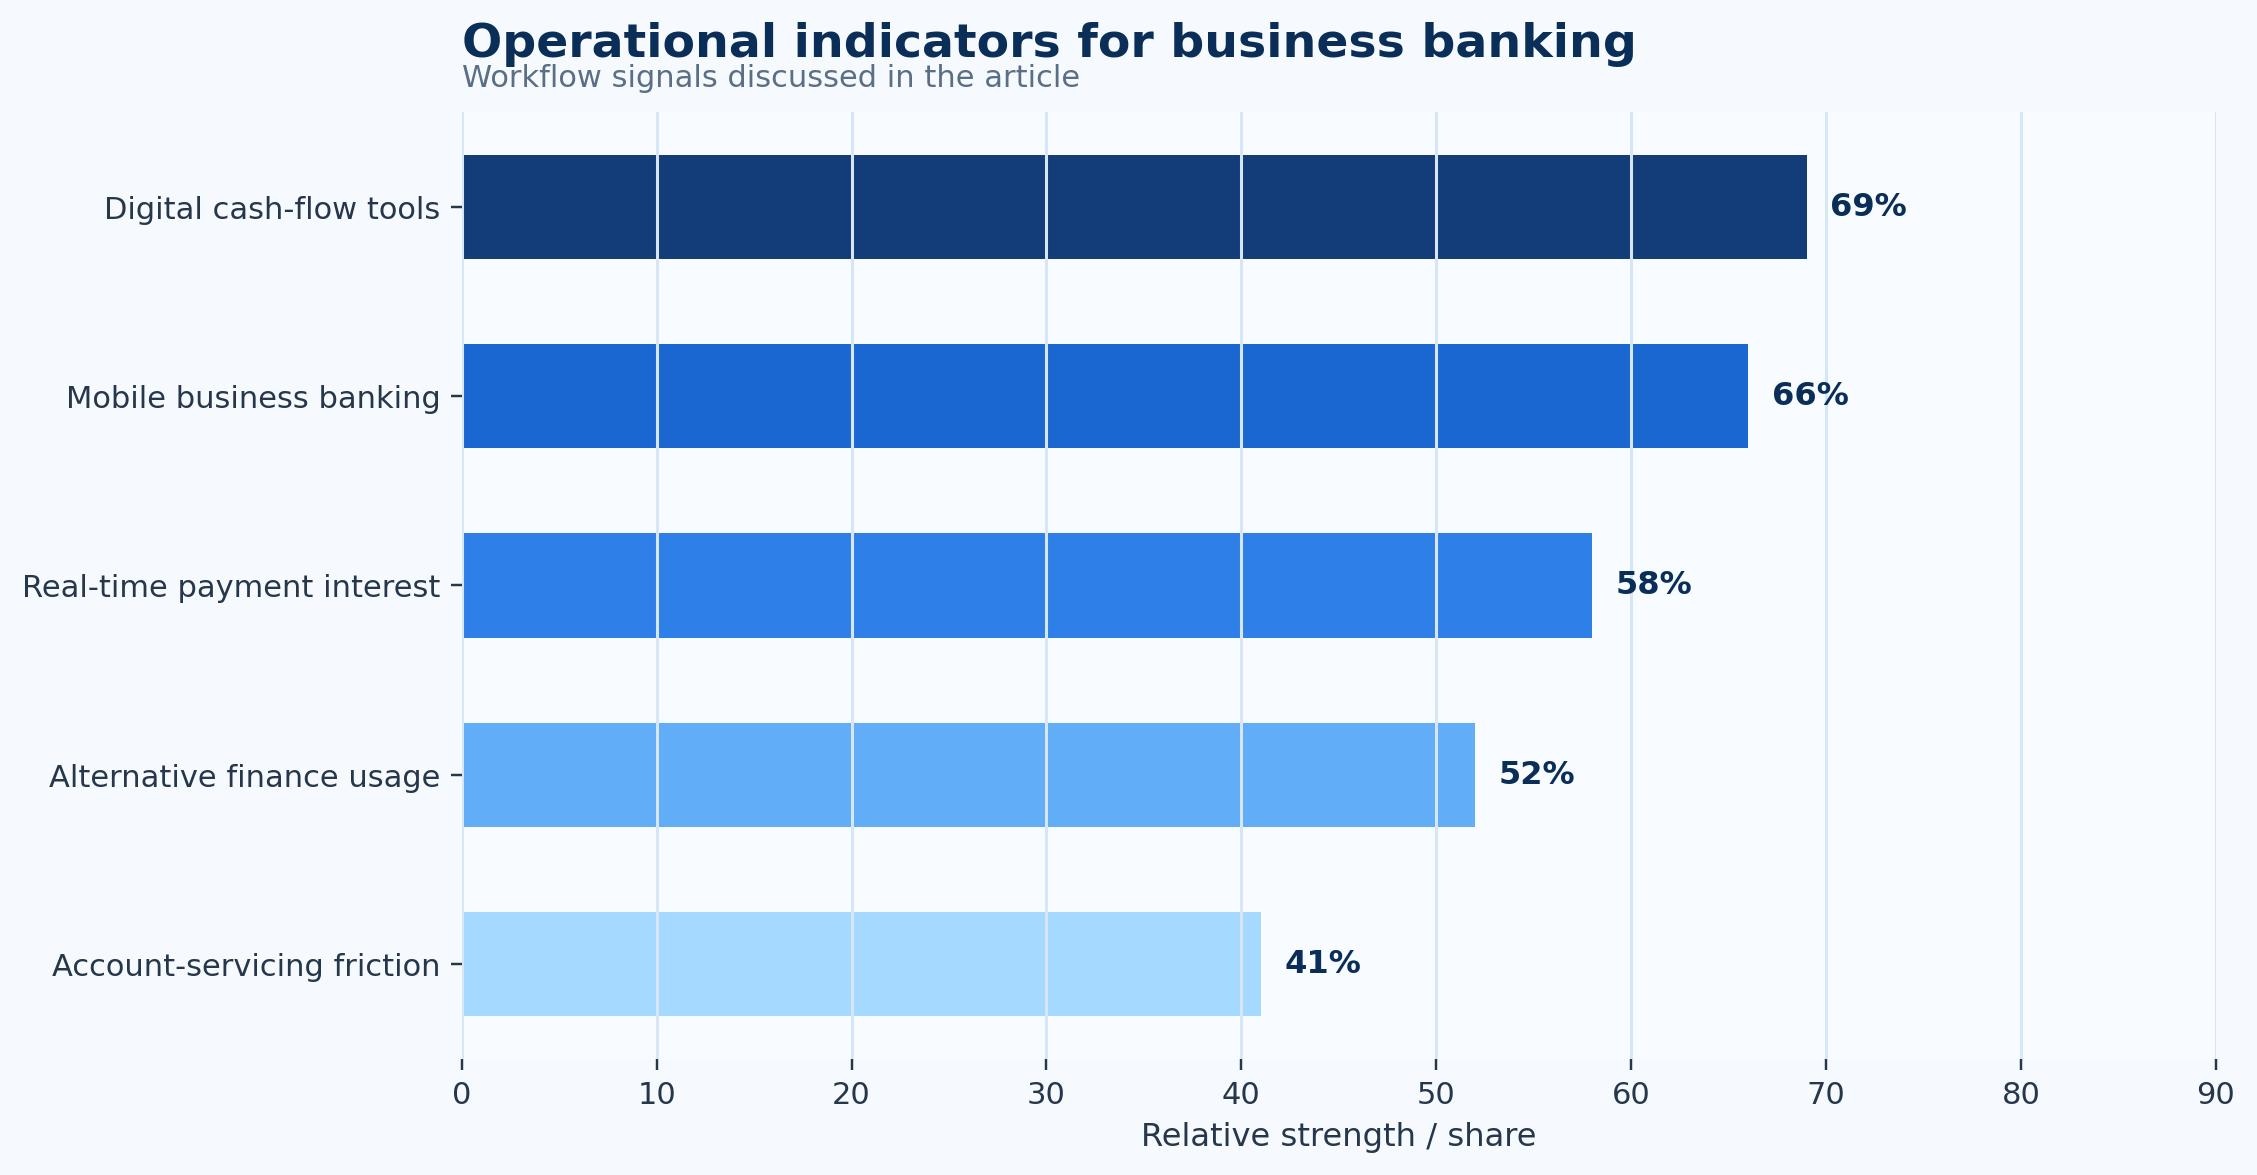
Figure 2. Operational indicators show why business banking adoption is tied to workload, visibility, and process quality.
Cash Flow, Billing, and Payment Impact
The financial impact of business banking is strongest when the process connects to cash timing. Records that are late, incomplete, or unclear can distort payment decisions, collection follow-up, credit planning, project margin, or supplier scheduling. A clean workflow improves the timing of information, not only the final accuracy of the accounting record.
Cash visibility depends on knowing what is expected, what is delayed, what is approved, and what still needs action. In many companies, these signals sit in different places: bank portals, accounting software, project tools, payment processors, email, and spreadsheets. Business Banking becomes more valuable when it brings those signals into a single management view.
Billing and payment issues often reveal workflow weaknesses before management reporting does. Unpaid invoices, delayed approvals, missing receipts, unbilled project work, or unreconciled bank transactions can all create misleading comfort. Revenue may look healthy while cash is late; expenses may look controlled while reimbursements are still waiting in employee inboxes.
The practical cash-flow question is whether the business can see enough early enough to act. If an invoice is overdue, a manager should know whether it was never sent, never opened, disputed, awaiting approval, or simply unpaid. If a cost is missing evidence, finance should know who owns the document and how long it has been outstanding.
The strongest finance teams measure both process and outcome. Process metrics explain why work is slow; cash metrics show whether the delay matters. Together, they help leaders decide whether to change policy, automate a step, improve customer communication, adjust payment timing, or add controls.
Cash Flow, Billing, & Payment Impact – practical statistics and checkpoints
- Business Banking affects cash visibility when timing, status, and evidence are connected before the month closes.
- Late or incomplete records can distort payment planning, collection follow-up, and management reporting.
- Cash-flow value should be measured through forecast variance, aging, outstanding balances, payment timing, and unresolved exceptions.
- The business case becomes stronger when finance can connect process speed with working-capital decisions.
- A practical review rhythm is 30 days for baseline cleanup, 60 days for adoption review, and 90 days for confirmed process improvement.
Small Business and Midmarket Implications
Small businesses often experience business banking as an owner-time problem before they experience it as a formal finance transformation. The owner may approve bills, chase payments, reconcile bank activity, answer accountant questions, and search for records. Even small improvements can matter because the same person often handles sales, operations, and finance decisions.
For small teams, the best system is usually the one that reduces daily interruption. A dashboard that shows unpaid invoices, missing receipts, upcoming bills, reconciliation status, or project billing readiness can save more time than a complex platform that requires heavy setup. Simplicity, clean reminders, and reliable records are often more valuable than broad feature lists.
Midmarket companies face a different problem. They usually have more users, more approvals, more customers or vendors, and more risk of process drift between teams. They need stronger permissions, integration, role clarity, and exception reporting. At that stage, the main benefit of business banking is standardization as well as speed.
Enterprise teams add another layer of complexity: multi-entity reporting, audit requirements, approval thresholds, policy enforcement, and integration with ERP, banking, procurement, payroll, or project systems. Their business case may include risk reduction and control quality as much as productivity.
The implication is that benchmarks should not be copied blindly. A small business should not evaluate itself against a shared-services center, and an enterprise should not accept a lightweight workflow if it cannot support controls. The right maturity target depends on volume, complexity, staffing, and risk.
Small Business & Midmarket Implications – practical statistics and checkpoints
- Small businesses often value business banking because it reduces owner follow-up and routine finance admin.
- Midmarket teams usually need stronger permissions, integrations, approval rules, and exception reporting.
- Enterprise teams focus more heavily on controls, auditability, multi-entity reporting, and policy enforcement.
- The right benchmark changes by volume, staffing model, transaction complexity, and risk exposure.
- A practical review rhythm is 30 days for baseline cleanup, 60 days for adoption review, and 90 days for confirmed process improvement.
Industry Differences and Use-Case Patterns
Industry differences matter because the same finance metric can mean different things depending on the operating model. Small businesses, professional services, ecommerce sellers, contractors, nonprofits, restaurants, and high-growth startups may all use business banking, but their records, approvals, evidence, and cash cycles can be very different. A project-based company may care about milestones and change orders; a retailer may care more about volume, deposits, and daily reconciliation.
The use cases also change by industry. For this topic, common use cases include business bank accounts, cash-flow tools, payment collections, lending decisions. Each use case produces different data and different failure points. A missing receipt is not the same as an unpaid invoice, and an unbilled project milestone is not the same as an unreconciled bank transaction.
Industry-specific workflows should shape implementation priorities. A contractor may need job-level evidence and change-order discipline. An ecommerce seller may need bank-feed and payment processor reconciliation. A consulting firm may need time capture and billing readiness. A nonprofit may need fund or grant documentation.
Averages can hide those differences. A category may appear mature because large companies have adopted strong systems, while small firms in the same industry still rely on manual records. Another category may appear less automated because the workflow itself is more complex and requires more exception handling.
The most useful statistics break the workflow into segments: customer type, vendor type, department, location, project, payment method, aging bucket, transaction type, and exception reason. That level of detail helps leaders see where the process is truly strong and where the headline average is hiding work.
Industry Differences & Use-Case Patterns – practical statistics and checkpoints
- The most relevant industries include small businesses, professional services, ecommerce sellers, contractors, nonprofits, restaurants, and high-growth startups.
- Industry workflows change the meaning of the same metric; a normal billing cycle in project work may be slow for retail transactions.
- Useful breakdowns include customer, vendor, project, department, location, service line, payment status, and aging bucket.
- A good comparison uses workflow similarity, not only industry labels.
- A practical review rhythm is 30 days for baseline cleanup, 60 days for adoption review, and 90 days for confirmed process improvement.
Controls, Compliance, and Audit Readiness
Controls are one of the main reasons business banking matters beyond productivity. A fast process is not enough if it cannot show who approved a transaction, what evidence supported it, whether policy was followed, and how exceptions were resolved. Finance teams need records that can stand up to review, not only records that move quickly.
Audit readiness depends on completeness. Documents, approvals, comments, payment status, reconciliation evidence, and changes to key data should be easy to retrieve. When evidence is scattered across inboxes and spreadsheets, audit work becomes a reconstruction exercise and finance staff lose time answering questions that a clean workflow should answer automatically.
Compliance needs vary by topic. Expense management may focus on policy limits and receipt evidence. Project billing may focus on client approval and contract terms. Business banking may focus on authorized users and account controls. Cloud accounting may focus on permissions, bank reconciliation, and tax records. The common requirement is a complete trail.
Automation can strengthen controls when rules are configured carefully. Approval thresholds, role-based access, duplicate checks, exception queues, and review logs reduce reliance on informal follow-up. Poorly configured automation, however, can move bad data faster, so control design should be part of implementation from the beginning.
The strongest control metric is not simply whether an item was processed. It is whether the organization can explain the item after the fact. If a manager, auditor, lender, tax preparer, or customer asks for the record, the system should show the evidence, approval, timing, and resolution without a long search.
Controls, Compliance, & Audit Readiness – practical statistics and checkpoints
- Control quality depends on evidence, role clarity, approval thresholds, audit trails, and exception ownership.
- Key risks include account access disruption, weak cash tools, delayed transfers, poor bank-feed reliability, limited lending visibility, and fragmented payment channels.
- The strongest systems record who acted, when the action happened, what changed, and which evidence supported the decision.
- Audit readiness improves when records are complete before the auditor, tax preparer, lender, or manager asks for them.
- A practical review rhythm is 30 days for baseline cleanup, 60 days for adoption review, and 90 days for confirmed process improvement.
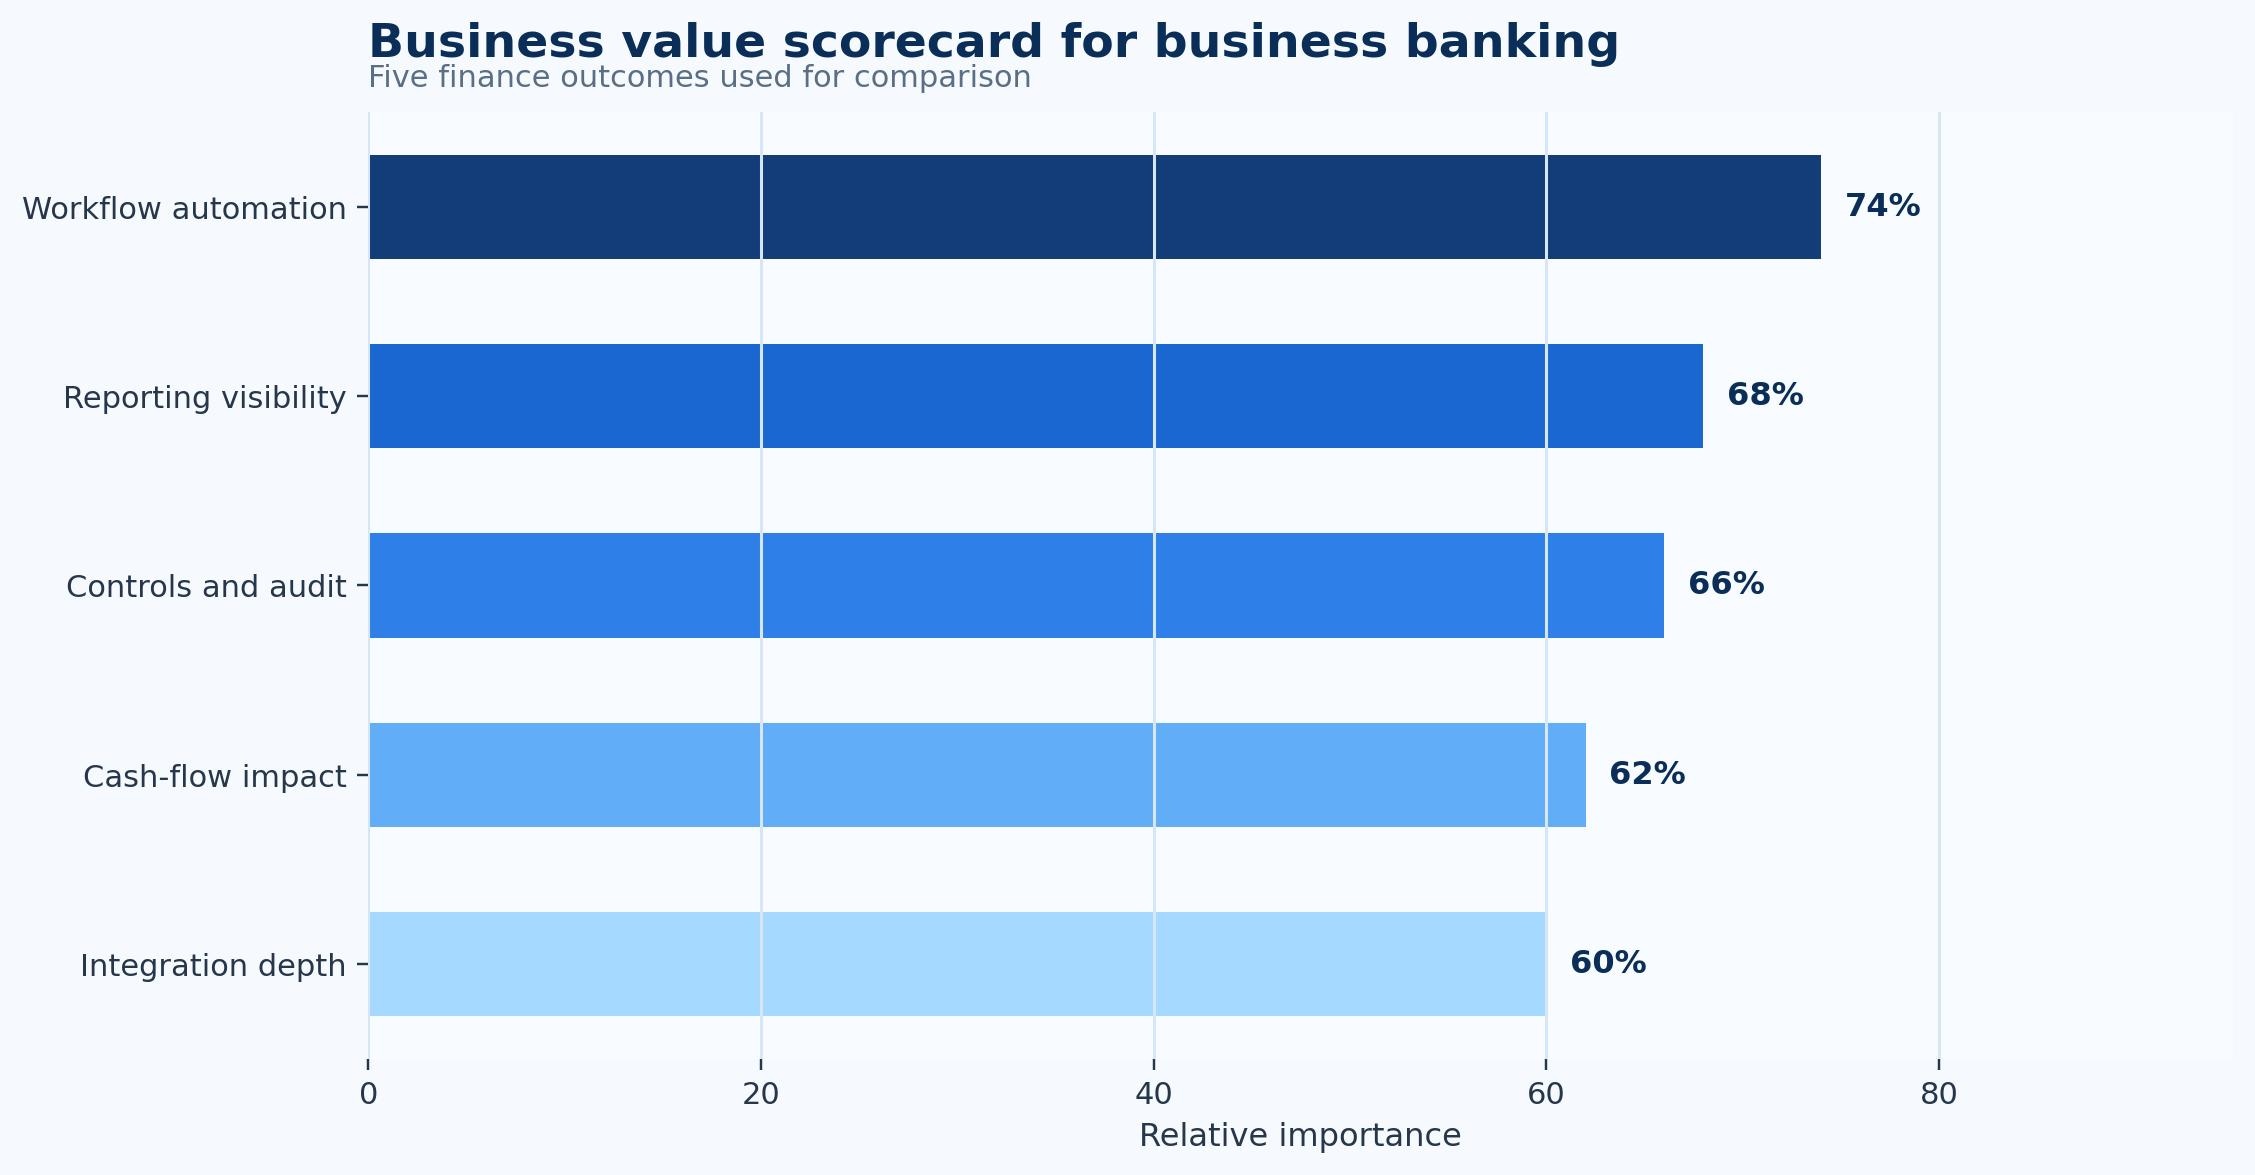
Figure 3. The value of business banking is spread across workflow automation, reporting, controls, cash-flow visibility, and integrations.
Implementation Barriers and Change Management
Implementation problems often come from process design, not technology alone. Teams may buy a tool while leaving old habits intact: invoices sent to personal inboxes, receipts stored on phones, approvals made in chat, and reports rebuilt in spreadsheets. The system then becomes another layer rather than a replacement for manual work.
Data quality is a major barrier. Supplier names, customer records, product codes, project references, employee details, and bank rules must be clean enough for automation to work. If the reference data is poor, the system will create exceptions that users must resolve manually, reducing confidence in the new process.
Change management is equally important. Users need to know why the workflow is changing, what the new status rules mean, when approval is required, and how exceptions should be handled. Without that clarity, employees may route work around the system because the informal path feels faster.
Integration also determines whether the project succeeds. Business Banking often needs to connect with accounting software, bank feeds, payment processors, payroll tools, project systems, customer records, document storage, or ERP modules. Weak integration can create duplicate work even when one part of the process improves.
A practical rollout starts with a narrow, high-impact workflow. The team should measure the baseline, clean the key data, define ownership, configure rules, train users, and review exceptions after launch. That approach builds confidence before expanding the system across more processes.
Implementation Barriers & Change Management – practical statistics and checkpoints
- A strong implementation starts with one workflow where business banking creates measurable friction.
- The baseline should include volume, cycle time, backlog, error rate, exception reasons, and owner response time.
- Data cleanup is usually as important as software setup because poor master data creates avoidable exceptions.
- Training should explain which tasks are being automated and which judgment-based responsibilities remain human-led.
- A practical review rhythm is 30 days for baseline cleanup, 60 days for adoption review, and 90 days for confirmed process improvement.
A Practical Example of Better Workflow Design
Consider a small ecommerce business that receives sales through multiple processors, pays suppliers weekly, and needs banking tools that show real cash availability rather than only yesterday’s balance. The company does not necessarily have a technology shortage. It has a status problem. People know their individual pieces of work, but no one has a reliable view of the full workflow, the missing evidence, the aging items, and the next action needed to move each record forward.
The first improvement is to map the workflow in plain language. What starts the process? Which record is created? Which evidence is required? Who approves it? What happens if information is missing? Which system becomes the source of truth? That map usually reveals repeated delays that were previously treated as isolated problems.
The second improvement is to define status categories. For business banking, those categories may include received, incomplete, pending approval, disputed, ready to bill, paid, reconciled, closed, or exception review. The exact labels differ, but the principle is the same: every item should have a visible state and owner.
The third improvement is to connect reporting to daily work. A dashboard should not be a decorative summary. It should show the items that need attention, the reason they are delayed, the owner responsible, and the business impact. That connection turns data into workflow management.
The final improvement is to review the scorecard after implementation. If cash position, payment timing, bank-feed reliability, account service response, lending readiness, and payment-method mix improve, the workflow change is producing value. If the metrics do not improve, the team should look for the next constraint rather than assuming the software failed.
A Practical Example of Better Workflow Design – practical statistics and checkpoints
- A useful workflow baseline should list every manual handoff in business accounts, cash-flow tools, payment collections, lending decisions, card controls, bank feeds, and account servicing.
- The most common risk areas are account access disruption, weak cash tools, delayed transfers, poor bank-feed reliability, limited lending visibility, and fragmented payment channels.
- A practical process map should show who owns the item, what evidence is missing, the current status, and the next action.
- A strong business banking workflow reduces repeated status questions because managers can see progress without asking finance to reconstruct it.
- A practical review rhythm is 30 days for baseline cleanup, 60 days for adoption review, and 90 days for confirmed process improvement.
Benchmarking and Scorecard Design
Benchmarking works best when it starts with the company’s own process. Public statistics provide context, but the real baseline comes from internal volume, aging, backlog, errors, exceptions, and cash impact. A company should know how many items enter the workflow, how long they wait, why they get stuck, and what happens when they are late.
A balanced scorecard for business banking should include speed, quality, control, cash, and capacity. Speed shows whether work is moving. Quality shows whether records are correct. Control shows whether approvals and evidence are complete. Cash shows whether the timing affects liquidity. Capacity shows whether the team can scale without proportional manual effort.
Scorecards should avoid vanity metrics. A high number of processed records can look positive while hiding a growing exception backlog. A low average cycle time can hide a few very old problem items. A large market forecast can look impressive while saying nothing about whether a company’s workflow is healthy.
The best benchmark is one that leads to an action. If exception aging rises, the team investigates owners and causes. If cash forecast variance widens, the team reviews payment timing and collection status. If receipt completeness falls, the team changes employee reminders or card controls.
For business banking, the most valuable benchmark usually combines a headline KPI with a cause breakdown. A number such as approval cycle time becomes much more useful when it is split by department, amount, customer, project, vendor, or exception reason.
Benchmarking & Scorecard Design – practical statistics and checkpoints
- Core metrics for business banking: cash position, payment timing, bank-feed reliability, account service response, lending readiness, and payment-method mix.
- Each metric should have an owner, a measurement period, a threshold, and an action when the number moves outside the target range.
- A useful scorecard separates volume, aging, quality, control, and cash impact.
- The best metric is one that changes a management decision, not one that only looks impressive in a dashboard.
- A practical review rhythm is 30 days for baseline cleanup, 60 days for adoption review, and 90 days for confirmed process improvement.
Metrics Leaders Should Track
Finance leaders should track a focused set of metrics rather than trying to measure everything. For this topic, the core measures include cash position, payment timing, bank-feed reliability, account service response, lending readiness, and payment-method mix. Those metrics show whether the process is becoming faster, cleaner, easier to manage, and more useful for decision-making.
Cycle-time metrics are important because they reveal delay. The relevant cycle might run from invoice issue to payment, receipt submission to reimbursement, time entry to client billing, bank transaction to reconciliation, or document capture to month-end close. The exact start and end points should match the workflow being improved.
Quality metrics show whether speed is reliable. A process that moves quickly but creates rework is not healthy. Leaders should monitor error rate, missing evidence, exception reason, duplicate records, incorrect coding, dispute rate, and reversal or adjustment activity.
Control metrics show whether the process is safe. Useful examples include approval completion, policy exception rate, audit evidence completeness, user permission review, segregation of duties, and overdue exception resolution. These metrics are especially important as automation increases.
Cash and management metrics show whether the workflow supports the business. Depending on the topic, those may include DSO, aging, forecast variance, reimbursement backlog, unbilled work, outstanding balances, supplier payment timing, or working-capital impact. The goal is to connect finance operations to decisions that managers make every week.
Metrics Leaders Should Track – practical statistics and checkpoints
- Core metrics for business banking: cash position, payment timing, bank-feed reliability, account service response, lending readiness, and payment-method mix.
- Each metric should have an owner, a measurement period, a threshold, and an action when the number moves outside the target range.
- A useful scorecard separates volume, aging, quality, control, and cash impact.
- The best metric is one that changes a management decision, not one that only looks impressive in a dashboard.
- A practical review rhythm is 30 days for baseline cleanup, 60 days for adoption review, and 90 days for confirmed process improvement.
Data Quality and Integration Requirements
Data quality determines whether business banking becomes easier to manage or simply more digital. Automation depends on reliable customers, vendors, employees, projects, chart-of-account rules, payment references, and document evidence. If those inputs are incomplete, the system will create queues of exceptions that people still have to resolve manually.
Integration is the second requirement. Business Banking may touch accounting systems, bank feeds, payment processors, payroll tools, project systems, card programs, document storage, CRM records, or ERP modules. A tool that works well in isolation can still fail operationally if users must export and rekey information every week.
The practical test is whether the data moves with enough context. A transaction amount alone is not enough; finance teams often need customer or vendor identity, project code, approval owner, payment status, document evidence, tax treatment, and reconciliation status. Missing context creates delays even when the basic transaction has been captured.
A good implementation includes a cleanup phase. Teams should review duplicate customer or vendor names, old categories, inconsistent project codes, missing receipt rules, unresolved bank-feed matches, and open items that no longer have an owner. That work may feel less exciting than software configuration, but it is usually what determines whether automation is trusted.
Data governance should continue after launch. The team needs a regular review of exception reasons, fields that users override, integrations that fail, and records that require manual correction. Those patterns show where training, policy, or system rules need to improve.
Data Quality & Integration Requirements – practical statistics and checkpoints
- At least one owner should be assigned to master data, transaction status, evidence quality, and exception categories.
- A 30-day cleanup window can reveal recurring issues such as duplicate names, missing project codes, stale customer records, and unsupported transactions.
- Data quality should be measured before and after implementation so automation does not simply accelerate bad records.
- Integration should be judged by whether users stop exporting, rekeying, and reconciling the same data manually.
- A monthly data-quality review should track the top 5 exception reasons and the team or process owner responsible for each one.
ROI and Operating Economics
The return on business banking improvement should be measured through operating economics, not only subscription cost. A finance workflow consumes time when staff enter data, search for evidence, chase approvals, answer status questions, correct errors, reconcile differences, and explain variances during close. Those activities are real costs even when they do not appear on a separate invoice.
A useful ROI model starts with volume. How many transactions, invoices, receipts, payments, time entries, approvals, or records move through the workflow each month? Then it measures time per item, exception rate, rework rate, and downstream impact. A small time saving can become meaningful when volume is high and the work repeats every month.
The model should also include avoided cost. A company may not reduce headcount after improving business banking, but it may avoid overtime, reduce temporary help, delay a hire, close faster, reduce audit preparation, or prevent cash leakage. These avoided costs are often more realistic than assuming immediate payroll savings.
Cash impact should be included when the workflow affects billing, collections, reimbursements, supplier payments, or bank visibility. Faster status can support better customer follow-up, fewer missed charges, more accurate payment timing, or earlier awareness of cash gaps. These benefits may matter more to management than the processing cost of any single transaction.
The strongest business case compares the old baseline with the new workflow over time. A 30-day comparison can show adoption problems, a 60-day comparison can show process stabilization, and a 90-day comparison can show whether behavior has actually changed. That timeline prevents teams from declaring success based only on go-live completion.
ROI & Operating Economics – practical statistics and checkpoints
- A practical ROI model should include at least 3 cost groups: labor time, error or rework cost, and cash-flow or control impact.
- A 10-minute reduction on 1,000 monthly transactions equals more than 166 hours of process capacity each month.
- Even a 1 percent improvement in collection timing, reimbursement leakage, missed billing, or avoidable rework can be material when transaction volume is high.
- ROI should compare baseline and post-launch metrics over 30, 60, and 90 days rather than relying on a one-time software business case.
- The most credible ROI evidence combines hard numbers with fewer escalations, cleaner close work, and less manual status chasing.
Future Outlook
The future of business banking is shifting rapidly from historical record-keeping into autonomous operating guidance. Corporate finance and treasury teams are no longer satisfied with lagging, end-of-month statements that only tell them what has already happened. Instead, they demand predictive financial architectures that dynamically surface what capital is trapped, which invoices are late, what counterparties present credit risk, and what treasury actions should execute next.
Artificial intelligence is moving away from basic chatbot frameworks toward agentic enterprise models. These autonomous systems can plan, reason, and orchestrate multi-step financial workflows—such as rebalancing funds across multi-entity accounts to bypass overdraft fees or instantly drawing down pre-approved credit lines to cover a projected cash deficit. However, this transition is assistive rather than fully autonomous. Because financial decisions directly impact capital preservation and compliance, high-performing organizations pair machine intelligence with strict human-in-the-loop governance structures.
The eventual winners will be the organizations that clean their master data and establish hard operational baselines before scaling their systems. By treating business banking as an integrated financial operating network rather than an isolated software purchase, companies can convert market projections into measurable, long-term balance sheet velocity.
Future Outlook: Practical Statistics and Checkpoints
Macro Projections & Institutional Capital Flows
-
The $8.63 Trillion Commercial Footprint: The global commercial banking market is expanding rapidly, climbing from an established baseline to $5,036.9 billion ($5.04 trillion) and projected to reach $8,639.2 billion ($8.64 trillion) by 2030, advancing at a 14.5% CAGR.
-
The $67.74 Billion Financial AI Wave: Reflecting massive back-office automation spending, the global market for AI in banking is projected to jump from $15.32 billion to $20.6 billion, eventually reaching $67.74 billion by 2030 at a blistering 34.5% CAGR.
-
Predictive Treasury Management Expansion: The global market for AI and machine learning-driven predictive cash flow forecasting tools is projected to scale from $2.31 billion to $11.2 billion by 2034, expanding at an 18.9% CAGR.
-
Managed Banking Infrastructure Consolidation: As companies outsource complex back-office systems, the global banking managed services ecosystem is on track to rise from $32.4 billion to $55.1 billion.
-
The $340 Billion Industry Value Injection: Advanced generative AI deployments stand to inject between $200 billion and $340 billion in annual recurring value directly into the global banking sector by optimizing risk modeling and underwriting.
Agentic AI, Predictive Accuracy & Liquidity Mechanics
-
The Execution Pilot Paradox: While 70% of financial institutions are actively exploring autonomous agentic AI to handle complex multi-step workflows, 95% of current generative AI implementations remain stuck in pilot phases rather than scaled production.
-
Slicing Operating Expenses by 30%: Moving past unintegrated pilots to scaled autonomous systems is projected to slash back-office banking operational investments by 20% to 40% while accelerating transaction processing speeds by 40%.
-
95% Cash Forecasting Precision: Integrating machine learning algorithms directly with real-time enterprise resource planning (ERP) systems allows predictive engines to analyze alternative data and map upcoming liquidity gaps with up to 95% forecast accuracy.
-
Cutting Cash Management Overhead: Transitioning away from spreadsheet-based cash trackings to automated predictive analytics drops total corporate cash management operational costs by 15% to 20%.
-
Erasing up to 50% of Forecasting Errors: Algorithmic forecasting models eliminate data blind spots across accounts payable and receivable portfolios, driving a 20% to 50% drop in cash prediction errors compared to static spreadsheets.
-
A 35% Trend Anticipation Premium: Deploying real-time cash trending tools allows treasury teams to achieve a 35% improvement in anticipating when cash inflows and outflows will execute, optimizing short-term inventory and CAPEX planning.
-
The Liquidity Management Directive: Recognizing that static reporting fails to safeguard working capital, 60% of modern corporate finance teams now categorize predictive forecasting tools as an absolute operational necessity.
-
The Mid-Market Growth Anchor: Precision cash prediction is a mandatory requirement for scaling firms; 53% of midsize businesses explicitly declare accurate forecasting critical to maintaining long-term, sustainable growth.
Open Finance, Connected Ecosystems & Regulatory Enforcement
-
The $7 Trillion Embedded Invoicing Reality: Driven by the integration of credit and transaction processing directly into vertical SaaS platforms, embedded finance transaction volumes are projected to exceed $7 trillion, controlling over 10% of total transaction value.
-
The 35% Non-Interest Revenue Pivot: Tech-first “Intelligent Banks” are completely altering their business models, shifting to generate over 35% of their total corporate revenue from non-interest sources, such as native SaaS and Data-as-a-Service (DaaS) fees.
-
The Open Finance API Mandate: Regulatory timelines are forcing rapid data integration across banking channels; frameworks like the US CFPB Section 1033 Final Rule and Europe’s PSD3 mandate secure API access to comprehensive user financial profiles.
-
A 35% Cut to Administrative Friction: On a macroeconomic scale, the European Commission has established strict structural modernization targets to reduce small-business administrative reporting and compliance burdens by 35%.
-
The 7% Global Revenue Non-Compliance Penalty: Highlighting the critical need for transparent systems, high-risk automated credit-scoring and underwriting models must comply with strict auditability guidelines, under threat of fines topping 7% of global annual turnover.
-
Defending Against $40 Billion in Algorithmic Fraud: While 90% of financial operations use AI to protect payment rails, generative-AI-driven fraud losses are projected to skyrocket to $40 billion, making real-time anomaly detection mandatory.
Operational Rollout & Maturity Milestones
-
The 30/60/90 Day Implementation Gate: High-performing deployment teams minimize integration risks by executing a structured, phased rollout rhythm:
-
Day 30 Milestone: Completing full master data and general ledger cleanup to eliminate duplicate record silos.
-
Day 60 Milestone: Completing internal adoption audits across distributed business units to verify platform compliance.
-
Day 90 Milestone: Verifying confirmed business outcome improvements, including compressed cycle times and a visible reduction in outstanding payment lag.
-
-
The 20% Human-in-the-Loop Governance Buffer: To prevent automated data errors or system hallucinations from creating compliance gaps, highly regulated financial environments intentionally maintain a strict 10% to 20% manual human review buffer for all high-risk exception and credit overrides.
Frequently Asked Questions
What is business banking?
Business banking refers to the tools, services, records, and workflows a business uses to manage business banking. In practice, it connects tasks such as business accounts, cash-flow tools, payment collections, lending decisions, card controls, bank feeds, and account servicing so finance teams can reduce manual handling and make decisions with cleaner information.
Why do business banking statistics vary by source?
The numbers vary because sources define the category differently. Some count only software revenue, while others include services, cloud subscriptions, implementation, adjacent payment tools, automation features, or industry-specific platforms. That is why the direction of growth and the operating benchmarks are usually more useful than a single market total.
Which business banking metric matters most?
There is no single best metric for every company. A practical scorecard should include cash position, payment timing, bank-feed reliability, account service response, lending readiness, and payment-method mix. The most important metric is the one connected to the workflow constraint that creates the most delay, risk, or cash impact.
How can small businesses use these statistics?
Small businesses can use the statistics to compare their own workflow with broader patterns. They do not need enterprise complexity, but they do need clean status, reliable records, fewer missed steps, and less owner time spent on routine finance admin.
How should a company measure ROI from business banking improvements?
ROI should begin with the current baseline: volume, time spent, backlog, exception rate, errors, rework, cash impact, and audit workload. The most credible ROI model uses the company’s own workflow data instead of relying only on generic industry averages.
What is the biggest implementation mistake?
The biggest mistake is buying a tool before defining the workflow. Teams should map the process, clean key data, assign ownership, define exceptions, and decide which outcomes they want to improve before configuring software or services.
How often should the scorecard be reviewed?
Operational metrics should be reviewed frequently enough to change behavior. Weekly reviews work well for aging, backlog, and exception queues, while monthly reviews are useful for trends, controls, close quality, and process improvement planning.
Where should a team start first?
The best starting point is the workflow with repeated follow-up or visible risk. For business banking, that might be business accounts, cash-flow tools, payment collections, lending decisions, card controls, bank feeds, and account servicing. A narrow start with clear metrics usually works better than trying to automate every process at once.
Final Takeaway
Business Banking Statistics shows a finance category where market demand and operating pressure are moving in the same direction. Public forecasts point to continued growth, but the more useful lesson is inside the workflow: businesses want fewer manual touches, cleaner records, faster status visibility, stronger controls, and better cash-flow confidence.
The best business banking programs do not chase software for its own sake. They start with the process that slows finance down, measure the baseline, improve the workflow, and then use automation, services, or analytics to make the result repeatable. That is why the strongest statistics are not only market totals; they are the operating numbers that show whether finance work is becoming easier to manage, easier to audit, and easier to use in business decisions.


