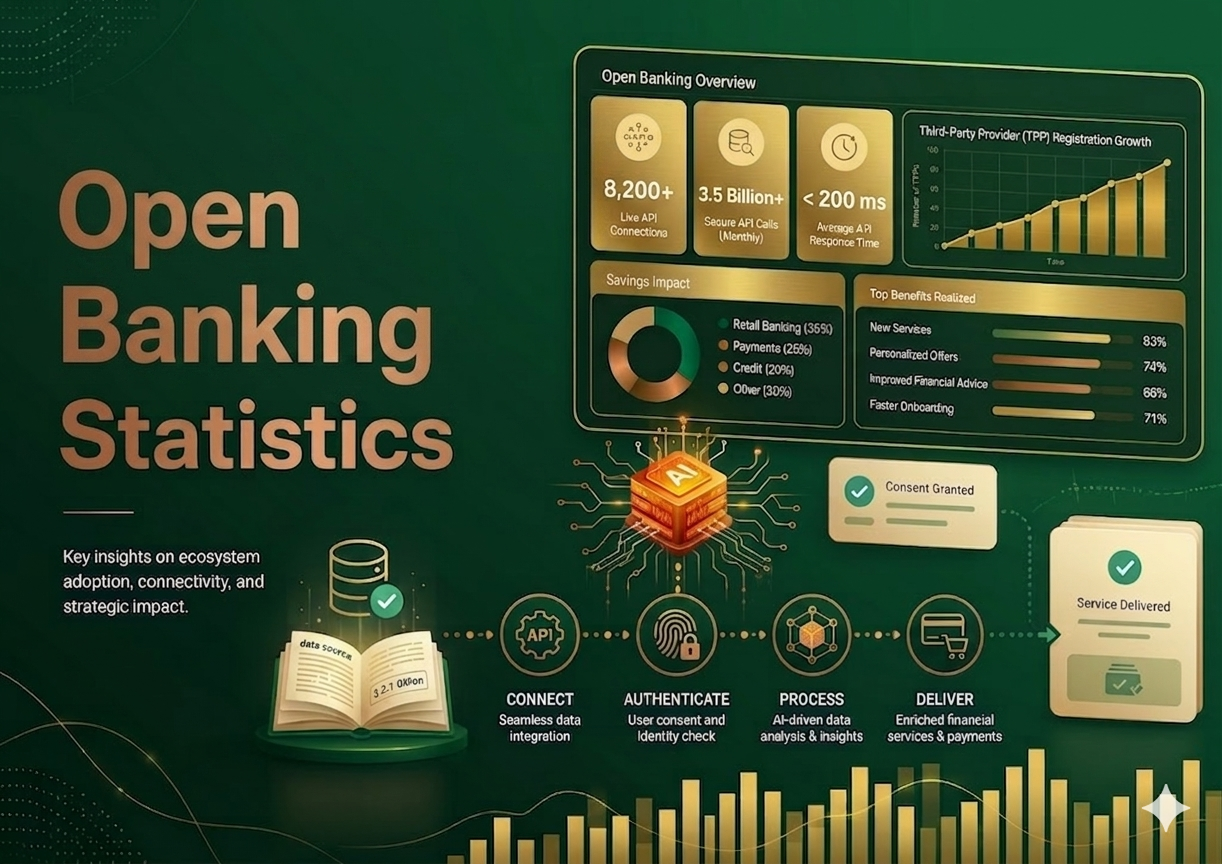
Open banking allows customers and businesses to share financial data securely with authorized third parties through APIs. The model changes how lenders assess risk, how payment providers initiate transfers, how accounting tools connect to bank accounts, and how consumers manage money across apps. The statistics around open banking are useful because they separate market enthusiasm from operating reality. A category can grow quickly in revenue while many companies are still managing the underlying work through spreadsheets, email, manual approvals, and fragmented systems. The gap between market forecasts and day-to-day maturity is where the most useful business insight usually sits.
This report looks at open banking through a practical finance and operations lens. Market-size estimates show how much capital, vendor activity, and customer demand are moving into the category. Adoption metrics show whether teams are changing their real workflows. Operating benchmarks show whether the tools are improving speed, accuracy, visibility, compliance, and cash outcomes rather than simply adding another software layer.
The numbers should be read with care because publishers define these markets differently. Some estimates include only software revenue. Others include services, implementation, transaction volume, platform fees, financing balances, or related workflow categories. That is why directional movement, segment differences, and operational interpretation matter more than treating any single dollar estimate as final. The strongest use of these statistics is to understand what businesses are actually trying to fix and which measurements prove progress.
Headline Statistics and Benchmarks
-
Global Connectivity surge: Global open banking API calls are projected to grow 427%, rising from 137 billion in 2025 to over 722 billion by 2029. This growth is increasingly driven by the commercialization of APIs beyond basic compliance mandates.
-
UK Infrastructure Maturity: In 2025, the UK ecosystem recorded 24.0 billion successful API calls, a 27% year-over-year increase. Monthly volumes now consistently exceed 2 billion calls, signaling that open banking has moved from a “fintech experiment” to a critical piece of national financial infrastructure.
-
Regional Adoption Chasm: While Europe and the UK dominated the global market with a combined 41.6% revenue share in 2025, the United States is rapidly catching up via market-led adoption, with 52% of U.S. adults now using at least one open banking-enabled service for budgeting, lending, or payments.
-
The Payment Initiation (PIS) Breakout: While Account Information Services (AIS) still hold a 52.8% market share, Payment Initiation grew at 53% in 2025—more than double the growth rate of data-sharing alone. Total UK open banking payments reached 351 million transactions, a 57% surge fueled by a 98% increase in Variable Recurring Payments (VRP).
-
Operational Performance Standards: The “benchmark of excellence” for 2026 is a 99.50% API availability rate with an average response time of 324ms. Top-tier providers (like Plaid) have reached 90%+ conversion rates for returning users by implementing “one-click” bank payments that reduce checkout friction.
-
Risk and Underwriting Impact: Digital lenders using open banking data have seen a 43% reduction in loan approval times and a 9-percentage-point increase in approval rates by replacing self-reported income with real-time cash-flow analytics.
-
The Cost of Inaction: Manual reconciliation processes still carry a 3% to 5% error rate, but businesses integrating open banking directly into ERP systems (like Xero or NetSuite) report a 95% reduction in reconciliation errors and a 85% faster month-end close.
-
Fintech Saturation: Open banking is no longer optional for new entrants; 95% of fintech startups launched since 2024 were built with at least one core open banking API integration, moving the industry toward a “connected-by-default” operating model.
How to Read These Statistics Correctly
The first step in reading open banking statistics is separating market revenue from workflow performance. Market revenue shows how much businesses and platforms are spending. Workflow performance shows whether users are saving time, reducing errors, accelerating cash, or improving compliance. A market can be growing because vendors are selling more seats or processing more transactions even if the average buyer is still early in operational maturity.
A second distinction is between adoption and maturity. A company may count as an adopter after adding a digital intake form, connecting an API, or deploying a basic workflow. That does not mean the process is fully automated, governed, or optimized. Mature adoption usually means the team has clear rules, good data quality, exception handling, audit trails, and management metrics that are reviewed regularly.
A third distinction is between volume and value. Higher volumes are helpful for proving that a system is being used, but value comes from the quality of outcomes. A workflow that handles thousands of transactions but still requires manual correction may be less valuable than a smaller workflow with high accuracy and strong controls. The best statistics combine volume, cycle time, cost, accuracy, and risk indicators.
Market Size and Growth Outlook
The market outlook for open banking points to sustained demand, but the reason for growth differs by segment. Buyers are not only purchasing software because dashboards look modern. They are looking for faster decisions, cleaner records, better visibility, fewer manual handoffs, and more predictable outcomes. When a tool touches cash, credit, invoices, documents, or operational approvals, the market opportunity expands beyond simple productivity into financial control.
The published estimates in this category vary because the boundary of the market is not always fixed. A narrow definition might include only subscription software. A wider definition might include transaction fees, services, financing volume, implementation, managed operations, or related platform revenue. This makes it risky to compare two forecasts without understanding methodology. It is more useful to compare the direction of growth, the segments getting funded, and the operational problems that buyers repeatedly mention.
Growth also reflects changes in buyer expectations. Finance and operations teams increasingly expect tools to connect with accounting systems, payment rails, customer records, supplier information, documents, and reporting dashboards. Standalone tools can still be useful, but the strongest business cases usually appear when the workflow connects upstream and downstream data. That connection is what turns a narrow tool into part of a larger operating platform.
For smaller businesses, the market trend matters because cloud delivery and embedded workflows reduce the need for enterprise-grade implementation. For larger organizations, the same trend matters because fragmented workflows create control gaps at scale. In both cases, the investment case depends on whether the solution can reduce repeated work while improving the quality of decisions.
Market and adoption statistics to know
- Juniper Research projected open banking API calls globally to increase 427 percent from 137 billion in 2025 to more than 720 billion by 2029.
- Open Banking Limited reported that the UK ecosystem recorded 24.0 billion successful API calls in 2025, up 27 percent from 2024.
- Open banking research shows banks adopting external APIs tend to be larger and more technologically mature.
- Regulatory progress varies by region, with Europe and the UK generally further along than the United States.
- Primary workflow categories include account information services, payment initiation, cash-flow underwriting, personal finance management, each requiring different controls and success metrics.
- The most useful management dashboard should combine API success rate, consent conversion, active connections, and payment-initiation volume rather than relying on a single adoption number.
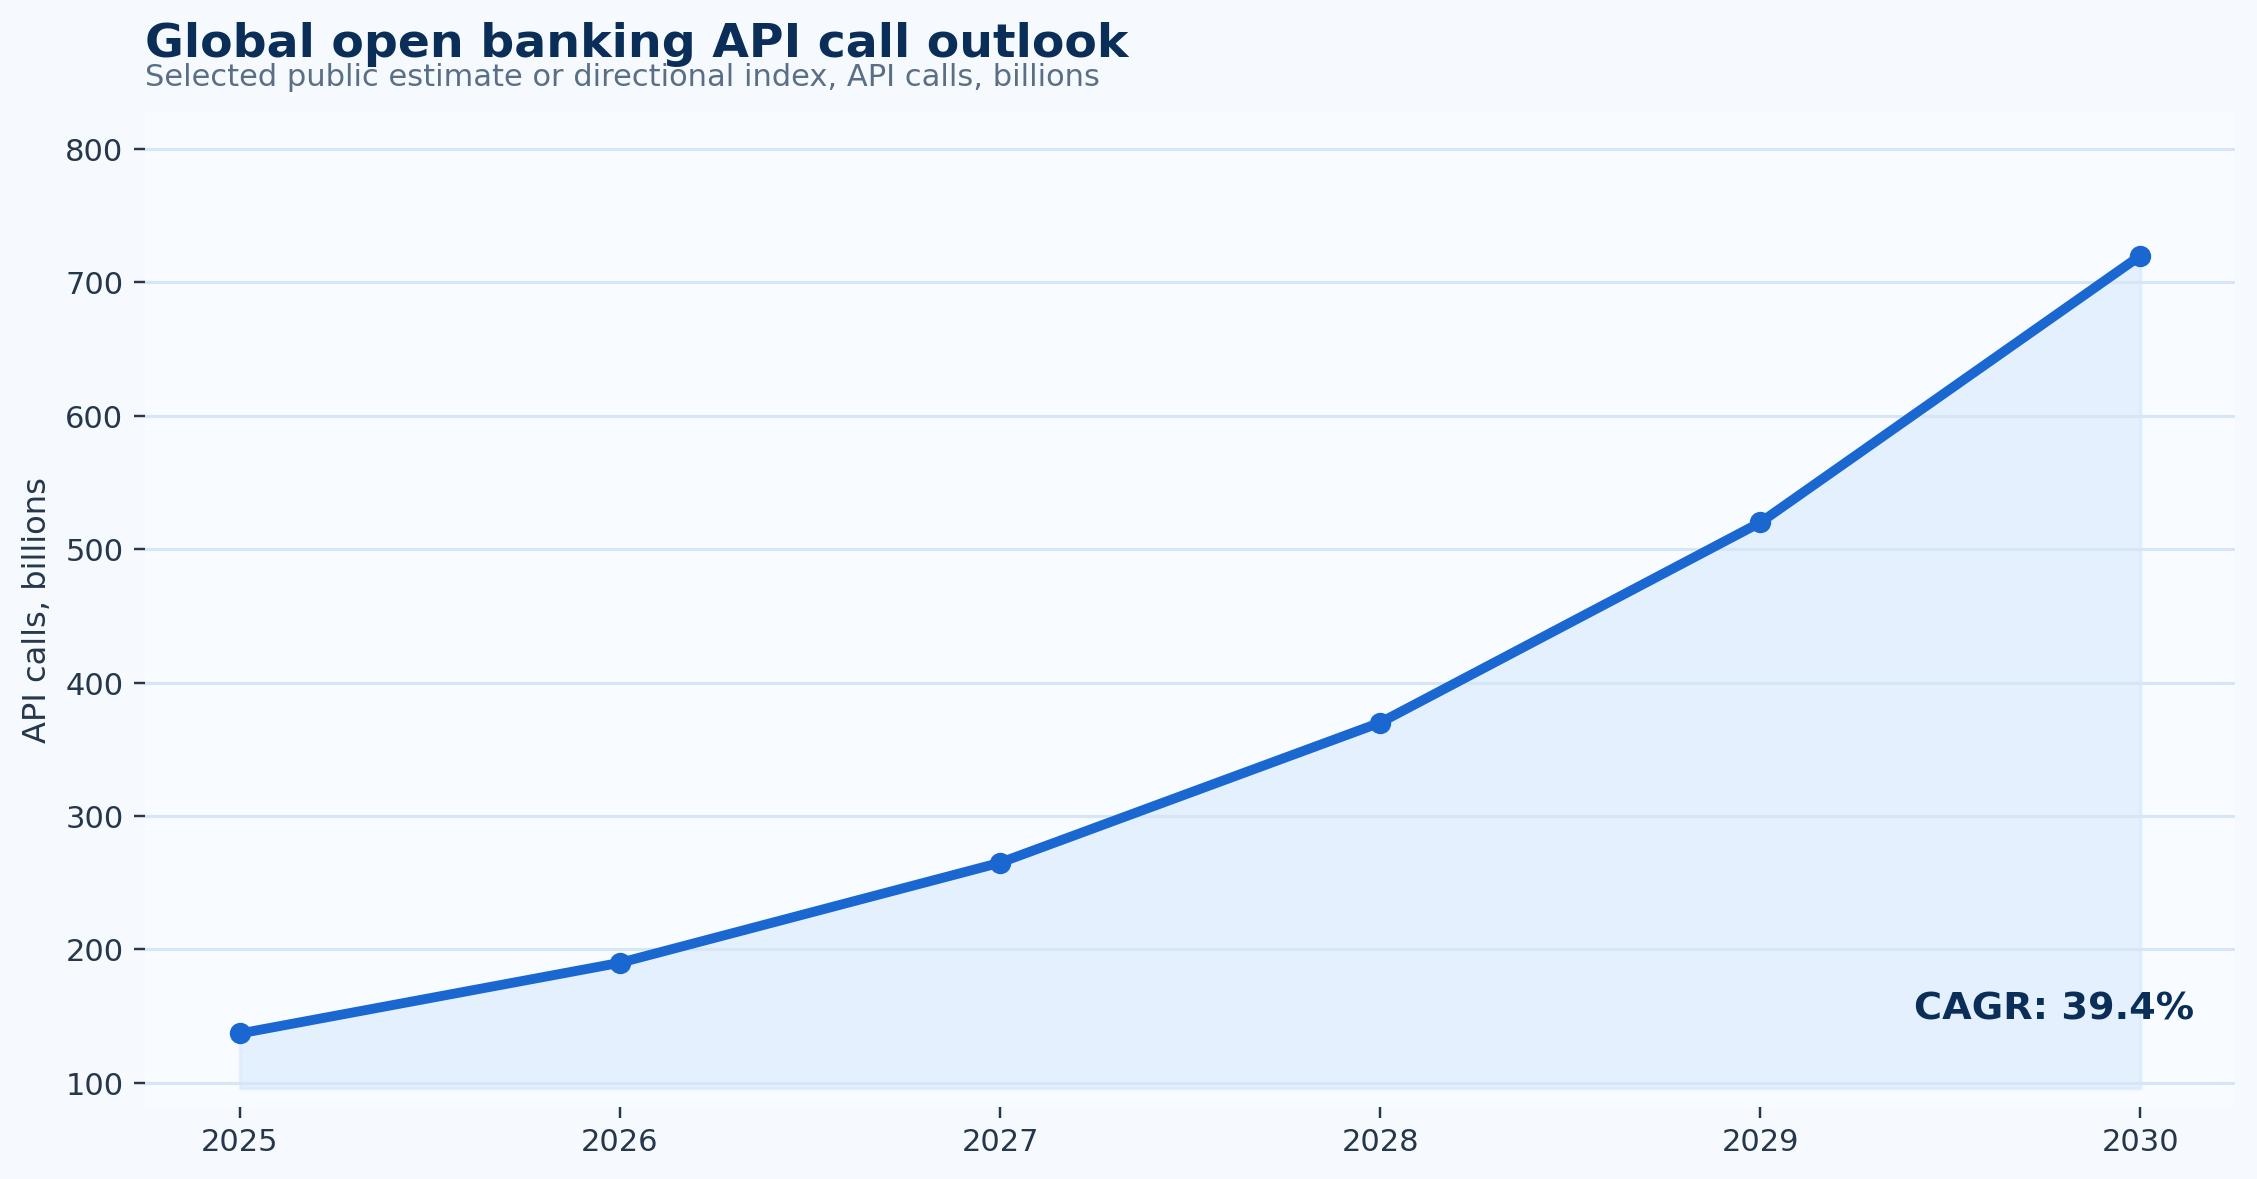
Figure 1. Global open banking API call outlook shows the direction of category growth and should be interpreted as a market signal rather than a single operating benchmark.
Why the Workflow Matters Operationally
The operational case for open banking begins with work that repeats often enough to create measurable friction. Repetition does not always look dramatic. It can be a manager checking the same spreadsheet every morning, a finance clerk re-entering data, a sales team rebuilding similar estimates, or a lender requesting the same documents from every applicant. Each touch may be small, but the combined workload becomes material when volume grows.
Technology only helps when the workflow is clear. If approval rules are inconsistent, source data is incomplete, or teams disagree about ownership, software can make the confusion faster but not necessarily better. Strong programs usually define the intake channel, required data fields, routing logic, exception categories, approval thresholds, and reporting cadence before scaling automation. That process discipline is often the difference between a successful deployment and a stalled project.
The most useful operational statistics are the ones that point to a decision. A cycle-time metric should tell leaders where work is waiting. An error metric should show whether the problem comes from data capture, policy gaps, missing information, or user behavior. A cost metric should identify whether savings come from fewer touches, less rework, faster approval, better cash timing, or reduced risk exposure.
In practice, teams should treat open banking as a workflow redesign project rather than a single technology purchase. The system should make common work easier, route unusual work to the right person, and generate enough data for leaders to see whether the process is improving. When those three outcomes are present, the statistics become management tools rather than marketing claims.
Operational statistics and signals
- A baseline should capture current volume, current cycle time, and the amount of manual work involved before the first workflow change is made.
- Teams should separate normal-path work from exceptions because the exception queue usually explains why averages do not improve as expected.
- A practical pilot should start with a high-volume and relatively repeatable workflow before expanding into unusual or high-risk cases.
- The best evidence of progress is an improvement in API success rate, active connections, and data-refresh frequency without creating weaker controls.
- Workflow visibility is often valuable even before full automation because it reveals where work waits and who needs to act next.
Adoption Maturity and Segment Differences
Segment differences matter because open banking rarely delivers value the same way for every buyer. Smaller companies often care about simplicity, speed, cost, and avoiding administrative overload. Mid-market companies usually care about standardization across teams, locations, or customer groups. Enterprise buyers focus more heavily on integration, controls, reporting, auditability, security, and governance.
Industry differences are just as important. In fintech apps and digital lenders, the workflow may be tied to high transaction volume and customer experience. In accounting platforms and payment providers, the same category may be more closely tied to operational accuracy, project control, compliance, or working-capital visibility. This is why a generic adoption percentage can be misleading without context.
The business model also changes the metric set. A company with recurring revenue may measure retention, renewals, and payment reliability. A project-based company may focus on margin protection, estimate accuracy, milestone billing, and revenue recognition. A finance-heavy buyer may focus on cash timing, credit risk, audit trails, and compliance. Useful reporting should reflect the way the business actually makes money and manages risk.
The practical takeaway is that leaders should benchmark against similar workflows rather than only similar company sizes. A small company with complex transactions may need stronger controls than a larger company with simpler repeatable work. A high-growth firm may value speed more than cost reduction. A regulated firm may value documentation and auditability even when the direct labor savings look modest.
Segment statistics and interpretation points
- Small businesses usually prioritize fast setup, simple workflows, and direct savings because administrative capacity is limited.
- Mid-market teams often need stronger standardization across departments, locations, customer groups, or business units.
- Enterprise buyers usually require audit logs, permissions, reporting, data governance, and deeper integration with existing systems.
- Industry use cases differ: fintech apps and digital lenders may focus on volume, while accounting platforms and payment providers may focus on accuracy or control.
- The right benchmark should compare workflows that share similar volume, complexity, and risk rather than only comparing companies of similar size.
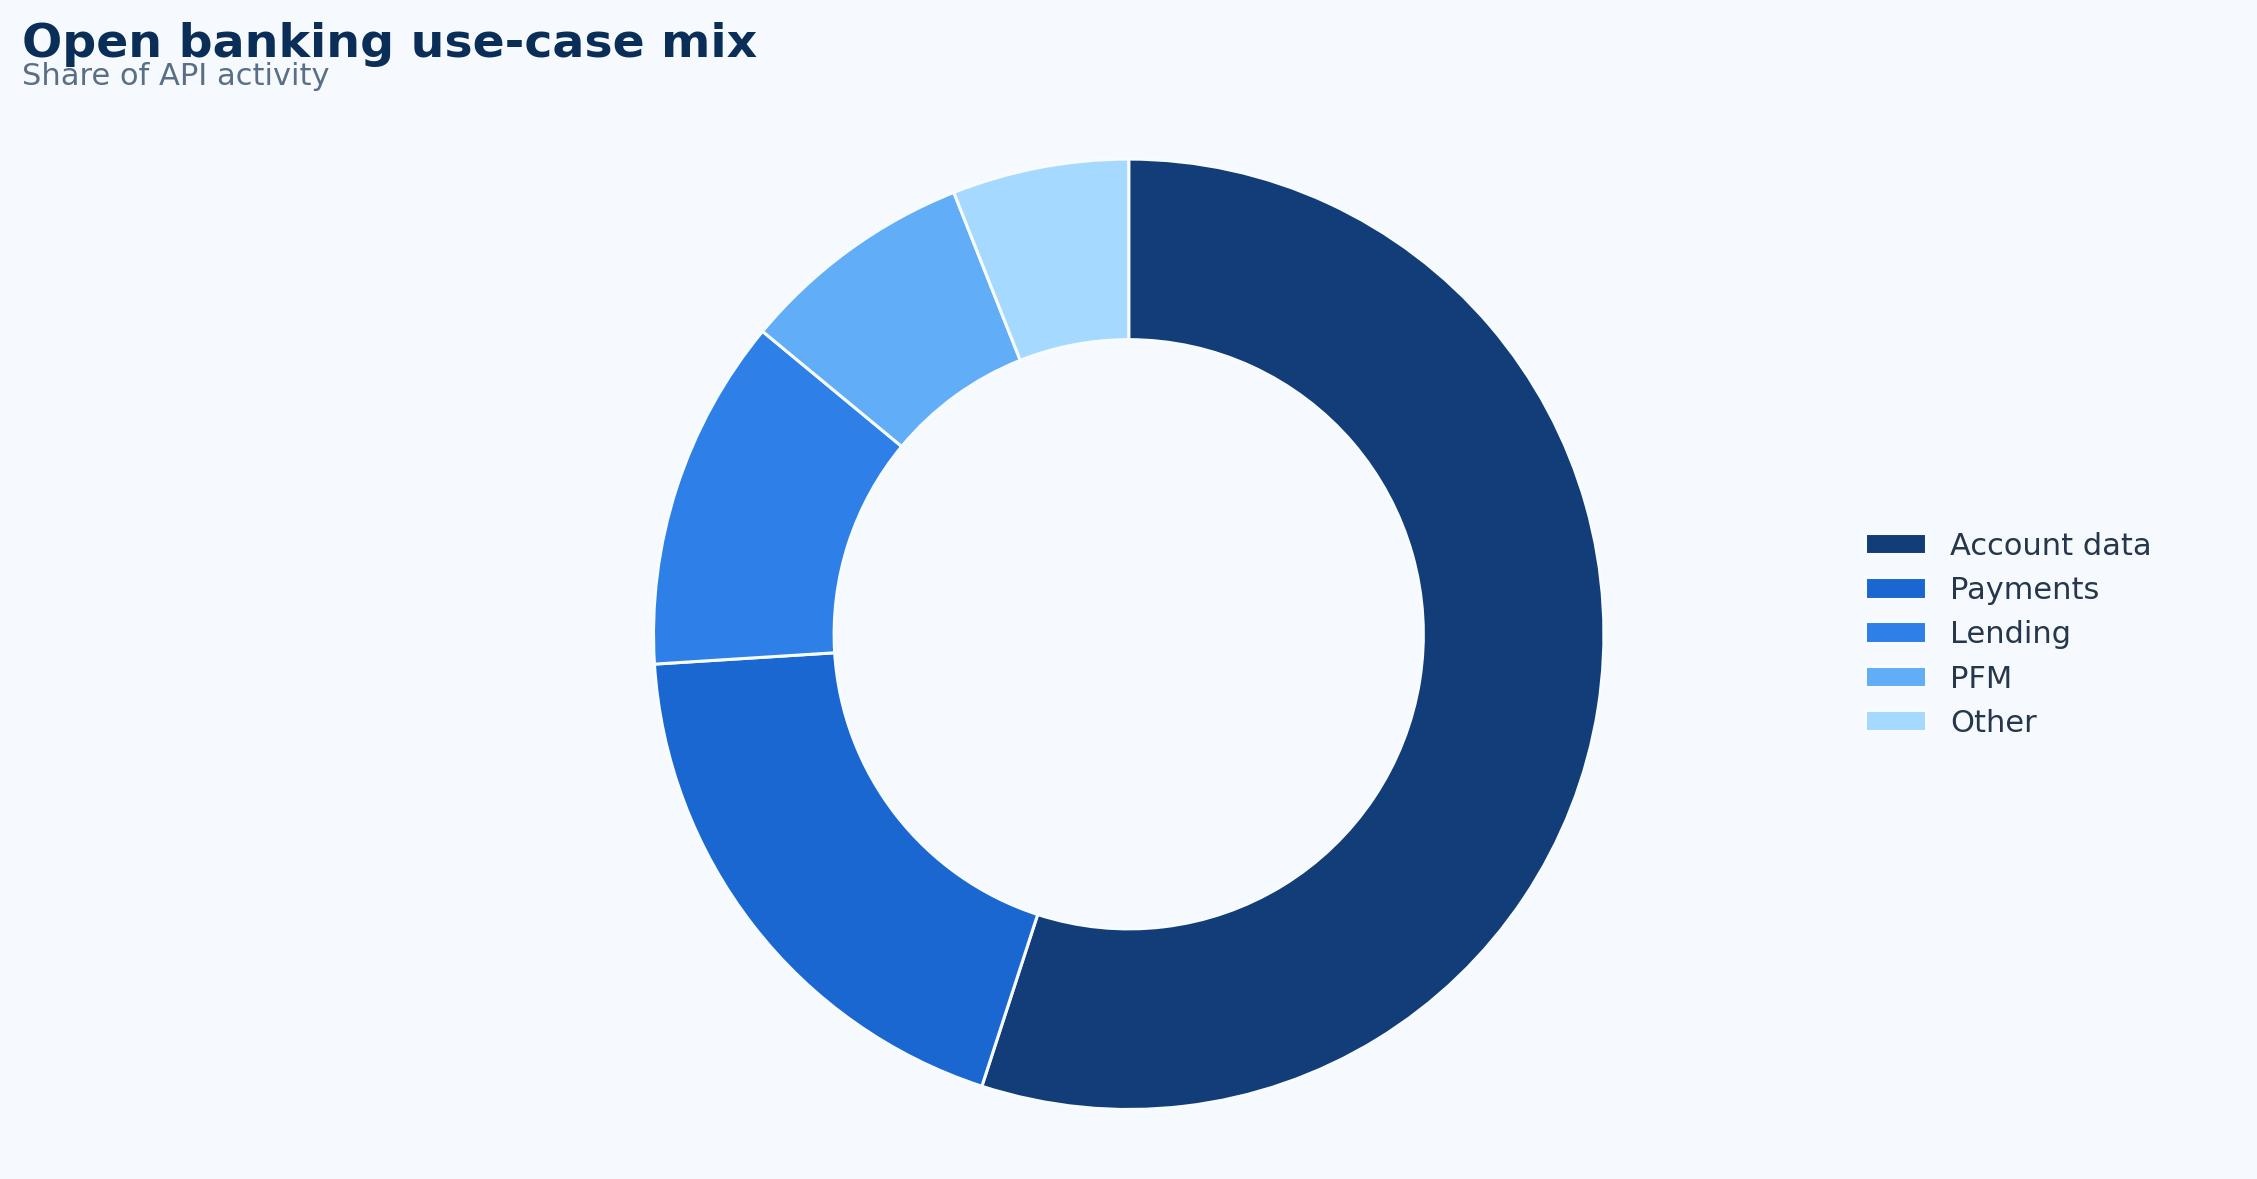
Figure 2. Open banking use-case mix gives a practical segment view of where activity is concentrated across the category.
Technology, AI, and Integration Trends
Technology in this category is moving toward connected data rather than isolated task automation. The most valuable systems pull information from source documents, customer records, bank feeds, payment rails, accounting platforms, workflow tools, and user actions. They then use that data to route work, surface exceptions, calculate risk, and update dashboards without forcing teams to rebuild the same dataset manually.
AI and machine learning are becoming more common, but their role should be understood carefully. In most business workflows, AI is most useful when it helps classify data, detect patterns, recommend next actions, flag anomalies, and reduce repetitive review. It should not remove accountability from financial, credit, compliance, or customer-facing decisions. The strongest deployments combine automation with clear human review points.
Integration is often the limiting factor. A tool that works well by itself may create extra effort if data must still be copied into accounting, CRM, ERP, document storage, payment, or reporting systems. Integration quality affects adoption because users quickly reject workflows that make the first step easier but create reconciliation work later. A strong integration plan should include data ownership, field mapping, exception handling, and backup procedures.
Security and governance are also part of the technology story. The more a system touches payments, customer data, financial records, documents, or approvals, the more important permissions, audit logs, retention rules, encryption, and access controls become. Buyers should ask not only what the system automates, but how it proves what happened after the work is complete.
Technology and Integration Statistics to Watch
-
AI Utility & Adoption: While 78% of banks are currently deploying AI at scale, the focus has shifted from “pilots” to front-line revenue. Specifically, 91% of U.S. banks now use AI-powered big data systems for fraud detection, which are capable of identifying 95% of high-risk transactions before losses occur. This shift is critical as 35% of customers now cite “lack of personalized services” as a primary reason for switching banks.
-
Integration Scalability: The surge to 722 billion annual API calls by 2029 is being led by the UK, which hit a landmark 2 billion calls in a single month in mid-2025. This volume is increasingly commerce-driven; Variable Recurring Payments (VRPs) now account for 13% of all UK open banking transactions, highlighting a shift from simple data-sharing to complex, automated cash-flow management.
-
The Data Quality Dividend: Manual reconciliation is no longer just “slow”; it is a major compliance risk. Standard manual processes carry a 3% base error rate, but AI-driven automation slashes this to just 0.4%—a 93% reduction in errors. Furthermore, automated systems increase compliance match rates from 92.1% to 99.2%, nearly eliminating the need for manual audit interventions.
-
Permission & Security Risk: The cost of “bad data” is quantified at approximately 12% of annual revenue for the average financial firm. In a high-velocity environment where the UK alone processes nearly 30 million open banking payments per month, secure permissioning is the only barrier against “silent data decay,” which currently causes B2B firms to target the wrong decision-makers 86% of the time.
-
Transparency & Review Efficiency: Agentic AI is moving beyond chatbots to autonomous “case handlers.” Banks currently dedicate 10–15% of their total staff to KYC (Know Your Customer) and AML (Anti-Money Laundering) tasks; however, agentic systems are delivering 200% to 2,000% productivity gains by allowing a single human practitioner to supervise 20+ AI agents simultaneously.
Pro Tip: When tracking these stats, look at the “Zero-Touch” rate—the percentage of transactions that move from initiation to reconciliation without a single human click. This is becoming the ultimate benchmark for open banking maturity in 2026.
ROI, Cost Savings, and Business Impact
The ROI case for open banking should not rely on a single headline saving. A narrow model might count only hours saved. A stronger model also includes lower error correction, faster cycle time, reduced exception queues, fewer customer or supplier inquiries, better cash timing, avoided hiring, fewer compliance issues, and stronger management visibility. These benefits appear in different parts of the organization, so the business case needs to look beyond the immediate user team.
A useful ROI model starts with baseline metrics. Leaders should measure the current volume, manual touch count, average processing time, exception rate, approval delay, error rate, and downstream rework before implementation. Without a baseline, the team may still feel improvement but struggle to prove it. The baseline also helps prioritize which workflow should be automated first.
Hard savings and soft savings should be separated but not treated as unrelated. Hard savings may include fewer manual hours, lower processing cost, reduced outside service spend, or avoided penalties. Soft savings may include better customer experience, stronger employee morale, improved control, and faster access to information. In many operational systems, the strongest value comes from the combination rather than one category alone.
The payback period depends on complexity. A lightweight workflow for a small business, such as a basic receipt and invoice system, may deliver value quickly because the setup is simple and requires minimal effort. A larger deployment may require process redesign, system integration, data cleanup, training, and governance work. That does not weaken the business case; it means leaders should set expectations around phased rollout, measurable milestones, and operating ownership after launch.
ROI Statistics and Calculations
- Hard Cost Savings (Fees): Merchants can reduce transaction costs by up to 80% by switching from traditional card rails to open banking (Account-to-Account) payments. In 2025 alone, U.S. banks collected nearly $66 billion in interchange “swipe” fees; capturing even a fraction of this via open banking represents a multi-million dollar saving for large-scale enterprises.
- Labor & Operational Efficiency: Manual payment chasing and reconciliation cost small-to-midsize businesses (SMBs) an average of 6–12 working days per year. Implementing automated open banking workflows can reduce these labor hours by 85%, freeing up staff for higher-value financial analysis.
- Conversion & API Success Rates: Every 100ms improvement in API response time is linked to a 1% increase in checkout conversion. With the 2025 UK industry average response time now reaching 324ms and top-tier providers hitting under 300ms, optimizing for a 10% higher API success rate (moving from 90% to 99%) can directly reclaim $100,000 in monthly revenue for every $1M in transaction volume.
- Working Capital & “Float” Impact: A 3-day delay in invoice payment drains roughly $175,800 from working capital for every $15.3 million in annual turnover. Open banking facilitates “Instant Payments,” which eliminate this float and can save high-turnover businesses over $12,000 annually in interest costs alone at standard 10% financing rates.
- Risk Mitigation & Payback: Open banking data sharing increases loan approval rates by up to 9 percentage points and reduces borrowing costs (interest rates) by as much as 2%. For most enterprises, the “payback period” for an open banking implementation is achieved within 6–14 months, primarily driven by the reduction in failed payment repair costs, which can average $25–$50 per exception.
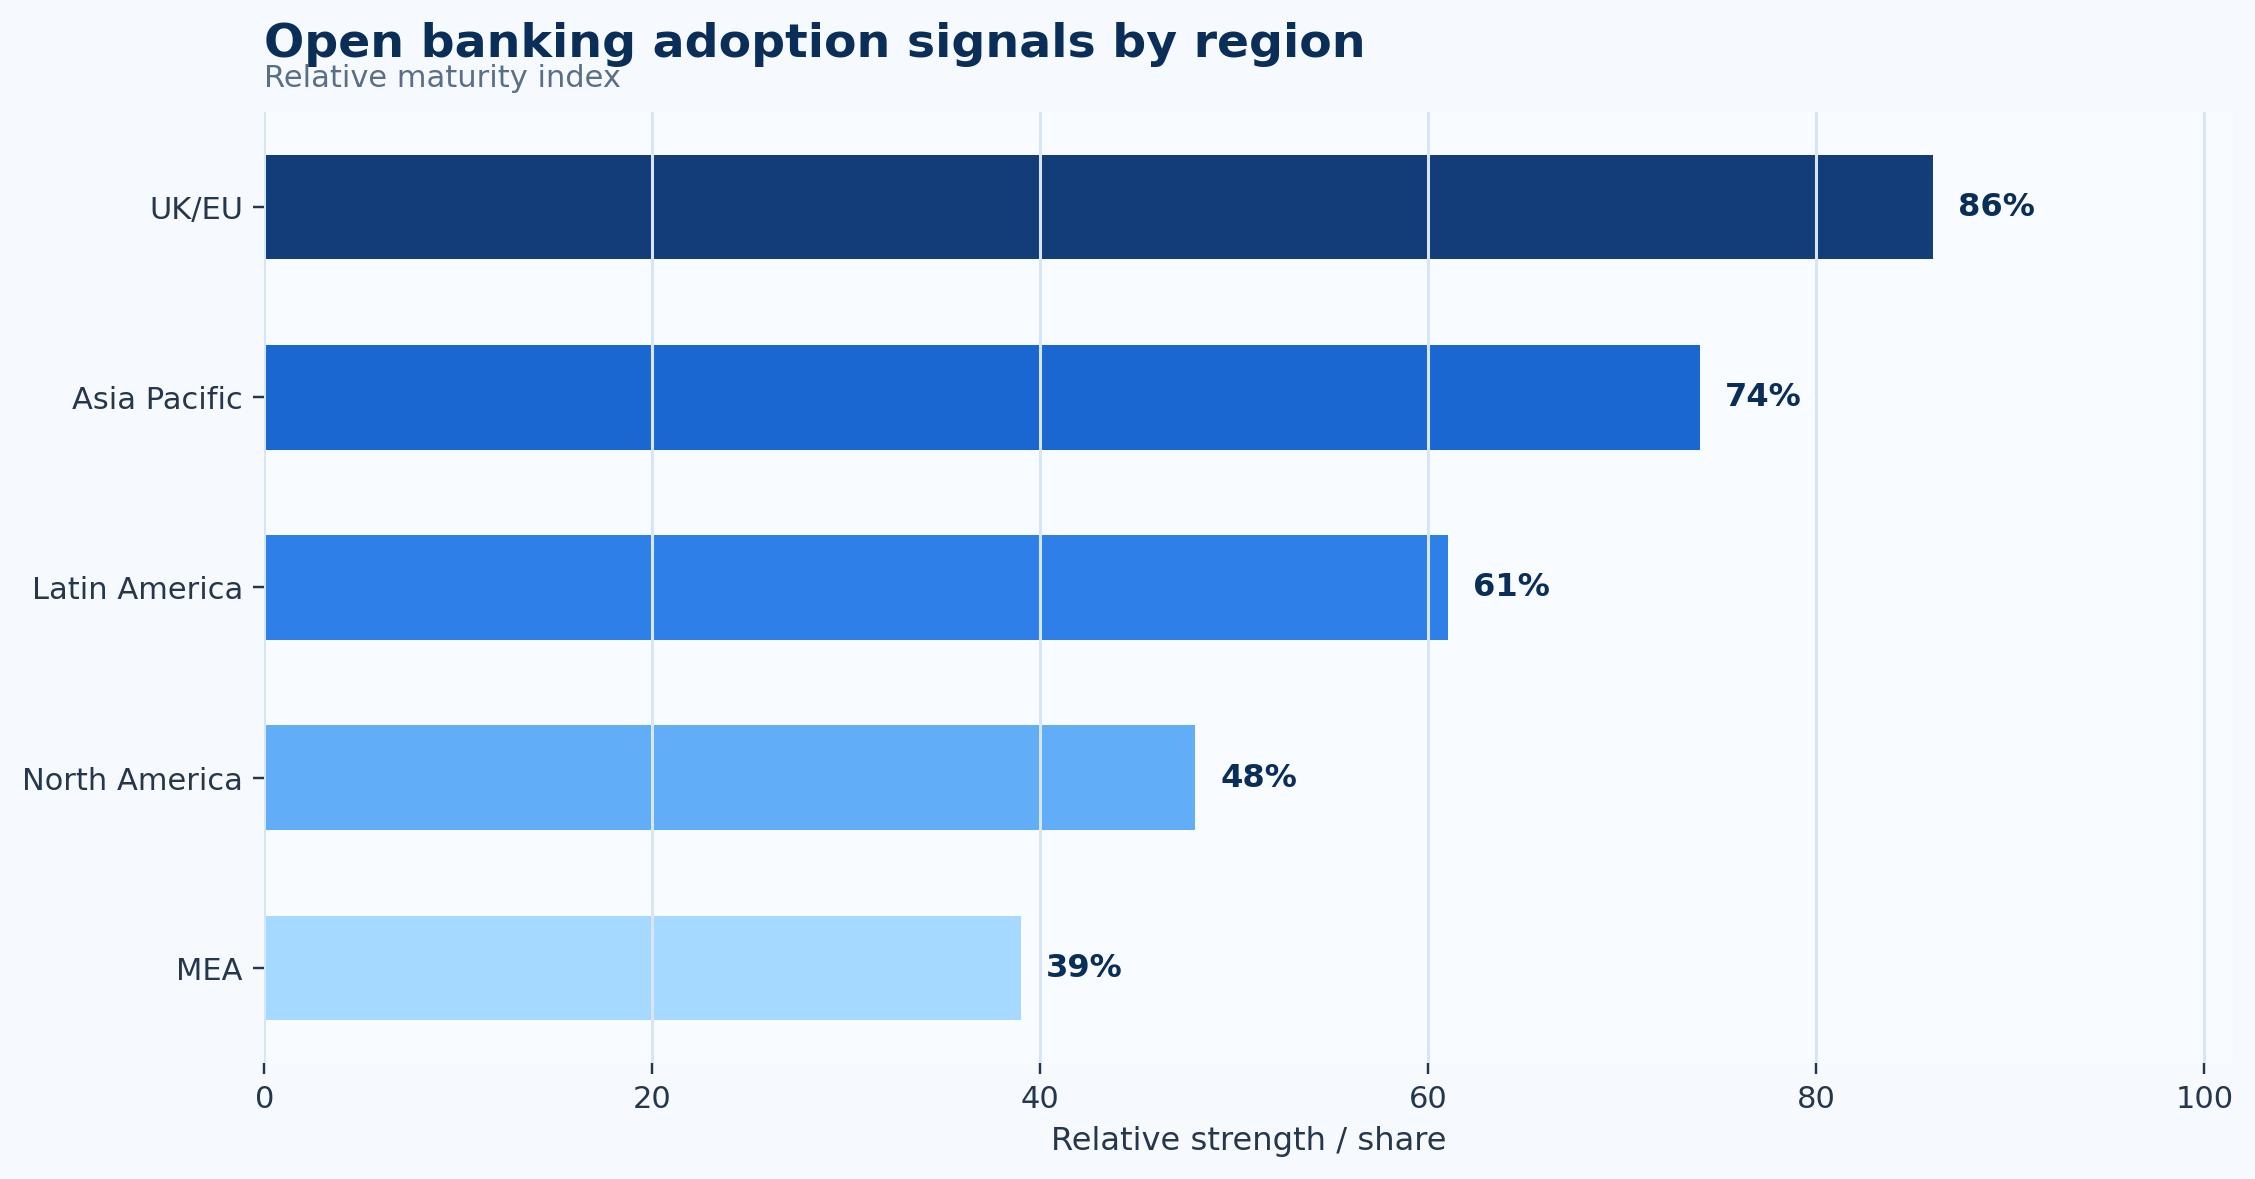
Figure 3. Open banking adoption signals by region highlights the business reasons that commonly move the category from experimentation to budgeted adoption.
Controls, Risk, and Governance
The main implementation risk is automating a weak process before fixing the process design. If data is inconsistent, approvals are unclear, or accountability is spread across too many teams, automation may simply move the bottleneck to another place. A well-designed project should identify where decisions are made, what information is required, how exceptions are escalated, and who owns final outcomes.
A second risk is over-automation. Not every transaction, document, application, estimate, or approval should move without review. High-value, unusual, first-time, disputed, regulated, or risky items often need stronger human oversight. The goal is not to remove judgment; it is to reserve judgment for the cases where it matters most.
A third risk is poor measurement after rollout. Many teams measure go-live completion but not operating performance. A system can be technically live while users still route work around it through email, spreadsheets, messaging apps, or offline approvals. Post-launch measurement should track adoption, exceptions, cycle time, accuracy, and user behavior to confirm that the workflow is truly changing.
Governance should also evolve as the workflow matures. Early rules may work for a pilot but break when more teams, regions, products, or transaction types are added. Leaders should review thresholds, permissions, integration logs, exception reasons, and metric definitions periodically. This keeps automation aligned with how the business actually operates.
Risk and control metrics
- High-risk items should keep human review even when low-risk items move through a mostly automated workflow.
- Audit trails should record who changed the data, who approved the action, when it happened, and what rule or evidence supported the decision.
- Exception categories should be tracked over time because they often reveal recurring data, policy, training, or integration problems.
- Governance should include role-based permissions, approval thresholds, review queues, and periodic audits of unusual activity.
- A mature process treats automation as controlled speed, not speed at the expense of accountability.
Metrics Leaders Should Track
The best scorecard for open banking should include both activity and outcome metrics. Activity metrics show whether the workflow is being used. Outcome metrics show whether the workflow is producing better results. For example, adoption rate and transaction volume matter, but they should be paired with cycle time, accuracy, cost, conversion, funding, or cash-flow outcomes depending on the topic.
Leaders should track API success rate, consent conversion, active connections, and payment-initiation volume as early operating indicators. These metrics usually reveal whether the process is faster and more visible. They should then add data-refresh frequency, error rate, third-party provider count, and account coverage to understand quality, risk, and business impact.
The scorecard should also separate averages from exceptions. Average performance can look healthy while a small share of cases create most of the risk or rework. Exception aging, rejected items, manual overrides, late approvals, or high-risk transactions often reveal more about workflow health than a single average number.
Finally, the scorecard needs ownership. A dashboard without an owner becomes background noise. Each metric should have a person or team responsible for investigating movement, explaining variance, and deciding what changes next. This turns statistics into management action.
Scorecard Statistics to Track
-
API Success Rate & Uptime: In 2025, the “gold standard” for top-tier banking APIs is 99.95% uptime with response times under 300ms. Leaders should watch for “silent failures” where success drops below 98%, as a 1% decrease in API reliability typically triggers a 5–10% surge in customer support tickets and manual intervention requests.
-
Consent Conversion Funnel: Top-performing implementations achieve a 75% consent conversion rate. If your rate is below the 60% industry floor, it usually indicates “trust friction”—significant given that 40% of users now prefer “invisible” embedded finance (like “Pay by Bank” at checkout) over traditional manual redirects.
-
Adoption & Transaction Velocity: Global open banking users are projected to hit 132 million by late 2024 and exceed 200 million by 2026. Tracking “Payment Initiation” is now more critical than data-sharing alone, as it is the fastest-growing segment, with transaction values expected to jump from $57 billion in 2023 to over $330 billion by 2027.
-
Data Accuracy & Error Costs: The financial “tax” on poor data is high: the average cost to repair a single failed or misrouted transaction is between $25 and $50. By contrast, businesses using automated open banking feeds report an 85% reduction in manual reconciliation time, saving an average of 6–12 labor days per year.
-
Ecosystem Maturity (TPPs & Coverage): While Europe holds a 36% global market share, the real metric for leaders is “Value-Added Service” (VAS) migration. In 2026, revenue from simple connectivity has commoditized; 54% of market value now comes from premium services like real-time fraud scoring and identity verification, rather than raw data access.
NOTE: When evaluating these metrics, remember that a “high average” can mask localized failures. A system with 99% uptime can still be a failure if that 1% downtime consistently occurs during your peak Friday afternoon transaction window.
Implementation Priorities
Implementation should begin with a narrow but meaningful use case. Teams often get better results by automating a repeatable workflow with clear rules than by trying to redesign every process at once. The first use case should be large enough to measure, simple enough to stabilize, and important enough for leadership to care about the results.
Data preparation is usually more important than expected. The team should review field definitions, source systems, duplicate records, approval rules, customer or supplier records, historical exceptions, and reporting requirements before rollout. This work can feel slower than software configuration, but it prevents avoidable problems later.
Training should focus on new responsibilities, not only new screens. Users need to understand what the system will do automatically, what they must still review, how to handle exceptions, and which metrics will be used after launch. This reduces resistance because people can see how the workflow will change their daily work.
After launch, leaders should hold a short operating review every month. The review should cover adoption, exceptions, cycle time, errors, user feedback, integration issues, and metric movement. This turns the system into a continuous improvement tool rather than a one-time deployment.
Outlook Statistics and Watch Points
-
Market Expansion & Connectivity: The global open banking market is projected to grow from $38.7 billion in 2025 to $115.8 billion by 2030, a steady 24.4% CAGR. The true driver is the shift from “compliance” to “commerce,” where 90% of mid-market firms now view open banking integration as a competitive necessity rather than an innovation.
-
The “Embedded Finance” Standard: By the end of 2026, embedded finance transaction value in the U.S. alone is expected to reach $7 trillion. This represents a massive migration toward “connected workflows”—where payments and data sharing are baked directly into ERP and CRM systems—reducing manual data entry by an average of 70% to 80%.
-
Agentic AI & Autonomous Finance: 2026 is the breakout year for “Agentic AI” in finance, with 64% of global organizations planning to invest in autonomous agents for procurement and supplier management. These systems move beyond simple rules to handle complex routing and fraud checks, contributing to a projected $143.6 billion AI-in-banking market by 2030.
-
Variable Recurring Payments (VRP) Growth: Recurring payment automation is a key “watch point,” with the market expected to hit $199.4 billion in 2026. In the UK, VRP transactions grew 98% year-over-year in early 2025, signaling a permanent move away from legacy Direct Debits toward real-time, user-controlled subscription models.
-
The Data Quality “Tax”: Data reliability is the ultimate bottleneck for future automation. Currently, 25% of organizations lose more than $5 million annually due to poor data quality. As AI spending scales toward $2 trillion by 2026, the “ROI of Clean Data” becomes quantifiable: companies with high data maturity report 25% faster invoice-to-cash cycles than those with fragmented records.
-
Integration Reliability (SLA Targets): Long-term value will be measured by “Zero-Touch” processing. The benchmark for 2026 is achieving a 95% reduction in reconciliation errors through deep API integration, effectively cutting the time required for financial “month-end close” by 30% to 50%.
Management Takeaway: The shift from “using a tool” to “improving a metric” is now backed by hard math. If your open banking implementation doesn’t deliver at least a 20% improvement in DSO (Days Sales Outstanding) within the first 12 months, the issue is likely process depth, not technology capability.
Editorial Interpretation and Decision Quality
The final editorial lens for open banking is practical decision quality. A statistic is useful only when it helps a business choose a better workflow, set a better target, or avoid a costly blind spot. For example, a market CAGR explains growth momentum, but it does not tell a finance leader which process to fix first. A cycle-time statistic is more actionable when it is tied to a specific bottleneck, owner, and improvement target.
This is why the best report structure combines market data with operating interpretation. Market data explains why the category is expanding. Workflow analysis explains where value is created. Segment analysis explains why different buyers need different roadmaps. Risk analysis explains what should not be automated blindly. Together, these layers make the statistics useful for planning rather than simply interesting to read.
Decision-quality statistics
- Every statistic should answer 1 of 4 questions: scale, adoption, performance, or risk.
- A strong dashboard should show at least 5 operating indicators before leadership relies on it for planning.
- A meaningful improvement target should be time-bound, such as 30, 60, or 90 days after implementation.
- The best benchmark compares before-and-after performance inside the same workflow, not only external averages.
- A useful report should connect market growth to operational choices, not leave market statistics isolated at the top.
Benchmark planning statistics
- Set a 30-day baseline window before launch so volume, cycle time, exceptions, and rework can be compared after rollout.
- Use a 60-day stabilization window after launch before making broad conclusions about ROI or adoption quality.
- Review the top 10 recurring exception reasons and assign owners for the 3 highest-volume causes.
- Track at least 5 operating metrics and 3 business-impact metrics so the scorecard does not become too narrow.
- Compare results across 3 company-size bands and 5 workflow categories before setting long-term targets.
- A mature process should show improvement in at least 2 outcome metrics without increasing risk exceptions by more than 1 review period.
- For high-volume teams, even a 2 percent reduction in rework can matter if the workflow touches thousands of cases per month.
Regional and Company-Size Planning
Regional planning adds another layer to open banking because business infrastructure, payment behavior, regulation, bank connectivity, cloud adoption, and customer expectations are not the same everywhere. A workflow that depends on instant bank data, automated approvals, or digital document exchange may scale quickly in one market and require more manual fallback steps in another. This is why regional statistics should be interpreted alongside infrastructure readiness, not only buyer interest.
Company size changes the roadmap as well. Microbusinesses and smaller firms often want one practical improvement: faster estimates, better funding access, cleaner documents, easier cash visibility, or fewer manual follow-ups. Mid-market companies need repeatability across teams and locations. Large enterprises usually need policy enforcement, audit trails, identity controls, system integration, and reporting consistency across many entities.
A sensible rollout therefore uses different maturity targets by segment. A small company may be successful when 60 percent of a workflow is standardized and visible. A larger organization may need 85 percent or more of routine work to move through controlled rules before the process feels scalable. Highly regulated workflows may need lower automation thresholds but stronger evidence for every exception.
Regional and segment planning statistics
- A small-business target might be 60 percent workflow visibility within the first 90 days rather than full automation from day one.
- A mid-market target might be 75 percent standardized intake across teams before advanced analytics are introduced.
- An enterprise target might be 85 percent routine-path coverage with documented exception queues and monthly governance review.
- A regulated workflow may intentionally keep 10 percent to 20 percent of cases under human review even after automation matures.
- Regional readiness should be scored across 5 areas: digital data availability, payment infrastructure, regulation, integration options, and user adoption.
- A quarterly review should compare at least 3 segments: small accounts, mid-sized operations, and complex enterprise workflows.
- The implementation plan should avoid using a single benchmark when the business operates across multiple regions or customer segments.
- A practical expansion gate is 2 consecutive review periods with stable cycle time, lower exception volume, and no increase in control issues.
Research Depth and Methodology Notes
A deeper research view of open banking starts by asking what economic pressure creates demand. In some categories the pressure is liquidity, in others it is labor cost, error risk, compliance exposure, customer experience, or revenue leakage. The same market-size number means different things depending on which pressure is strongest. A buyer that is trying to reduce a two-day approval delay evaluates the category differently from a buyer trying to reduce funding gaps or improve data extraction accuracy.
The second research question is whether the category changes a decision or only changes a task. A task-level tool helps a user complete work faster. A decision-level system changes how the business prices, approves, funds, routes, forecasts, or controls an outcome. Categories that reach decision-level impact usually justify stronger investment because they affect margin, liquidity, customer retention, audit quality, or risk exposure.
A third question is how much of the workflow is measurable after implementation. Better systems leave a data trail around intake, routing, timing, exceptions, approvals, and outcomes. That trail matters because it lets leaders compare teams, identify bottlenecks, and run continuous improvement instead of relying on anecdotal user feedback.
The research also needs to separate durable trends from temporary buying waves. A temporary wave may come from budget cycles, vendor hype, or a narrow regulatory deadline. A durable trend appears when several independent forces point in the same direction: volume growth, buyer pain, measurable ROI, easier integration, stronger data availability, and greater need for control.
Methodology statistics and interpretation rules
- Market estimates should be treated as directional when one source includes services or transaction value and another includes only software revenue.
- Adoption percentages should be read together with maturity indicators such as straight-through processing, exception rate, and integration depth.
- Survey results can overstate maturity when respondents count partial digitization as full workflow automation.
- Operational benchmarks should be normalized for volume because a low-volume process can show different economics from a high-volume process.
- Regional comparisons should account for regulation, banking infrastructure, cloud adoption, and local business-payment behavior.
- Internal baselines should be captured before implementation; otherwise teams may not know whether a 10 percent or 30 percent improvement is realistic.
- A reliable benchmark combines at least 2 external references with the company’s own baseline operating data.
Industry and Use-Case Deep Dive
Industry context changes how open banking should be evaluated. In fintech apps, the workflow often involves high-frequency activity, many handoffs, and a need for fast visibility. In digital lenders, the same category may be judged by how well it supports margin control, credit timing, or operational capacity. These distinctions matter because one set of statistics cannot explain every business model equally well.
For accounting platforms organizations, the most important improvement may be reducing rework and standardizing data. For payment providers, the priority may be faster approvals, clearer documentation, or better exception management. For banks, the strongest value may come from creating a repeatable process that reduces dependence on individual employees remembering every detail.
Industry-specific adoption also depends on data readiness. A sector with structured digital inputs can often automate faster than a sector where the same information arrives through email, PDFs, phone calls, informal notes, or spreadsheets. This does not mean the second sector has less need. It usually means implementation must spend more time on intake rules, document capture, validation, and user training.
A useful industry benchmark should therefore compare both outcomes and constraints. Leaders should ask whether peers have similar transaction volume, similar approval complexity, similar regulation, similar customer behavior, and similar integration requirements. Without those adjustments, a benchmark can push teams toward unrealistic targets or understate the value of incremental improvement.
Industry-specific statistics and signals
- Fintech apps use cases often need faster throughput and clearer handoff visibility.
- Digital lenders use cases often depend on better margin, funding, or operational timing.
- Accounting platforms use cases usually need stronger data quality and standardized records.
- Payment providers use cases often require careful approval design and exception ownership.
- Banks use cases tend to benefit when repeatable tasks are turned into governed workflows.
- The strongest benchmark compares similar workflow complexity, not only similar company revenue.
Operating Example and Practical Business Case
Consider a company that handles 8,000 relevant workflow items each month and still depends on spreadsheet tracking, email approvals, and manual status updates. If each item requires only 4 minutes of avoidable handling, the business is spending more than 530 hours a month on work that does not create additional strategic value. That example is intentionally simple, but it shows why small time savings become meaningful when volume repeats.
Now add quality problems. If 3 percent of those items require rework, 240 cases a month need extra attention. If each rework case takes 20 minutes to investigate, the team loses another 80 hours. If some of those errors affect customers, suppliers, financing decisions, estimates, documents, or compliance evidence, the cost is not only internal labor. It also becomes delay, trust loss, cash uncertainty, or risk exposure.
The same example explains why leaders should not measure only license cost. If a system reduces average handling by 90 seconds, cuts rework from 3 percent to 1.5 percent, and makes exceptions visible earlier, the value may show up across multiple departments. Finance may see cleaner records. Operations may see faster decisions. Sales or service teams may see better customer follow-up. Leadership may see more reliable reporting.
This type of operating example is more useful than a generic ROI claim because it converts statistics into a local baseline. Every organization can replace the volume, time, rework, and cost assumptions with its own numbers. The result is a business case that is grounded in actual workflow economics rather than broad market averages.
Practical operating calculations
- If a team processes 8,000 items per month, every 1 minute of avoidable handling equals about 133 hours of monthly capacity.
- A 3 percent exception rate on 8,000 monthly items creates 240 cases that require investigation before the process can be considered stable.
- Reducing average cycle time by 20 percent can be more valuable than reducing software cost by 5 percent when the workflow affects cash, customers, or compliance.
- A useful target is to review the top 5 exception reasons every month and remove at least 1 recurring root cause each quarter.
- Management dashboards should compare at least 3 views: total volume, exception volume, and business outcome movement.
- For open banking, the scorecard should connect API success rate with data-refresh frequency so leaders can see whether activity translates into value.
- Teams should segment results by at least 4 dimensions: business unit, workflow type, company size, and risk level.
Frequently Asked Questions
What does open banking measure?
Open Banking statistics measure market growth, adoption, workflow volume, operating performance, and business impact. The most useful numbers are not only market-size figures. They also show how teams use the tools, where manual work remains, which segments are growing fastest, and which metrics prove that the process is improving.
Why do published open banking estimates differ?
Estimates differ because research firms define the market differently. Some include only software revenue. Others include services, transaction value, financing volume, implementation, platform fees, or adjacent workflow tools. The best approach is to compare direction, assumptions, and operational relevance rather than treating every estimate as directly interchangeable.
Which metrics matter most for open banking?
The strongest scorecard includes API success rate, consent conversion, active connections, payment-initiation volume. More mature teams also track data-refresh frequency, error rate, third-party provider count, account coverage. This combination shows speed, quality, value, and risk rather than only showing whether a tool has been deployed.
How should small businesses use these statistics?
Small businesses should use these statistics as a way to prioritize practical improvements. The goal is not to copy enterprise benchmarks. It is to identify where manual work, payment timing, data quality, approval delays, or customer experience problems are creating avoidable pressure.
How should enterprises use these statistics?
Enterprises should use the statistics to compare process maturity across teams, countries, business units, and systems. At scale, the value often comes from standardization, integration, auditability, and exception management rather than only from time saved by individual users.
What is the most common implementation mistake?
The most common mistake is buying technology before clarifying the workflow. Teams need to define data requirements, approval rules, exception handling, ownership, integrations, and success metrics before expecting the tool to produce consistent results.
How does AI affect open banking?
AI can improve classification, data extraction, recommendations, anomaly detection, and workflow guidance. It should still operate inside clear controls, especially when the process affects payments, credit decisions, customer data, financial reporting, or contractual commitments.
What should leaders do before investing?
Leaders should document the current baseline: volume, cycle time, cost, error rate, manual touch count, exception reasons, and downstream rework. That baseline makes it easier to choose the right first use case and prove whether the investment actually improves the business.
Final Takeaway
Open Banking Statistics show a category shaped by the same forces affecting modern finance and operations: demand for faster workflows, better data, stronger controls, and clearer visibility. The market numbers show investment momentum, but the more useful story is operational. Businesses want tools that reduce friction, improve decisions, and make work easier to manage as volume and complexity grow.
The most important lesson is that statistics should lead to better questions. Which workflow is slowest? Which errors create the most rework? Which metric would change a customer, supplier, lender, finance, or operations outcome? Which process can be improved first without weakening control? Companies that answer those questions carefully will get more value from open banking than companies that only follow market growth headlines.


