Quote management software is where buyer interest becomes a controlled commercial offer. A quote may look like a simple sales document, but it carries pricing rules, product configuration, discount limits, approval history, payment terms, service scope, tax details, renewal assumptions, and the first structured version of what the company expects to deliver and bill later.
That makes quote management a revenue-control system, not just a document-production tool. When quotes are slow, sales teams lose momentum. When quotes use outdated pricing, margin can disappear before a contract is signed. When quotes are approved outside policy, finance inherits a deal that may be hard to fulfill, invoice, renew, or recognize cleanly. When quote details are disconnected from CRM, contract, order, or billing systems, revenue leakage can appear weeks or months after the customer has already said yes.
The strongest statistics surrounding quote management span several connected areas, including quote management software, CPQ, proposal management, pricing optimization, contract lifecycle management, sales productivity, bid response, AI-assisted selling, and quote-to-cash leakage. This report uses these insights as practical operating signals rather than simply presenting market-size data. By integrating an effective quote template into the workflow, sales, revenue operations, finance, legal, and delivery teams can better understand how quote processes influence speed, accuracy, governance, margin protection, and overall business risk.
A useful quote-management scorecard therefore asks practical questions. How long does it take to send an accurate quote? How often do quotes need revision? How many discounts need escalation? How often do contract terms fail to match what was quoted? How many billing corrections begin with quote-stage gaps? How much seller time is consumed by approvals, tool switching, document rebuilding, and data entry? Those questions turn quote management statistics into operational guidance rather than a narrow software-market overview.
Executive Quote Management Benchmarks
These headline benchmarks frame the category. They show the growth of quote management, CPQ, proposal software, and related revenue operations systems, while also showing why manual quote workflows create real sales and finance pressure.
The numbers that define the quote management problem
• Future Market Insights projects the quote management software market to grow from $2.6 billion in 2025 to $12.2 billion by 2035, a 16.9% CAGR.
• In the same outlook, CPQ software is expected to hold 39.2% of quote management software market share.
• Large enterprises are projected to lead quote management software adoption with 62.5% of market share.
• Grand View Research estimates the global CPQ software market at $3.46 billion in 2025, reaching $10.89 billion by 2033.
• That CPQ forecast implies a 15.6% CAGR from 2026 to 2033.
• Persistence Market Research places the CPQ market at $3.2 billion in 2025 and $8.9 billion by 2032, with a 15.7% CAGR.
• Fortune Business Insights estimates proposal management software at $3.26 billion in 2025, rising to $9.19 billion by 2034.
• North America accounted for 33.79% of the proposal management software market in the Fortune Business Insights benchmark.
• Future Market Insights separately projects proposal management software to grow from $3.2 billion in 2025 to $9.0 billion by 2035.
• Salesforce reports that sales reps spend 60% of their time on non-selling tasks, including quote creation, data entry, and internal approvals.
• Salesforce also reports that sales teams use an average of 10 tools to close deals, which helps explain why quote data often lives across disconnected systems.
• In the same sales productivity context, 66% of reps say they are drowning in tools, making quote workflow consolidation a practical revenue-operations issue.
• Tool overload matters for quoting because each disconnected system increases the chance that product, price, approval, contract, and invoice data will drift apart.
• Older Salesforce research found that 72% of sellers’ weekly time was spent on non-selling activities such as deal management and data entry.
• Salesforce describes quote-to-cash as spanning sales, account management, order fulfillment, billing, and accounts receivable, showing that quote quality affects more than the sales team.
• Revenue-leakage benchmarks commonly cite 42% of companies experiencing leakage, with losses often discussed around 1% to 5% of revenue or realized earnings depending on source definition.
• Proposal and RFP benchmarks commonly place average win rates around the mid-40% range, while top-performing teams are often reported at 60% or higher.
• Reuters reported in 2025 that Oracle added AI pricing and quoting features to NetSuite, including chatbot-assisted quote creation for complex configurable purchases.
• Proposal management forecasts also point to the same revenue-workflow trend: several 2034-2035 estimates cluster around $8 billion to $10.5 billion.
• In a 40-hour week, those two activities equal about 7.28 hours of seller capacity before prospect research, planning, and other admin work are counted.
• Older Salesforce time-allocation data places quote/proposal/approval work at 9.4% of a seller’s average week and manual customer/sales data entry at 8.8%.
• Pricing software forecasts add another adjacent signal: one market outlook places pricing software at $1.20 billion in 2023 and $2.88 billion by 2031.
• The contract lifecycle management forecast implies a 13.06% CAGR, which matters because accepted quotes need to become controlled contract terms.
• Mordor Intelligence estimates contract lifecycle management at $3.0 billion in 2025, $3.39 billion in 2026, and $6.26 billion by 2031.
• Technavio/Research and Markets expects the CPQ software market to add $5.46 billion from 2025 to 2030, with a 20.9% CAGR in that forecast.
• Mordor Intelligence places the CPQ market at $3.14 billion in 2025 and projects $7.55 billion by 2031, a 15.74% CAGR under its category definition.
Additional Executive Signals
Executive readout:The headline data points to a clear pattern. Quote management is being pulled into a larger revenue operations stack. Companies are not only trying to make quotes faster; they are trying to make quotes more accurate, easier to approve, easier to convert into contracts, and less likely to create billing or revenue leakage later. The best use of these benchmarks is to separate three questions: whether the market is growing, whether sales teams are losing time in manual work, and whether quote data is strong enough to survive contract and billing handoff.
Why Quoting Has Become a Revenue-Control Problem
A quote is usually the first moment when a buyer sees the commercial version of the deal. Before that point, the sales conversation may be exploratory. After that point, the company has put specific numbers, terms, scope, discounts, and assumptions in front of the customer. The quote therefore becomes a promise that other teams have to honor.
This is why manual quote handling creates more risk than it appears to. A rep may build a quote from a copied document, an old spreadsheet, a stale price list, or a prior customer proposal. The document may look polished, but the underlying data may not match current pricing, approved discounts, tax rules, product availability, service terms, or contract language. The customer may accept the quote quickly, while the company spends the next month repairing the operational consequences.
The quote also creates a handoff problem. Sales may care about speed and buyer response. Finance cares about margin, billing rules, tax details, and payment terms. Legal cares about approved language and risk exposure. Operations or delivery cares about whether the company can actually fulfill what was quoted. A weak quote process gives each team a different version of the deal.
Better quote management software reduces this gap by turning quote creation into a controlled workflow. It can centralize products, services, prices, discount thresholds, approval rules, customer terms, templates, and audit history. The strongest systems make the right quote easier to produce than the wrong one.
| Quote element | What it controls | What can break when it is weak |
|---|---|---|
| Product or service scope | What the customer expects to receive | Missing work, delivery disputes, or rework |
| Price and discount | Margin, policy compliance, and buyer expectation | Underpricing, unauthorized concessions, or approval delays |
| Configuration | Product feasibility, bundles, dependencies, and compatibility | Incorrect orders or fulfillment problems |
| Payment terms | Billing timing, cash collection, and customer obligation | Invoice disputes or collection delays |
| Tax, currency, and region | Local financial treatment and compliance | Invoice corrections or local-market friction |
| Approval history | Governance, audit trail, and exception ownership | Deals approved outside policy or without evidence |
| Contract language | Legal handoff and customer commitments | Quote-to-contract mismatch or redline delay |
The practical lesson is that quote management has to be evaluated by more than document speed. A company can produce quotes quickly while still leaking margin through discounts, creating disputes through vague scope, or delaying invoices because quote data does not move into billing correctly. Speed matters, but controlled speed matters more.
Market Size: Quote Management, CPQ, Proposal Software, and CLM
Market-size data is useful because quote management is no longer a single software category. It overlaps with configure-price-quote tools, proposal management systems, pricing software, contract lifecycle management, CRM, ERP, subscription billing, and revenue lifecycle platforms. Different publishers draw the category boundaries differently, so the numbers should be read directionally rather than as one exact market total.
Quote management and CPQ software growth
• The quote management software market is estimated at $2.6 billion in 2025 and projected to reach $12.2 billion by 2035.
• The quoted 16.9% CAGR for quote management software points to sustained demand for controlled quoting workflows.
• CPQ software is expected to represent 39.2% of quote management software market share in the Future Market Insights forecast.
• Large enterprises are projected to hold 62.5% of quote management software market share, reflecting the complexity of larger sales organizations.
• Grand View Research estimates CPQ software at $3.46 billion in 2025 and $10.89 billion by 2033.
• Grand View Research links CPQ growth to organizations adopting digital sales tools for complex product configurations and pricing structures.
• Persistence Market Research estimates CPQ at $3.2 billion in 2025 and $8.9 billion by 2032.
• DataIntelo places CPQ at $3.6 billion in 2025 and $9.1 billion by 2034, showing that category forecasts vary but point in the same growth direction.
• Grand View Research estimates Europe CPQ revenue at $947.7 million in 2025, with a projected 14.6% CAGR through 2033.
• Recent CPQ forecasts commonly place the category in the mid-teens CAGR range, suggesting strong demand for guided selling, product configuration, and pricing governance.
Proposal, contract, and pricing software connections
• Fortune Business Insights estimates proposal management software at $3.26 billion in 2025 and $9.19 billion by 2034.
• That proposal software forecast implies a 12.20% CAGR from 2026 to 2034.
• North America held 33.79% of proposal management software market share in 2025.
• Future Market Insights projects proposal management software from $3.2 billion in 2025 to $9.0 billion by 2035.
• The same proposal outlook expects software to dominate with 59.6% share and government to lead vertical adoption with 22.8% share.
• Research and Markets estimates proposal management software at $3.5 billion in 2025 and $10.5 billion by 2034 under a broader forecast boundary.
• Contract lifecycle management software is often measured separately, but it is the next step after quote acceptance because approved commercial terms need to become controlled contract data.
• Pricing optimization software is also adjacent to quote management because quote accuracy depends on price books, discount logic, volume tiers, local price lists, and approval thresholds.
• The practical market signal is not one exact number; it is that quote management, CPQ, proposal, pricing, and contract systems are all growing because companies need cleaner commercial workflows.
• Across these adjacent markets, the pattern is consistent: quote creation is being surrounded by pricing, proposal, contract, and lifecycle systems because one PDF invoice quote is not enough for modern revenue operations.
• Dynamic pricing software is estimated at $4.0 billion and forecast to reach $6.9 billion by 2030, with a 14.6% CAGR.
• Price monitoring software is projected by one estimate from $1.92 billion to $5.09 billion by 2034, with a 13% CAGR.
• Price optimization software forecasts can be even faster: one market-growth estimate moves from $2.18 billion to $11.06 billion by 2035, a 22.53% CAGR.
• Another contract management outlook places the market at $2.56 billion and $7.14 billion by 2031, implying a 13.7% CAGR under a broader definition.
• The same contract management forecast implies an 8.39% CAGR, which is slower than CPQ but still shows steady investment in post-quote agreement control.
• Contract management software is estimated at $3.48 billion in 2025, $3.77 billion in 2026, and $5.64 billion by 2031 in one Mordor forecast.
• Business Research Insights places proposal management software at $2.81 billion and projects $8.22 billion by 2035, with a 12.5% CAGR.
• Market Research Future places proposal management software at $2.691 billion and forecasts $7.85 billion by 2035, with a 10.22% CAGR.
• Future Market Insights expects proposal management software components to hold 59.6% share, while government leads vertical adoption at 22.8% in that outlook.
• Proposal management software has multiple public forecasts: $3.26 billion to $9.19 billion by 2034, $3.2 billion to $9.0 billion by 2035, and $3.5 billion to $10.5 billion by 2034.
Adjacent market benchmarks that explain the full quoting stack
Market readout: Quote management, CPQ, proposal software, CLM, and pricing optimization should not be treated as interchangeable markets. They measure different layers of the same revenue workflow. The shared signal is that companies are investing in systems that connect pricing, approvals, proposals, contracts, and billing instead of letting each step live in a separate spreadsheet or inbox.
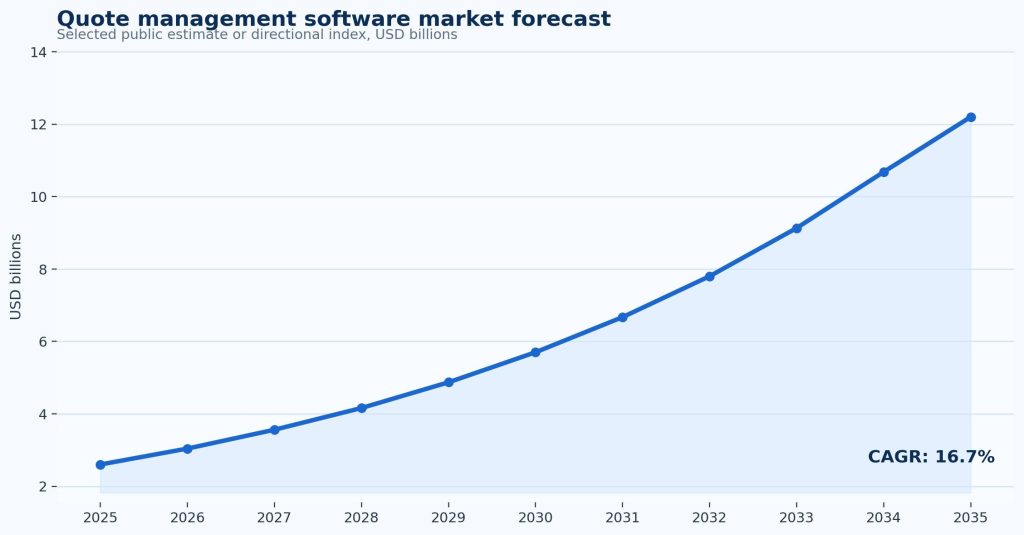
Figure 1. Quote management software growth should be read alongside CPQ, proposal management, pricing optimization, and contract lifecycle software because the quote is only one stage in a larger revenue workflow.
Where Manual Quotes Slow Sales Teams Down
The strongest operational case for quote management software is time. Sales teams are expensive, quota-bearing, and expected to spend as much time as possible with buyers. Yet quoting often forces reps into non-selling work: searching for the right product details, checking price lists, copying terms from old documents, chasing approvals, updating CRM fields, and repairing quote mistakes after a customer asks questions.
Salesforce’s 60% non-selling-time benchmark is especially relevant because the examples include the same tasks that appear in quote workflows: finding pitch materials, entering CRM notes, creating quotes, and chasing internal approvals. That does not mean quoting is the only cause of administrative burden, but it does show that quote management belongs in any serious sales productivity review.
• Salesforce reports that sales reps spend 60% of their time on non-selling tasks.
• Salesforce examples of non-selling work include quote creation, data entry, hunting for materials, and chasing internal approvals.
• Older Salesforce research placed non-selling activity at 72% of sellers’ average week.
• Salesforce’s quote-to-cash material places quote configuration and proposal drafting before order fulfillment, billing, receivables, and payment.
• A quote process that requires repeated manual updates can reduce selling time even when the final quote looks correct.
• Quote revisions consume extra capacity because each change may require price checks, approval review, document regeneration, and CRM updates.
• Manual quote workflows often create duplicate work when sales updates a document while finance, legal, or operations maintain separate records.
• Tool fragmentation increases the risk that the quote, CRM opportunity, contract draft, order record, and invoice setup do not match.
• For complex sales teams, the quote cycle is often a coordination problem as much as a pricing problem.
• A faster quote process can improve buyer experience only when the quote is accurate enough to survive approval, contract, and billing handoff.
| Manual quoting friction | Sales impact | Revenue impact |
|---|---|---|
| Searching for current price lists | Slower response to buyer requests | Deals lose momentum |
| Copying product or service descriptions | Higher chance of outdated details | Revisions and customer confusion |
| Email-based approval chains | Rep follow-up and stalled opportunities | Late-stage deal slippage |
| Manual discount calculations | More pricing review and uncertainty | Margin leakage or policy exceptions |
| Rebuilding proposal documents | Less time with customers | Lower sales capacity |
| Separate quote and billing data | More handoff cleanup | Billing corrections or revenue leakage |
The important distinction is between quote speed and quote throughput. A rep may be able to send one manual quote quickly when the deal is simple. But if the company needs hundreds or thousands of accurate quotes across teams, regions, products, bundles, currencies, and approval rules, throughput depends on standardization. Quote management software creates value when it reduces repeated administrative decisions and turns quote creation into a guided process.
This is also why quote automation should not be sold internally as a design upgrade. The real business case is capacity recovery and decision consistency. When reps spend less time rebuilding quote documents, they can spend more time qualifying buyers, clarifying scope, defending value, and moving the deal forward. When approvals and price rules are visible in one workflow, managers can coach the behavior instead of discovering discount patterns after the quarter closes.
• The 66% “drowning in tools” benchmark matters because a quote workflow that adds another disconnected system can worsen the same productivity problem it was supposed to solve.
• Salesforce’s reported average of 10 tools to close deals creates a practical integration problem: the quote may depend on data from CRM, pricing, product, approval, contract, and billing systems.
• Preparation and planning at 9.0% equals about 3.6 hours weekly, which can include quote review, deal strategy, and proposal readiness.
• Prospect research at 9.3% equals about 3.72 hours weekly, showing how quickly small administrative categories consume seller capacity.
• Lead and opportunity prioritization at 9.2% equals about 3.68 hours weekly, which competes with quote follow-up and buyer response time.
• Manual customer and sales information entry at 8.8% equals about 3.52 hours per rep each week.
• Quote/proposal/approval work at 9.4% of the week equals about 3.76 hours per rep in a 40-hour week.
• When actual selling time is measured at 28% of the week, a 40-hour seller has about 11.2 hours of direct selling time.
• The same 60% benchmark leaves only 40% of the week, or about 16 hours, for selling, buyer conversations, and customer-facing work.
• If non-selling work takes 60% of a 40-hour week, the implied non-selling load is about 24 hours per rep each week.
Sales capacity benchmarks that make quoting measurable
Sales productivity readout: Manual quoting creates a compound cost. It slows response time, reduces seller capacity, increases revision work, and weakens forecast data. The strongest quote-management programs measure both the time saved by automation and the quality of the commercial decisions that become easier to enforce.
Pricing Accuracy, Discounts, and Approval Governance
Pricing is one of the main reasons quote management needs governance. The quote is where internal pricing strategy becomes customer-facing reality. If the wrong price goes out, the company may either disappoint the buyer by correcting it later or accept weaker margin to avoid friction. If unauthorized discounts become common, a revenue team can hit booking targets while quietly reducing deal quality.
CPQ systems are built for this problem. They help sales teams configure the right product or service package, apply approved pricing rules, calculate discounts, route exceptions, and produce quote documents that reflect current commercial logic. In simpler businesses, a quote template may be enough. In complex B2B environments, pricing logic usually needs stronger controls.
• CPQ stands for configure, price, quote, which reflects three connected problems: what can be sold, what it should cost, and how the offer should be presented.
• Grand View Research links CPQ adoption to complex product configurations and pricing structures.
• Quote management software forecasts assigning 39.2% share to CPQ indicate that configuration and pricing control are central to the category.
• Large-enterprise share of 62.5% reflects the need for more approval layers, product rules, and integration in bigger organizations.
• Pricing software growth supports the same trend: companies are trying to manage price decisions more systematically rather than relying only on rep judgment.
• Salesforce CPQ material describes quote tools as supporting product catalogs, discount controls, tax and currency management, templates, calculations, and approvals.
• Unauthorized discounts are not only sales exceptions; they can become margin, compensation, and forecast-quality problems.
• Outdated price books create risk because a quote may reflect prior cost assumptions, expired promotions, or old service packages.
• Multi-currency quoting creates additional risk when exchange rates, regional price lists, tax treatment, and local terms are not controlled centrally.
• Subscription and usage-based businesses face extra quoting complexity because quotes can include renewals, expansions, amendments, credits, usage tiers, and contract dates.
| Pricing risk | Better quote-management control |
|---|---|
| Outdated price list | Centralized price book and version control |
| Unauthorized discount | Approval thresholds and audit history |
| Wrong configuration | Guided selling and compatibility rules |
| Region or currency mismatch | Localized quote logic and approved terms |
| Missing service fee | Required fields and quote validation |
| Expired promotion | Date-based rules and offer controls |
| Contract mismatch | Quote-to-contract integration |
• A useful governance test is whether every non-standard discount preserves 3 pieces of evidence: who requested it, who approved it, and which margin rule it crossed.
• Quote teams should therefore track discount exception rate, price override rate, margin exception rate, and manual approval rate, not just quote volume.
• A price optimization forecast of $2.18 billion to $11.06 billion by 2035 suggests pricing control is no longer a finance-only spreadsheet exercise.
• Price monitoring software projected from $1.92 billion to $5.09 billion by 2034 shows that companies are also investing before the quote stage to understand competitive price pressure.
• A 14.6% CAGR in dynamic pricing software points to growing demand for pricing rules that can respond to market, cost, competition, and inventory conditions.
• Dynamic pricing software at $4.0 billion to $6.9 billion by 2030 shows that pricing decisions increasingly move faster than manual quote templates can support.
• Asia-Pacific is identified as a fastest-growing region in that pricing software outlook, which matters for global sellers managing local price lists.
• The same pricing-software outlook identifies manufacturing as a leading segment, which aligns with CPQ demand for configurable products and complex price books.
• That pricing software forecast implies an 11.49% CAGR, supporting the idea that price governance is becoming a software-controlled workflow.
• Insight Partners estimates pricing software at $1.204 billion in 2023 and forecasts $2.876 billion by 2031.
Pricing software and discount-control benchmarks
Pricing readout: Quote software protects margin when it makes the approved price easier to use than the wrong price. The value is not only faster document creation. It is fewer avoidable discount exceptions, clearer approvals, more consistent pricing, and a cleaner handoff from sales to finance.
Quote Data Quality: The Fields That Need to Survive Handoff
A quote is useful only if the information inside it can move into the next system without being reinterpreted by hand. In many companies, the visible quote document looks correct, but the structured data behind it is incomplete. The quote may show the right total while missing the billing start date, renewal treatment, tax rule, service period, product identifier, or approval record needed downstream.
This is why quote quality should be measured field by field. The customer sees the final offer, but finance and operations need each commercial field to be reliable enough for contracting, order entry, invoicing, revenue recognition, and collections. A weak quote-management process may not fail at the moment the quote is sent. It fails later, when another team has to rebuild the same deal from PDFs, emails, spreadsheets, and CRM notes.
Quote fields that create downstream risk
• Product or service identifiers help operations understand exactly what was sold, especially when similar packages, bundles, or service tiers exist.
• Quantity, term length, renewal date, and service period fields matter because they control billing setup and future amendments.
• Discount reason, approval owner, and approval date matter because margin exceptions need an audit trail, not only a final net price.
• Tax, currency, and entity fields matter because global quotes can become invoice or compliance problems if local treatment is unclear.
• Scope assumptions matter for service businesses because vague quote language can become unpaid work, invoice disputes, or change-order friction.
• Payment terms and billing frequency matter because a customer may accept the commercial price while later disputing how and when the amount is billed.
• Contract language references matter because sales may quote one set of obligations while legal or finance uses another version in the final agreement.
• Quote revision history matters because teams need to know which version was approved, which version the buyer accepted, and which version became the contract.
• Billing correction rate should be reviewed as a downstream quote-quality metric because invoice corrections often expose missing fields from the quote stage.
• Contract mismatch rate should capture cases where the final agreement does not match the approved quote on price, scope, term, or discount.
• Quote-to-order conversion measures how many accepted quotes become clean orders without manual re-entry.
• Quote acceptance time measures the number of days from quote sent to buyer acceptance and should be reviewed by segment, product, and deal size.
• Expired quote rate measures the share of quotes that expire before buyer action, which can reveal slow follow-up, weak urgency, or pricing-validity issues.
• Configuration exception rate measures the share of configured products or service packages that require manual review before the quote can be sent.
• Price override rate measures the share of quotes where a rep or manager changes the system-recommended price.
• Discount exception rate measures the share of quotes requiring approval beyond standard policy.
• Quote error rate should count corrections caused by wrong price, product, tax, discount, term, scope, or payment information.
• Quote revision rate measures the share of quotes revised after first send and helps separate buyer negotiation from internal quote errors.
Quote data-quality metrics worth tracking
Data-quality readout: The most useful quote-management metric is not simply the number of quotes produced. It is the share of quotes that can become approved contracts, accurate orders, clean invoices, and reliable forecasts without another team repairing the data. That is why quote management belongs in revenue operations, not only in sales enablement.
Quote-to-Cash Leakage: Where Bad Quotes Become Billing Problems
The quote-to-cash lens is what makes quote management more than a sales-operations topic. Salesforce describes quote-to-cash as covering the path from quote configuration and proposal drafting through order fulfillment, billing, accounts receivable, and payment. That means quote data can affect every downstream stage of the revenue cycle.
Revenue leakage often begins when a deal is documented in a way that cannot be reliably billed later. A missing line item may become underbilling. A vague service description may become a dispute. A discount approved in email may not appear in the contract system. A renewal quote may not match billing setup. A one-time implementation fee may be discussed but not captured. None of those problems necessarily appears as a quote error on day one, but each can reduce revenue quality.
• Revenue-leakage research is commonly cited for estimating that 42% of companies experience some form of leakage.
• Revenue leakage is often described as lost value between what customers agreed to pay and what the company actually bills or collects.
• Leakage estimates are frequently discussed around 1% to 5% of revenue or realized earnings depending on source definition and business model.
• Manual quote-to-cash processes create risk because quote data, contract terms, order details, billing rules, and customer records may live in separate systems.
• Disconnected systems make it harder to know whether the quote, contract, invoice, renewal, and revenue forecast describe the same deal.
• Quote-to-cash problems are especially visible in subscription, usage-based, equipment, manufacturing, professional services, and complex B2B sales models.
• A quote that wins the deal can still create revenue risk if it contains terms that finance cannot bill cleanly.
• A quote that includes special terms should preserve those terms as structured data, not only as text inside a PDF.
• Billing corrections are a useful signal because they often reveal quote-stage gaps, contract mismatch, or missing approval details.
• Quote management should therefore be measured partly by downstream outcomes, including contract mismatch, billing corrections, disputes, and revenue leakage indicators.
| Leakage point | Quote-stage cause | Downstream symptom |
|---|---|---|
| Underbilling | Missing line item or service fee | Revenue not invoiced |
| Over-discounting | Unauthorized or excessive discount | Margin loss |
| Contract mismatch | Quote terms not preserved | Legal redline or billing dispute |
| Billing delay | Missing billing details or dates | Invoice correction and late collection |
| Renewal confusion | Manual amendment not reflected | Customer dispute or wrong renewal price |
| Tax/currency issue | Region not handled correctly | Invoice rejection or compliance review |
| Poor handoff | Sales and finance use different records | Forecast and revenue mismatch |
• For services firms, leakage can appear as unbilled scope, vague milestone language, missing expenses, or rate tables that do not survive contract review.
• For product companies, leakage can appear as missing accessories, wrong configuration, unsupported bundle logic, freight gaps, or installation assumptions left outside the quote.
• For subscription companies, quote-to-cash leakage should be checked across renewals, amendments, usage tiers, credits, discounts, and contract-date changes.
• A 5% leakage problem on the same $100 million base equals $5 million, which shows why quote data control can matter even when leakage percentages appear small.
• A 1% revenue-leakage problem on $100 million of annual revenue equals $1 million of value that was sold, contracted, or expected but not captured cleanly.
• Quote/proposal/approval time at 9.4% is slightly higher than manual data-entry time at 8.8%, which means quoting is one of the largest named administrative work categories.
• In a 40-hour week, that 18.2% equals about 7.28 hours of seller time spent on work that can directly affect quote-to-cash data quality.
• Salesforce’s time allocation puts quote/proposal/approval work and manual data entry together at 18.2% of a seller’s week.
• The CPQ abbreviation itself contains 3 functions – configure, price, and quote – which shows why quoting is both a product-control and pricing-control workflow.
• Salesforce’s quote-to-cash model lists 5 connected stages: sales, account management, order fulfillment, billing, and accounts receivable.
Revenue leakage and handoff benchmarks
The strongest quote-to-cash programs treat the accepted quote as a controlled data object. The quote should feed the contract, order, billing, revenue recognition, and renewal process with as little manual translation as possible. That does not remove the need for human judgment, but it reduces the risk that each team reinterprets the deal differently.
CPQ, Proposal Management, and Contract Handoff
Quote management overlaps with CPQ, proposal management, and contract lifecycle management, but each category has a different job. CPQ controls commercial logic. Proposal tools package the offer for buyer review, formal RFP response, or executive approval. Contract tools preserve the approved terms and move them into legal and operational execution. The handoff matters because a quote that is persuasive but not executable can still create operational risk.
CPQ for complex configuration and pricing
• CPQ software is projected by Grand View Research to reach $10.89 billion by 2033.
• CPQ systems are most valuable when product, service, bundle, discount, or compatibility rules are too complex for manual quote templates.
• Manufacturers use CPQ to manage configurable products, dependencies, parts, bundles, and technical feasibility.
• SaaS and subscription companies use CPQ to manage renewals, amendments, seat counts, usage tiers, bundles, and billing dates.
• Professional services firms use quote controls to preserve scope, rates, retainers, milestones, expenses, and approval history.
• Telecommunications, insurance, healthcare, industrial, and technology sellers often need stronger quote logic because offers vary by customer, region, package, and compliance rule.
Proposal management for formal offers and bids
• Proposal management software is projected by Fortune Business Insights to reach $9.19 billion by 2034.
• Future Market Insights projects proposal management software to reach $9.0 billion by 2035.
• Proposal software is connected to quote management because many formal proposals contain pricing tables, service scope, terms, implementation assumptions, compliance answers, and approval language.
• Reusable content libraries reduce repeated drafting when teams answer similar questions across bids, RFPs, and enterprise proposals.
• Automated compliance checks are increasingly important in proposal workflows because a missed requirement can disqualify an otherwise competitive bid.
• Distributed sales teams need proposal systems that preserve current content, pricing, legal language, and approval evidence across regions.
Contract handoff after quote acceptance
• CLM and quote management meet at the point where a commercial offer becomes a controlled agreement.
• A contract system cannot preserve terms that were never captured clearly in the quote workflow.
• Quote-to-contract handoff is especially important when quotes include custom pricing, implementation commitments, renewals, minimums, service levels, or nonstandard payment terms.
• Legal review becomes slower when the quote contains special terms that are not traceable to approved clauses or pricing authority.
• Finance teams need quote details to become billing-ready data, not only a signed PDF or email attachment.
• Mature revenue teams connect CPQ, proposal, contract, billing, and CRM records so the commercial offer remains consistent across the deal lifecycle.
• A mature quote-to-contract process should preserve at least 5 things from the accepted quote: price, scope, term, discount approval, and billing rule.
• Government’s 22.8% proposal vertical share in one outlook supports the importance of compliance-heavy bid workflows.
• The software component share of 59.6% in one proposal forecast indicates that organizations are buying systems, not only services, to manage proposal content and workflow.
• Proposal management market forecasts in the $7.85 billion to $10.5 billion range by 2034-2035 show that formal bid documents are being treated as controlled revenue assets.
• A broader GMI CLM forecast cites a 13.1% CAGR, again showing double-digit growth in agreement-management infrastructure.
• Precedence Research places CLM software at $2.96 billion and forecasts $8.84 billion by 2035, a 11.56% CAGR.
• One Grand View CLM outlook moves from $1.62 billion to $3.24 billion by 2030, implying a 12.7% CAGR.
• CLM software forecasts range from about $1.62 billion to $8.84 billion depending on market boundary, which shows how differently vendors and analysts define the post-quote contract layer.
Handoff benchmarks for CPQ, proposal, and CLM systems
Workflow readout: CPQ, proposal management, and CLM should not be treated as separate islands. In mature revenue teams, CPQ controls the commercial logic, proposal tools package the offer, and CLM preserves the approved terms. The handoff matters because a quote that wins the deal but fails the contract or billing stage still creates operational risk.
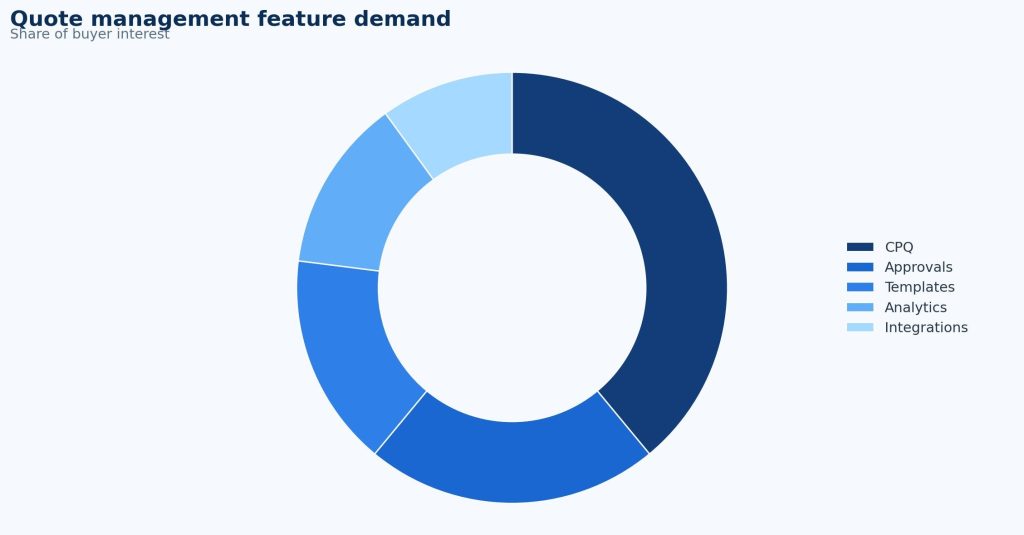
Figure 2. Quote management connects sales configuration, proposal quality, approval governance, contract handoff, and quote-to-cash reliability.
Proposal, RFP, and Bid-Response Benchmarks
Proposal and RFP statistics are often the most complex version of quoting. A buyer may not only ask for a price. They may request compliance answers, implementation details, references, security documents, legal terms, service levels, product specifications, and detailed pricing schedules. In those workflows, the quote becomes one section of a larger revenue document.
• RFP win-rate benchmarks commonly place average win rates around 45% in recent proposal research.
• Some reports show average RFP win rates improving from 43% to 45% across recent benchmark periods.
• Top-performing RFP teams are commonly reported at 60% or higher win rates.
• Enterprise RFP teams are often benchmarked slightly above mid-market and SMB teams because they have more mature proposal resources and deal support.
• Proposal management software growth is tied to digital proposal workflows, automated compliance verification, and distributed bid-response needs.
• North America’s 33.79% proposal management software share shows that mature B2B sales markets are investing heavily in formal proposal workflows.
• Government leading the Future Market Insights proposal vertical benchmark at 22.8% reflects the importance of structured bid responses in public-sector selling.
• Proposal software with reusable content can reduce repeated drafting and help teams preserve approved language for security, legal, technical, and pricing sections.
• A proposal team should not be judged only by volume of responses. Win rate, qualification discipline, response quality, and margin quality are more useful metrics.
• A proposal that wins with poorly controlled discounts or vague delivery terms can create the same quote-to-cash problems as a weak standalone quote.
| Proposal metric | Why it matters |
|---|---|
| RFP win rate | Shows competitiveness and qualification quality |
| Response cycle time | Measures coordination and speed |
| Content reuse | Reduces repeated drafting and outdated answers |
| Compliance accuracy | Reduces disqualification and legal risk |
| Approval completion | Protects commercial and legal terms |
| Quote accuracy inside proposal | Prevents pricing and scope confusion |
| Win/loss reason | Improves future proposal and quote strategy |
• RFP win rate should always be reviewed with margin quality, because winning more bids through excessive discounts can make revenue look healthy while weakening profitability.
• Proposal revision count helps reveal whether late-stage changes come from buyer negotiation, pricing weakness, content gaps, or internal review delays.
• Compliance-response accuracy should be tracked because a missed requirement can disqualify a bid even when pricing is competitive.
• Proposal content reuse rate should be measured because approved content libraries reduce repeated drafting and reduce the risk of outdated legal, security, or pricing language.
• A bid/no-bid qualification rate is useful because responding to every RFP can inflate activity while lowering quality and seller capacity.
• If a team responds to 100 qualified RFPs, a 45% win rate means 45 wins; a 60% top-performer rate means 60 wins before deal size is considered.
• A 5-point gap between a 42% SMB benchmark and a 47% enterprise benchmark can represent a meaningful difference when annual bid volume is high.
• Enterprise RFP teams are often reported around 47% win rates, with mid-market teams around 45% and SMB teams around 42% in one benchmark set.
• Top-performing proposal teams are commonly benchmarked at 60% or higher win rates, which gives revenue leaders a useful quality target.
• Recent RFP benchmarks commonly place average win rate near 45%, up from 43% in some recent comparisons.
RFP performance and proposal operations benchmarks
The most useful proposal metrics connect commercial quality with operational readiness. A high win rate is not automatically healthy if the team wins by discounting too aggressively, accepting weak terms, or promising delivery scope that is hard to fulfill. Proposal management should therefore be tied back to quote governance and margin control.
AI, Guided Selling, and Predictive Quoting
AI is becoming part of quote management because quoting contains many repeatable but judgment-heavy tasks. Sales teams need to interpret buyer needs, select products or services, apply pricing rules, answer common proposal questions, route approvals, and produce language that fits the customer situation. AI can help with those tasks, but only when the underlying data is reliable.
• Reuters reported in February 2025 that Oracle added AI pricing features to NetSuite financial software.
• The same Reuters coverage described a NetSuite feature that can compile price quotes for complex purchases through a chatbot interface.
• Oracle’s AI quoting example focused on configurable purchases, which is one of the clearest use cases for guided quote creation.
• Salesforce’s recent sales-trends material connects non-selling work with quote creation and describes AI agents as a way to reduce administrative burden.
• Salesforce reports that 60% of sales rep time is spent on non-selling tasks, making quote automation part of a broader productivity discussion.
• Salesforce also notes that successful AI adoption depends on data quality; one State of Sales summary says 46% of sales professionals using AI agents report data quality issues hurting sales efforts.
• AI can draft quote language faster, but it cannot fix an outdated price book, unclear product rules, or missing approval policy by itself.
• Predictive quoting is strongest when historical win rates, discount behavior, buyer segment, product mix, and pricing outcomes are available as structured data.
• AI proposal assistants are useful when content libraries contain current, approved, and sourceable answers rather than old documents copied from prior deals.
• The risk is that AI can scale quote errors if pricing, scope, legal terms, or configuration data are wrong.
• A useful AI quote metric is manual override rate: if users override AI suggestions often, the model may be fast but not commercially reliable.
• AI-assisted quote creation should be evaluated through at least 4 controls: price-book accuracy, product-rule accuracy, approval-policy accuracy, and contract-language accuracy.
• Salesforce’s reported 46% data-accuracy or trust concern among sales professionals using AI agents is a reminder that quote automation depends on clean source data.
• Oracle said AI-generated outputs would be reviewed by humans before becoming final, which is an important control principle for pricing and quote language.
• Oracle examples included summarizing price negotiations, a use case directly connected to quote versioning and discount review.
• Reuters reported Oracle introduced more than 50 specialized generative AI features across business applications in 2024.
• Oracle also described a customer-intelligence agent that can pull records across business software categories, which matters when quote data lives in CRM, ERP, contract, and billing systems.
• Reuters reported that Oracle released AI agents for sales professionals in 2025, including tools that can update company records after meetings.
AI quoting controls and adoption signals
AI readout: AI can speed quoting, but only when pricing rules, product data, approval policies, and contract language are reliable. If the source data is weak, AI may simply produce quote errors faster. The best use case is controlled assistance: guided configuration, approved language, price recommendations, and exception routing that remain visible to the revenue team.
The near-term opportunity is not fully autonomous quoting for every deal. It is guided quoting for repeatable decisions. AI can suggest the right product bundle, identify missing fields, draft a proposal section, summarize prior customer requirements, flag unusual discounts, or recommend an approval path. Human review remains important because a quote is a commercial commitment, not just a generated document.
Regional and Enterprise Adoption Signals
Quote management adoption varies by company size, industry, sales complexity, and region. Large enterprises usually adopt earlier because they have more products, regions, approval layers, teams, and downstream systems. Smaller businesses may not need full CPQ immediately, but they still need controlled quote templates, accurate pricing, and clean handoff into invoices or contracts.
• Large enterprises are expected to hold 62.5% of quote management software market share in the Future Market Insights forecast.
• North America held 33.79% of the proposal management software market in the Fortune Business Insights benchmark.
• Europe CPQ software generated $947.7 million in 2025 according to Grand View Research’s regional outlook.
• The Europe CPQ market is projected to grow at 14.6% CAGR from 2026 to 2033.
• North America is repeatedly identified as a strong market for sales automation, proposal workflows, and enterprise revenue operations technology.
• Manufacturing quote workflows often require configuration controls, parts compatibility, product bundles, and engineering feasibility checks.
• SaaS quote workflows often require renewal terms, subscription dates, seat counts, usage logic, amendments, expansions, and billing alignment.
• Professional services quote workflows often require scope, rates, retainers, milestone billing, expenses, project assumptions, and client approval language.
• Global sellers need quote management that handles currency, tax, local payment terms, regional pricing, language, and country-specific legal wording.
• SMBs often need fewer advanced CPQ features, but they still benefit from faster quote generation, consistent pricing, and cleaner conversion from quote to invoice.
| Segment | Main quote-management need |
|---|---|
| Large enterprises | Approvals, complex pricing, integration, regional controls |
| Mid-market firms | Standardization, speed, fewer errors, CRM discipline |
| SMBs | Simple templates, faster quotes, payment readiness |
| Global sellers | Currency, tax, local terms, language, compliance |
| Manufacturers | Configuration, compatibility, bundles, product rules |
| SaaS companies | Renewals, expansions, amendments, subscription dates |
| Professional services | Scope, rates, retainers, milestones, expenses |
| Public-sector bidders | RFP compliance, approved language, bid evidence |
• Public-sector and regulated sellers should review compliance-response accuracy because an otherwise competitive proposal can fail on one missing requirement.
• Professional services firms should review scope-change frequency because quote language often controls whether extra work is billable or absorbed.
• SaaS firms should review renewal quote accuracy because one wrong term date, seat count, or discount can affect recurring revenue for 12 months or longer.
• Manufacturers should review configuration exception rate because one incorrect bundle can create engineering, fulfillment, and warranty cost.
• Large-enterprise share of 62.5% in quote management software should not be read as SMB irrelevance; it shows complexity leads adoption, while smaller firms often adopt simpler quote-to-invoice systems.
• North America’s 33.79% proposal software share indicates a mature market for structured proposal and bid-response workflows.
• A 14.6% Europe CPQ CAGR through 2033 suggests regional CPQ demand is growing quickly even when companies have different tax, language, and contract requirements.
• Future Market Insights identifies North America, Europe, and Asia-Pacific as key quote management growth regions, which suggests rollout priorities should be regional rather than one-size-fits-all.
Regional and segment benchmarks to use before rollout
The regional and segment pattern supports a practical conclusion: quote management should fit deal complexity. A small services firm may need a reliable quote-to-invoice workflow before it needs advanced CPQ. A global manufacturer may need rules-based configuration before it can safely speed up quote cycles. A government contractor may need proposal compliance controls before pure quote automation produces value.
Forecasting, Pipeline Quality, and Quote Version Control
Quote management also affects forecasting because a quote is one of the clearest signals that a deal has moved from interest to commercial negotiation. A CRM opportunity may show estimated value, but the quote shows the actual product mix, discount level, payment terms, contract length, and customer-facing offer. If quote data is inconsistent, pipeline reports can look precise while still hiding margin and fulfillment risk.
Version control is especially important in longer sales cycles. A buyer may ask for several revisions, stakeholders may negotiate different bundles, and managers may approve discounts in stages. If the system cannot show which quote version was approved and accepted, revenue teams may forecast one deal, legal may contract another, and finance may set up billing from a third.
Forecast signals quote teams should preserve
• Quoted amount before and after discounts, so pipeline value can be compared with expected margin.
• Quote status, expiration date, and accepted version, so stale offers do not inflate forecast confidence.
• Approval status and exception type, so managers can distinguish normal selling from policy pressure.
• Product mix, subscription term, service scope, and renewal assumptions, so finance can model revenue quality.
• Revision count and reason, so teams can see whether deals are changing because of buyer negotiation, internal errors, or unclear scope.
• Version-control maturity improves when every accepted quote has 1 system-approved final version tied to the contract, order, billing record, and CRM opportunity.
• Average quote value and median quote value should both be tracked because a few enterprise offers can distort the mean.
• Quote-to-close rate should be reviewed separately from quote volume because more sent quotes do not prove better selling if acceptance quality falls.
• Approval aging should be measured in hours or days so managers can see where quote momentum slows before the buyer receives the offer.
• Expired quote rate should be reviewed by rep, region, product family, and deal size because expiration can signal weak follow-up or pricing uncertainty.
• Revision count should be reviewed by reason: buyer negotiation, price correction, product change, legal change, scope clarification, or internal error.
• A 7-stage status model helps prevent stale quotes from inflating pipeline confidence.
• Quote status should separate draft, sent, revised, approved internally, accepted by buyer, expired, and converted-to-order stages.
Forecast and version-control benchmarks
Forecasting readout: Quote data is more specific than early-stage pipeline data. A strong quote-management process should therefore improve forecast quality, not only quote production speed. The most useful forecast is not simply larger; it is cleaner, better governed, and easier for finance to reconcile with the eventual contract and invoice.
Governance readout: Quote maturity is visible in downstream data. The best signal is not how many quotes a team sends. It is how many accepted quotes become clean contracts, accurate orders, correct invoices, and collectible revenue without avoidable repair work.
• If approval time falls but exception rate rises, the approval workflow may be too loose rather than more efficient.
• If win rate improves but average discount also rises, the sales result may be hiding margin pressure.
• If quote cycle time improves but billing correction rate rises, the process is getting faster without getting cleaner.
• A practical maturity scorecard should track quote cycle time, approval aging, manual price overrides, discount exceptions, quote error rate, contract mismatch, billing correction rate, and quote-to-cash leakage.
• Level 5 maturity connects quote, proposal, contract, billing, revenue recognition, and reporting so the accepted quote becomes the source of commercial truth.
• Level 4 maturity adds approval rules, price controls, revision history, and quote-to-contract handoff.
• Level 3 maturity connects CRM and quote creation so products, pricing, and customer data are at least partially synchronized.
• Level 2 maturity usually means teams have quote templates but still rely on manual price checks and email approvals.
• Level 1 maturity often means quotes are built manually in documents or spreadsheets and then copied into CRM, contracts, orders, or invoices.
Maturity signals leaders should measure
Quote management becomes more powerful when it is treated as a revenue operations maturity issue rather than a sales-document issue. The point is not only to make a quote look better. The point is to make the commercial offer measurable, approved, and usable by every team that touches the deal after the buyer says yes.
Revenue Operations Maturity and Quote Governance
Quote Workflow Diagnostic
A polished quote management benchmark should help a company decide where to look next. The most useful diagnostic model connects statistics to action: quote speed, pricing accuracy, approval friction, proposal quality, quote-to-cash handoff, tool fragmentation, and forecast reliability.
| Problem area | Core signals to measure | Useful benchmark angle |
|---|---|---|
| Quote speed | Time from request to sent quote; quote backlog | Sales time lost to admin work |
| Pricing accuracy | Manual changes, discount overrides, outdated prices | CPQ and pricing software growth |
| Approval friction | Approval cycle time, stalled quotes, escalation count | Reps chasing internal approvals |
| Proposal quality | RFP win rate, content reuse, compliance gaps | Proposal software growth and mid-40% win-rate benchmarks |
| Quote-to-cash leakage | Billing corrections, contract mismatch, missed fees | Revenue leakage benchmarks |
| Tool fragmentation | Duplicate entry, inconsistent CRM/contract/billing records | Sales and revenue operations tool burden |
| Forecast reliability | Quote stage accuracy, close probability, revision history | CRM and CPQ integration need |
This model prevents a common mistake: buying quote software before diagnosing the workflow. If the main problem is approval delay, the first fix may be approval rules. If the main problem is quote-to-contract mismatch, the fix may be integration and clause control. If the main problem is discount leakage, the fix may be price governance. The software matters, but the operating problem should define the implementation path.
90-Day Quote Management Benchmark Plan
Statistics become more useful when they turn into a measurement plan. A revenue team can review quote management in a 90-day cycle without attempting a full revenue-platform rebuild immediately.
| Timing | What to do | Output |
|---|---|---|
| Days 1-30 | Baseline quote cycle time, discount overrides, quote revisions, approval delays, proposal win rate, billing corrections, and contract mismatch cases. | Current-state quote workflow map |
| Days 31-60 | Fix high-confidence bottlenecks: price-book cleanup, approval thresholds, quote templates, required fields, proposal content, and CRM handoff. | Controlled workflow improvements |
| Days 61-90 | Review quote accuracy, quote-to-close rate, margin impact, billing corrections, and adoption by sales team. | Repeatable quote-management scorecard |
Planning principle: The goal is not to automate every quote immediately. The goal is to identify where quotes lose speed, accuracy, margin, or downstream reliability, then fix the bottlenecks with the clearest revenue impact.
A useful first review is to trace a sample of recent closed-won and closed-lost deals from quote request to final outcome. The team should check how many quotes were revised, where approvals stalled, which discounts needed exceptions, whether legal terms changed, whether billing needed correction, and whether the quoted offer matched what was ultimately delivered or invoiced. That exercise turns broad market statistics into a practical improvement list.
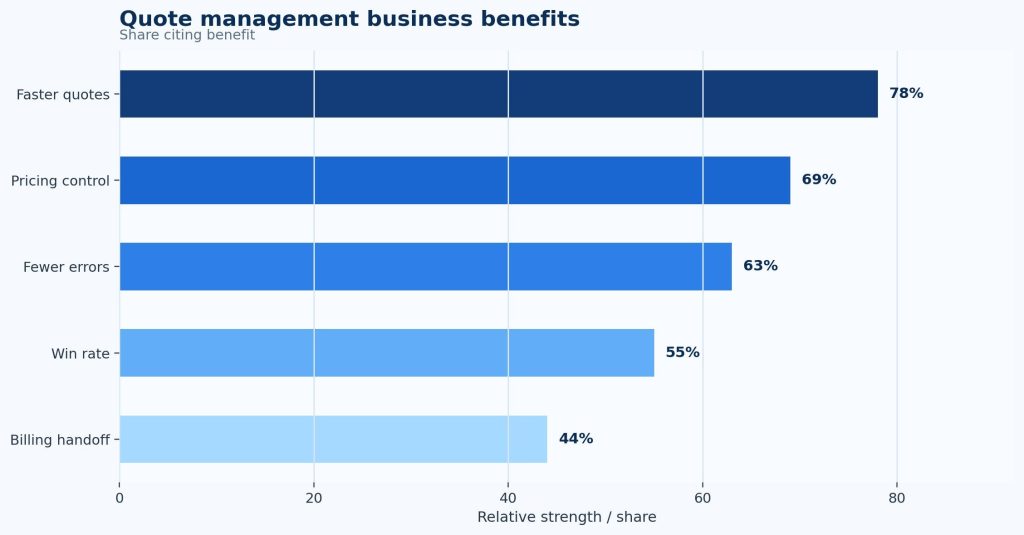
Figure 3. Quote management scorecards should connect sales speed, pricing control, approval quality, proposal performance, and quote-to-cash handoff rather than measuring quote volume alone.
Metrics Revenue Teams Should Track
A quote-management dashboard should not stop at the number of quotes sent. Volume can rise while quote quality falls. The strongest scorecards connect speed, accuracy, governance, buyer outcome, and downstream revenue reliability.
| Metric | Why it matters |
|---|---|
| Quote cycle time | Shows how fast buyers receive accurate offers |
| Quote approval time | Reveals internal friction and escalation bottlenecks |
| Quote error rate | Measures pricing, product, scope, and term accuracy |
| Discount override rate | Shows margin-control pressure |
| Average discount by rep or team | Reveals pricing behavior and approval discipline |
| Quote revision rate | Shows buyer confusion, internal mistakes, or scope uncertainty |
| Quote-to-close rate | Connects quote quality to sales outcome |
| RFP/proposal win rate | Tracks formal bid competitiveness |
| Contract mismatch rate | Measures quote-to-contract handoff quality |
| Billing correction rate | Shows quote-to-cash leakage |
| Revenue leakage indicators | Captures missed, underbilled, disputed, or delayed revenue |
| CRM/CPQ adoption | Shows whether teams use the process consistently |
The relationship between metrics matters more than any single number. Faster quote cycle time is not healthy if quote error rate rises. High win rate is not healthy if discounts are excessive. Low approval time is not healthy if policy exceptions are being skipped. A good scorecard shows whether the organization is producing quotes that are fast, accurate, profitable, and billable.
Revenue teams should also segment quote metrics. Enterprise quotes, SMB quotes, renewals, expansions, services quotes, product quotes, RFP responses, and international quotes may have different cycle times and error patterns. One blended average can hide the exact workflow that needs attention.
How Quote Management Changes by Business Model
Quote management software creates different value depending on what the company sells. A manufacturer, SaaS vendor, consulting firm, construction supplier, public-sector contractor, and marketplace service provider may all send quotes, but the quote risks are not the same.
Manufacturing and configurable products
Manufacturers often need CPQ because the sales offer depends on compatible components, product rules, engineering constraints, delivery timing, and price changes. A quote that includes an impossible configuration can create delivery delays even if the customer accepts quickly. In this model, guided selling and configuration validation are often more important than document design.
• Manufacturing quote governance should track configuration exception rate, engineering-review rate, accessory attach rate, and order correction rate.
• A quote bundle with 1 missing part can create fulfillment delay even when the price and customer name are correct.
SaaS, subscriptions, and recurring revenue
Subscription businesses need quote management that can handle seats, tiers, contract dates, usage assumptions, renewals, amendments, expansions, discounts, credits, and co-terming. The quote is closely tied to billing setup. If the quote and billing system do not align, the result can be wrong renewal amounts, missed usage charges, or customer disputes.
• Subscription quoting should track renewal quote accuracy, expansion quote conversion, amendment error rate, seat-count changes, and discount duration.
• A wrong renewal date can affect revenue timing for 12 months, which makes term data as important as the headline price.
Professional services and project-based work
Services firms need quote workflows that preserve scope, rates, assumptions, milestones, expenses, change-order rules, and approval language. The risk is often not product configuration but vague work boundaries. A weak quote can create unpaid scope creep or make an invoice harder to defend later.
• Services quoting should track scope revision count, milestone acceptance, retained-hours assumptions, expense treatment, and change-order conversion.
• A services quote with 3 unclear assumptions can create more billing friction than a product quote with a small price error.
RFP-heavy and public-sector selling
RFP-heavy teams need proposal controls as much as quote controls. Pricing tables, compliance responses, legal language, security answers, implementation assumptions, and references need to stay current and approved. The quote may be only one part of the response, but pricing and terms still determine whether a winning bid becomes a healthy contract.
• RFP-heavy teams should compare response volume, win rate, content reuse rate, compliance accuracy, and average margin on won bids.
• A team that improves win rate from 45% to 60% on 100 qualified bids gains 15 additional wins before deal size and profitability are considered.
Business-model readout: Quote management is healthiest when it is designed around the risk of the selling model. Product companies need configuration discipline. SaaS companies need billing alignment. Services firms need scope control. RFP-heavy teams need content governance and compliance accuracy.
Quote Management Software FAQ
What is quote management software?
Quote management software helps teams create, control, approve, send, and track customer quotes. Depending on the system, it can manage price books, products, services, discounts, approval rules, templates, tax details, currency, customer terms, proposal documents, and quote-to-cash handoff.
How is quote management different from CPQ?
Quote management is the broader workflow for preparing and managing quotes. CPQ, or configure-price-quote, is usually more advanced and focuses on complex product configuration, pricing logic, discount rules, and quote generation. Many CPQ systems include quote management, but simple quote tools may not include full CPQ logic.
Why does quote management matter for revenue teams?
Quote management matters because a quote is the first structured version of the deal. If pricing, discounts, scope, terms, or approvals are wrong at the quote stage, the problem can move into contracts, orders, invoices, collections, and revenue reporting.
What statistics show the quote management market is growing?
Future Market Insights projects quote management software to grow from $2.6 billion in 2025 to $12.2 billion by 2035. Grand View Research projects CPQ software to grow from $3.46 billion in 2025 to $10.89 billion by 2033. Proposal management software forecasts also show strong growth through the mid-2030s.
How does quote management reduce revenue leakage?
Quote management can reduce leakage by making sure approved prices, discounts, product details, service scope, terms, and billing information are captured before the customer accepts the quote. That makes it less likely that revenue is missed, underbilled, delayed, disputed, or lost during contract and billing handoff.
Which metrics should companies track first?
Start with quote cycle time, approval time, quote error rate, discount override rate, quote revision rate, quote-to-close rate, contract mismatch rate, billing correction rate, and revenue leakage indicators. These metrics show whether quote workflows are improving speed, accuracy, margin, and downstream reliability.
Final Takeaway
Quote management software statistics point to one practical conclusion: quoting has become a full revenue workflow. The quote is not just a customer-facing document. It is the commercial bridge between sales intent and operational execution. It carries the information that contracts, orders, billing, collections, delivery, and renewals will depend on later.
The market data shows strong investment in quote management, CPQ, proposal software, pricing optimization, CLM, and AI-assisted selling. The sales productivity data shows why teams want to reduce administrative quote work. The quote-to-cash data shows why finance cares about quote accuracy. The proposal and RFP data shows why formal bid teams need reusable content and governance. The forecasting data shows why quote versions, expiration dates, approvals, and discounts should be visible before the deal closes. Together, these statistics show that quote management should be judged by more than how fast a PDF can be produced.
For revenue leaders, the best next step is a workflow review. Measure how long quotes take, where approvals stall, how often quotes are revised, which discounts require exceptions, how often contracts or invoices need correction, and whether accepted quotes become clean billing records. The strongest systems do not simply make quotes look better. They make quotes faster, more accurate, easier to approve, easier to contract, and easier to bill without revenue leaking downstream.