Beverages are one of the highest-frequency consumer markets because they sit inside daily hydration, refreshment, energy, nutrition, alcohol, coffee, tea, foodservice, convenience retail, and premium occasions. A household may buy bottled water for utility, soft drinks for taste, coffee for ritual, energy drinks for performance, juice for nutrition, beer or wine for social occasions, and functional drinks for wellness. That range makes the beverage market broad, but it also makes it harder to read with one headline number.
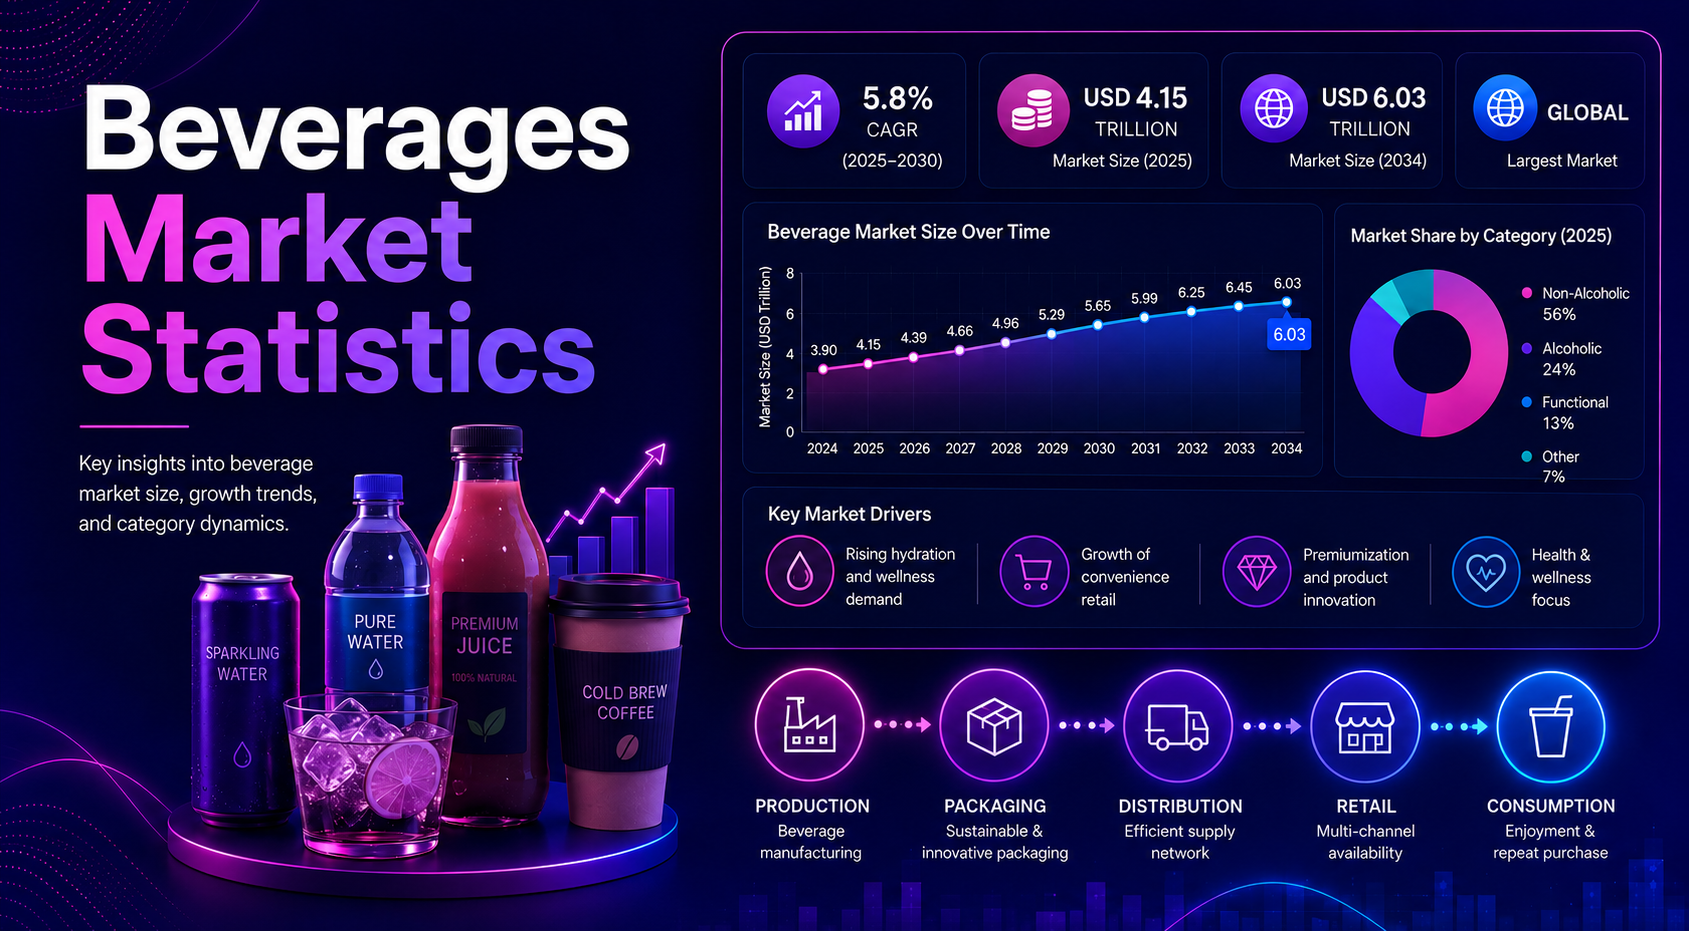
The strongest beverage statistics show a market operating at trillion-dollar scale. Global non-alcoholic drinks were estimated at USD 1.46 trillion in 2023, another non-alcoholic beverage forecast places the market at USD 1.44 trillion in 2025, and alcoholic beverages are forecast from USD 2.72 trillion in 2026 to more than USD 4.32 trillion by 2034. At the same time, smaller categories such as energy drinks, functional drinks, RTD beverages, specialty coffee, sports drinks, herbal tea, bubble tea, and non-alcoholic spirits show faster growth paths than many mature beverage formats.
Executive Beverage Market Benchmarks
The beverage market should be read first through executive benchmarks. These figures define the scale of the industry, but the more important point is how unevenly demand moves across categories. Alcoholic beverages, non-alcoholic beverages, bottled water, carbonated soft drinks, functional drinks, energy drinks, sports drinks, coffee, tea, juice, and RTD formats do not share the same growth drivers.
A useful beverage dashboard starts with the biggest market-size numbers and then separates them by consumer occasion. Hydration, energy, taste, ritual, wellness, moderation, social drinking, and meal pairing each create different demand patterns.
- Global non-alcoholic drinks were estimated at USD 1.46 trillion in 2023, with a forecast near USD 2.18 trillion by 2030.
- Another non-alcoholic beverage forecast places the market at USD 1.44 trillion in 2025 and USD 3.04 trillion by 2034.
- Alcoholic beverages are forecast from USD 2.72 trillion in 2026 to USD 4.33 trillion by 2034.
- RTD beverages are forecast from USD 847.69 billion in 2026 to USD 1.41 trillion by 2034.
- Energy drinks are estimated at USD 85.25 billion in 2025, with a forecast of USD 158.53 billion by 2033.
- Functional drinks are estimated at USD 164.68 billion in 2025, with a forecast of USD 315.89 billion by 2033.
- Carbonated soft drinks remain large at USD 285.35 billion in 2025, but their projected 3.5% CAGR is slower than energy and functional beverages.
- Sports drinks were estimated at USD 26.42 billion in 2024, with North America holding 35.93% of the category.
- Specialty coffee is estimated at USD 111.5 billion in 2025, with a projected 10.8% CAGR through 2033.
- Non-alcoholic spirits remain small at USD 445.8 million in 2024, but the projected 9.5% CAGR shows the momentum behind alcohol moderation.
| Metric | Latest value | Market meaning |
|---|---|---|
| Global non-alcoholic drinks | USD 1.46T in 2023 | Hydration and convenience make this a trillion-dollar market. |
| Non-alcoholic beverage forecast | USD 3.04T by 2034 | Growth is supported by health, RTD formats, and emerging-market demand. |
| Alcoholic beverages | USD 2.72T in 2026 to USD 4.33T by 2034 | Large category; growth differs by beer, wine, spirits, RTD, and low/no. |
| RTD beverages | USD 847.69B in 2026 | RTD convenience is reshaping both non-alcoholic and alcohol occasions. |
| Energy drinks | USD 85.25B in 2025 | Performance, caffeine, and convenience are supporting above-average growth. |
| Functional drinks | USD 164.68B in 2025 | Wellness claims are moving mainstream. |
Editorial readout
The beverage market should not be measured through one headline number. A useful market view separates category, channel, packaging, region, country, price tier, consumption occasion, and health positioning.
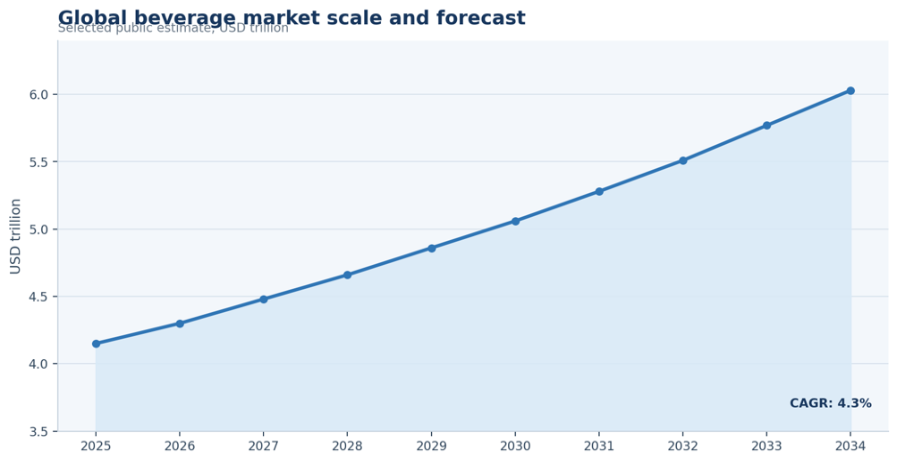
Figure 1. Beverage market scale should be read by category because alcoholic beverages, non-alcoholic beverages, RTD formats, coffee, functional drinks, and energy drinks follow different demand curves.
Beverages Market Size and Forecast
Beverage market estimates vary because different reports draw different boundaries. One forecast may include packaged non-alcoholic drinks at retail value, another may include broader beverage products, and another may focus only on alcoholic beverages, RTD formats, or a specific segment such as energy drinks or sports drinks. That is why the article should present a forecast range rather than force one number.
The market-size picture is clear even with those differences. Non-alcoholic beverages already operate at trillion-dollar scale, alcoholic beverages are larger in total value, and fast-growing subcategories are expanding because they attach beverages to clearer consumer use cases.
- Non-alcoholic drinks are projected to move from USD 1.46 trillion in 2023 to roughly USD 2.18 trillion by 2030 on one forecast path.
- A separate non-alcoholic beverage forecast shows growth from USD 1.44 trillion in 2025 to USD 3.04 trillion by 2034.
- Alcoholic beverages show a forecast path from USD 2.72 trillion in 2026 to USD 4.33 trillion by 2034, equal to a reported 5.95% CAGR.
- RTD beverages are forecast at USD 847.69 billion in 2026 and USD 1.41 trillion in 2034, reflecting a reported 6.6% CAGR.
- Energy drinks and functional drinks show stronger category-specific CAGR signals of 8.1% and 8.5%, respectively.
| Forecast path | Base value | Target value | CAGR / signal |
|---|---|---|---|
| Non-alcoholic drinks | USD 1.46T in 2023 | USD 2.18T by 2030 | Around 6% growth path |
| Non-alcoholic beverages | USD 1.44T in 2025 | USD 3.04T by 2034 | Around 8.61% forecast CAGR |
| Alcoholic beverages | USD 2.72T in 2026 | USD 4.33T by 2034 | Around 5.95% forecast CAGR |
| RTD beverages | USD 847.69B in 2026 | USD 1.41T by 2034 | Around 6.6% forecast CAGR |
| Energy drinks | USD 85.25B in 2025 | USD 158.53B by 2033 | Around 8.1% forecast CAGR |
| Functional drinks | USD 164.68B in 2025 | USD 315.89B by 2033 | Around 8.5% forecast CAGR |
Market sizing readout
Forecast spread is expected because beverage reports use different boundaries. The stronger interpretation is that beverages are a trillion-dollar global system where faster growth comes from RTD convenience, functional benefits, health positioning, premiumization, and emerging-market consumption.
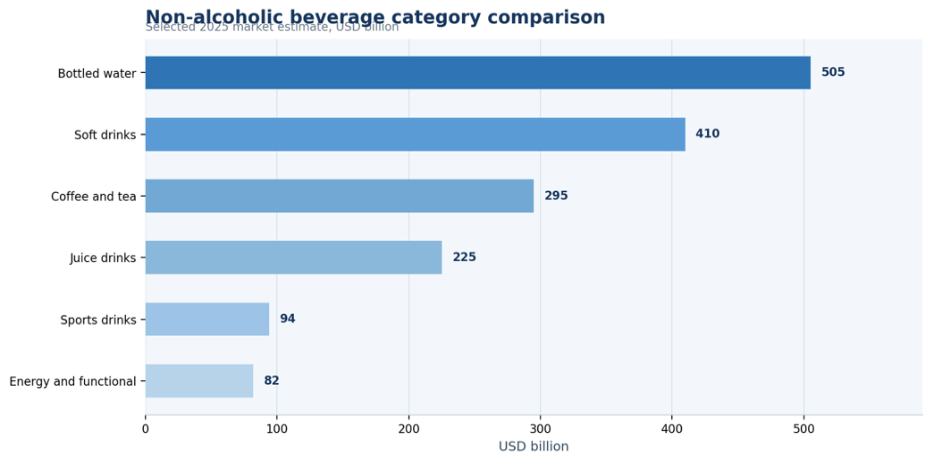
Figure 2. Forecast paths show that beverages remain large at the headline level, while category-specific growth paths vary by consumer occasion and format.
Why Beverages Now Carry Trillion-Dollar Consumer Stakes
Beverages carry unusually high consumer stakes because they are bought repeatedly and consumed across nearly every daypart. Water fits hydration and utility. Coffee and tea fit ritual and caffeine. Energy drinks fit focus and performance. Alcohol fits social and premium occasions. Juice, dairy, plant-based drinks, sports drinks, and functional beverages connect to nutrition, recovery, and wellness.
This frequency matters for operators. A small shift in repeat purchase, shelf availability, price per liter, or pack mix can produce large revenue effects. Beverage companies therefore need to understand not only what consumers drink, but why, where, when, and in which pack format.
| Market driver | Beverage signal | Why it matters |
|---|---|---|
| Hydration | Bottled water, flavored water. | Daily use; climate-sensitive demand. |
| Health and wellness | Low sugar, functional claims. | Shifts innovation toward ingredients and benefits. |
| Energy and performance | Energy drinks, coffee, sports drinks | Builds premium demand around caffeine, recovery, and focus. |
| Convenience | RTD coffee, RTD tea, chilled drinks. | Turns beverages into impulse and on-the-go purchases. |
| Foodservice | Coffee, alcohol, juices, soft drinks | Adds occasion value and premium pricing. |
| Premiumization | Specialty coffee, craft alcohol. | Moves growth from volume to value. |
| Moderation | Low/no alcohol, zero sugar | Shows consumers are changing formulas rather than leaving the category. |
Priority readout
Beverage growth comes from repeat occasions. The strongest segmentation is not only category; it is need state: hydration, energy, recovery, taste, wellness, social drinking, meal pairing, and indulgence.
Non-Alcoholic Beverage Market Statistics
Non-alcoholic beverages are the largest daily-consumption side of the beverage industry. They include bottled water, carbonated soft drinks, juice, coffee, tea, sports drinks, energy drinks, functional drinks, RTD formats, dairy beverages, plant-based beverages, flavored water, and fermented drinks.
The most important shift is that non-alcoholic beverages are no longer only about refreshment. Many products now compete through hydration, caffeine, wellness, low sugar, electrolytes, gut health, protein, clean label, and premium taste.
- The non-alcoholic drinks market was estimated at USD 1.46 trillion in 2023 and forecast at around USD 2.18 trillion by 2030.
- A broader non-alcoholic beverages forecast reaches USD 3.04 trillion by 2034 from USD 1.44 trillion in 2025.
- Carbonated soft drinks were estimated at USD 285.35 billion in 2025, still large but slower-growing than many functional categories.
- Functional drinks were estimated at USD 164.68 billion in 2025 and forecast at USD 315.89 billion by 2033.
- Energy drinks were estimated at USD 85.25 billion in 2025, with a forecast of USD 158.53 billion by 2033.
- Sports drinks were estimated at USD 26.42 billion in 2024, with North America worth about USD 9.49 billion in that category.
| Category | Key statistic | Market interpretation |
|---|---|---|
| Bottled water | Trillion-dollar non-alcoholic market. | Hydration and convenience support repeat demand. |
| Carbonated soft drinks | USD 285.35B in 2025 | Large and mature; growth depends on zero sugar, flavors, and brand power. |
| Energy drinks | USD 85.25B in 2025 | Higher growth as the category owns energy, focus, and performance occasions. |
| Sports drinks | USD 26.42B in 2024 | Hydration and recovery benefits extend the category beyond athletes. |
| Functional drinks | USD 164.68B in 2025 | Wellness claims are becoming mainstream beverage attributes. |
| RTD coffee and tea | RTD beverages forecast above USD 1.41T. | Convenience, cold-chain availability, and premium formats support growth. |
| Plant-based drinks | Wellness and dairy-alternative demand | Plant-based positioning works where health, sustainability, and diet overlap. |
Non-alcoholic readout
Non-alcoholic beverages are shifting from simple refreshment toward hydration, energy, wellness, lower sugar, and functional benefits. The winners are usually products that connect a clear drinking occasion with taste, convenience, and a credible benefit.
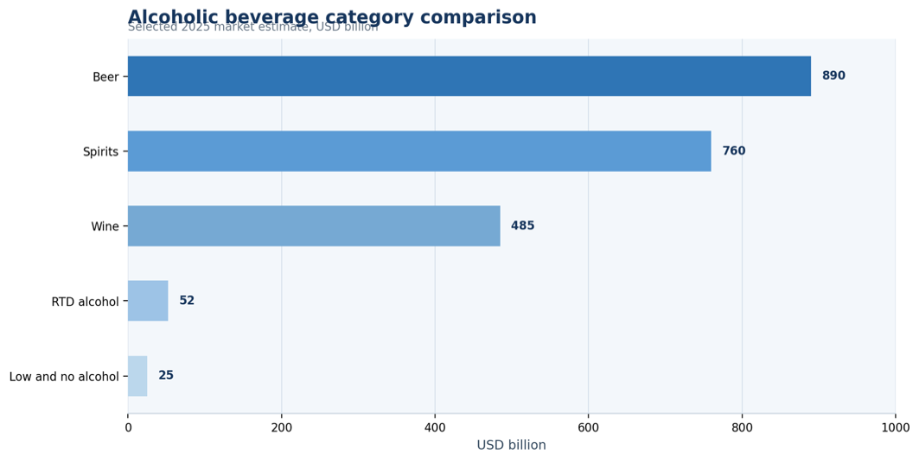
Figure 3. Non-alcoholic beverage category comparison shows why carbonated soft drinks still matter, while functional and energy categories carry stronger growth narratives.
Alcoholic Beverage Market Statistics
Alcohol remains one of the largest global beverage categories, but it is changing. Beer, wine, spirits, RTD alcohol, hard seltzers, premium spirits, and low/no-alcohol products each have different growth logic. The market is also shaped by tax, regulation, culture, income, on-premise demand, and moderation trends.
The most practical way to read alcohol statistics is to separate total value from volume, premiumization, regional drinking behavior, and low/no-alcohol substitution. A market can grow in value even when volume is pressured if consumers trade up to premium formats or more expensive occasions.
- Alcoholic beverages are forecast from USD 2.72 trillion in 2026 to USD 4.33 trillion by 2034.
- The forecast CAGR for alcoholic beverages is about 5.95% for 2026–2034.
- Global wine consumption was tracked at 214.2 million hectolitres in 2024 in the research workbook.
- The United States accounted for 33.3 million hectolitres of wine consumption in 2024, followed by France at 23.0 million hectolitres and Italy at 22.3 million hectolitres.
- Portugal had a high wine per-capita benchmark of 61.1 litres per capita among the major wine markets listed in the workbook.
- Non-alcoholic spirits were estimated at USD 445.8 million in 2024 and forecast at USD 771.9 million by 2030.
| Category | Key statistic | Market interpretation |
|---|---|---|
| Alcoholic beverages | USD 2.72T in 2026 | Large global value base across beer, wine, spirits, and RTD alcohol. |
| Wine consumption | 214.2M hectolitres in 2024 | Wine remains a major volume category with strong country-level variation. |
| United States wine | 33.3M hectolitres in 2024 | Largest country wine-consumption benchmark in the workbook. |
| France wine | 23.0M hectolitres in 2024 | Large mature wine market with cultural depth. |
| Italy wine | 22.3M hectolitres in 2024 | High consumption and premium positioning support market importance. |
| Non-alcoholic spirits | USD 445.8M in 2024 | Small base but strong moderation signal. |
Alcohol market readout
Alcohol remains a major global beverage category, but growth is uneven. Premiumization, RTD alcohol, and low/no-alcohol trends should be measured separately from total alcohol volume.
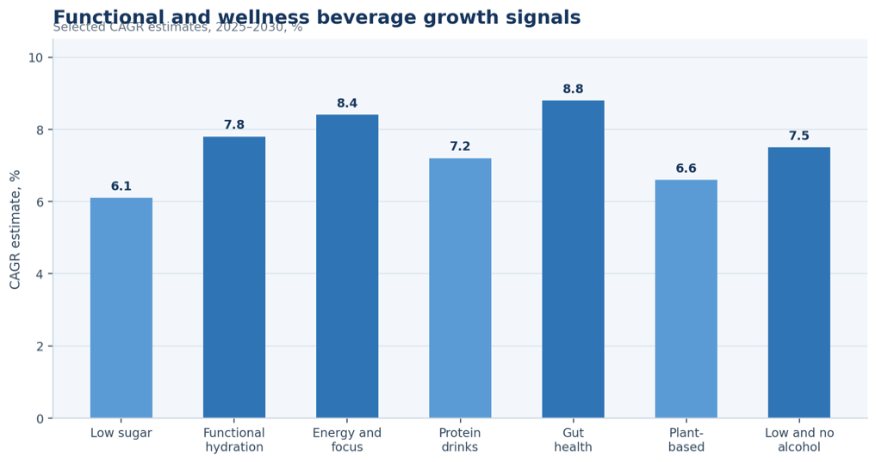
Figure 4. CAGR benchmarks show that specialty coffee, non-alcoholic spirits, functional drinks, energy drinks, and RTD beverages carry stronger growth signals than many mature categories.
Core Beverage Category Statistics
Core beverage categories should not be ranked only by size. Carbonated soft drinks, bottled water, juice, coffee, tea, energy drinks, sports drinks, dairy beverages, plant-based beverages, and RTD products all serve different needs. A beverage company deciding where to invest should compare category size with growth rate, margin, channel fit, packaging fit, and brand stretch.
Coffee and tea are especially important because they combine ritual, caffeine, culture, foodservice, and ready-to-drink convenience. Coffee also has a large supply-chain dimension, with Brazil, Vietnam, Colombia, and Ethiopia playing major production roles in the data set.
| Category | Main demand driver | Market signal |
|---|---|---|
| Carbonated soft drinks | Taste, brand loyalty, refreshment | USD 285.35B in 2025 with slower 3.5% forecast CAGR. |
| Bottled water | Hydration, convenience, hot-weather. | Core daily-use category inside the trillion-dollar non-alcoholic market. |
| Juice | Nutrition, flavor, breakfast and family. | Growth depends on health perception and sugar concerns. |
| Coffee | Ritual, caffeine, foodservice. | Coffee market estimated at USD 176.55B in 2025; foodservice coffee estimated. |
| Tea | Ritual, wellness, culture, low-calorie. | Tea estimated at USD 26.7B in 2025 and USD 39.4B by 2034. |
| Energy drinks | Performance, focus, convenience | Estimated at USD 85.25B in 2025 with 8.1% CAGR. |
| Sports drinks | Hydration, electrolytes, recovery | Estimated at USD 26.42B in 2024. |
| Functional beverages | Wellness, gut health, energy, hydration | Estimated at USD 164.68B in 2025. |
Category readout
Core beverage categories should not be ranked only by size. Bottled water competes on hydration, coffee and tea compete on ritual and caffeine, energy drinks compete on performance, and soft drinks compete on taste and brand loyalty.
Functional, Wellness, Low-Sugar, and Premium Beverage Trends
The modern beverage growth edge is increasingly functional. Consumers are not only asking whether a drink tastes good. They are asking whether it hydrates, provides energy, supports gut health, helps recovery, offers protein, reduces sugar, avoids alcohol, uses natural ingredients, or feels premium enough for the price.
This is why functional drinks, energy drinks, specialty coffee, herbal tea, non-alcoholic spirits, zero-sugar formats, and premium RTD products matter. These categories do not always dominate total market value, but they often shape innovation, shelf resets, marketing language, and acquisition interest.
| Trend | Consumer signal | Business impact |
|---|---|---|
| Low sugar / zero sugar | Consumers want taste with lower sugar. | Forces reformulation, sweetener innovation, and clearer labeling. |
| Functional hydration | Electrolytes and recovery benefits. | Supports premium water, sports drinks, and wellness RTD formats. |
| Energy and focus | Caffeine and performance remain strong. | Supports energy drinks, RTD coffee, and functional shots. |
| Gut health | Probiotics, kombucha, and fermented. | Creates higher-margin specialty segments. |
| Protein beverages | Consumers connect drinks with nutrition. | Supports dairy, plant-based, and fitness-positioned products. |
| Low/no alcohol | Moderation is growing without ending. | Creates new premium non-alcoholic occasions. |
| Premiumization | Consumers trade up for craft, origin. | Growth can come from value, not only volume. |
Trend readout
The strongest beverage innovations attach a product to a clear need state. Ingredients matter, but the selling point is usually hydration, energy, recovery, gut health, focus, relaxation, indulgence, or moderation.
Beverage Channels and Packaging
Beverage demand converts through channels and packaging. A beverage may be strong in supermarkets but weak in convenience stores, strong in foodservice but weak online, or strong in single-serve packs but weak in multipacks. Channel mix matters because beverages are heavy, often price-sensitive, and frequently bought cold for immediate consumption.
Packaging also shapes economics. PET bottles, aluminum cans, glass bottles, cartons, recycled PET, deposit systems, multipacks, and single-serve formats create different cost, sustainability, logistics, and brand-positioning outcomes. Beverage operators need to track pack mix as closely as category sales.
| Channel / packaging type | Key signal | Market meaning |
|---|---|---|
| Supermarkets and hypermarkets | Multipack value and household. | Important for volume, price comparison, and promotion management. |
| Convenience stores | Cold single-serve impulse occasions | Important for energy drinks, soft drinks, sports drinks, RTD coffee, and single-serve purchases. |
| Foodservice | Meal pairing, premium drinking, coffee. | Raises average ticket and builds occasion-based beverage demand. |
| On-premise alcohol | Bars, restaurants, hotels, events | Supports premium spirits, wine, beer, cocktails, and RTD alcohol. |
| E-commerce and quick commerce | Home delivery and rapid availability | Useful for bulky beverages, multipacks, and repeat replenishment. |
| PET bottles | Lightweight and scalable | Important for water and soft drinks, but exposed to sustainability pressure. |
| Aluminum cans | Portable, cold, recyclable image | Strong for energy drinks, soft drinks, beer, RTD alcohol, and sparkling formats. |
| Glass bottles | Premium and reusable perception | Useful for alcohol, premium soft drinks, mineral water, and hospitality. |
Channel readout
Beverage consumption is shaped by access. Convenience stores and quick commerce support impulse cold-drink occasions, supermarkets support multipack value, and foodservice supports social, premium, and meal-pairing occasions.
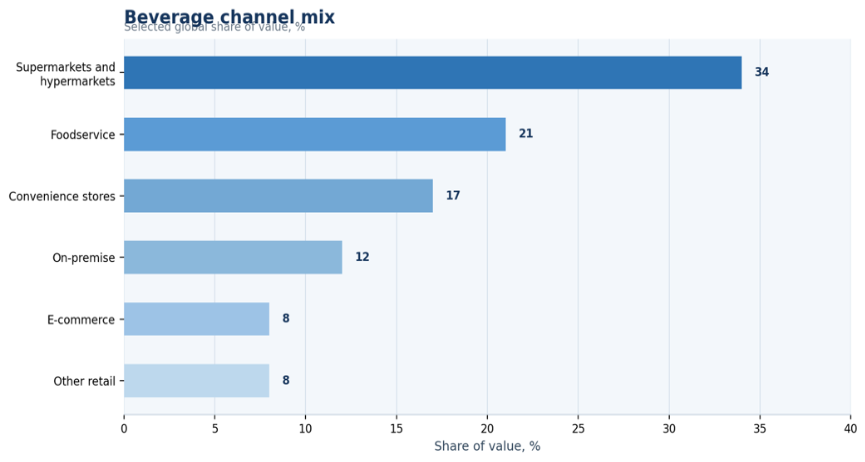
Figure 5. Channel and packaging decisions determine whether beverage demand turns into repeat purchase, impulse purchase, premium occasion, or replenishment behavior.
Regional Beverage Market Statistics
Regional beverage demand should be measured by climate, income, category maturity, regulation, retail structure, culture, and drinking occasions. North America, Europe, Asia-Pacific, Latin America, the Middle East and Africa, and Oceania all participate in the global beverage economy, but they do not grow through the same categories.
North America has strong bottled water, sports drink, energy drink, RTD coffee, functional beverage, and premium alcohol demand. Europe has strong bottled water, beer, wine, coffee, low/no-alcohol, and packaging-regulation pressure. Asia-Pacific has population scale, tea culture, dairy drinks, bottled water, RTD formats, functional drinks, coffee adoption, and income-led premiumization. Latin America is important for soft drinks, beer, bottled water, coffee, juice, and energy drinks. The Middle East and Africa show hydration, bottled water, juice, dairy beverages, energy drinks, and non-alcoholic alternatives, with alcohol rules varying sharply.
| Region | Key consumption signal | Market interpretation |
|---|---|---|
| North America | Non-alcoholic share of 21.71% in one. | Strong packaged beverage, convenience, energy, hydration, and category execution. |
| Europe | WHO European alcohol benchmark of 9.2. | Mature alcohol and bottled water markets, plus strong sustainability and packaging regulation. |
| Asia-Pacific | China, India, Japan, South Korea, Indonesia, Vietnam, and Australia drive a broad category mix. | Population scale and income growth create long-term growth runway. |
| Latin America | Brazil and Mexico anchor soft drinks. | Large urban populations and strong beverage culture support volume. |
| Middle East and Africa | Hydration, bottled water, juice, dairy drinks, energy drinks, and non-alcoholic alternatives. | Hot climate and alcohol rules shape the category mix. |
| Oceania | Premium alcohol, coffee, RTD drinks, bottled water, and health-led beverages. | Smaller population base but higher-value consumption occasions. |
Regional readout
Regional beverage demand should be measured by climate, income, category maturity, alcohol regulation, retail structure, health trends, and local drinking culture.
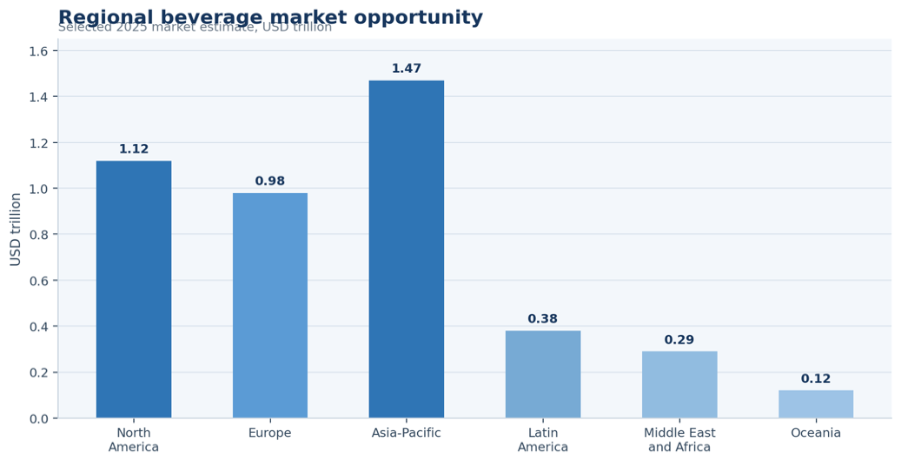
Figure 6. Regional beverage signals show how share, per-capita alcohol benchmarks, and category leadership differ by region.
Country-Level Beverage Market Statistics
Country-level analysis is where beverage statistics become more practical. A global category can look attractive, but the local opportunity depends on income, population, retail availability, climate, consumer habits, alcohol rules, channel structure, and cultural routines around coffee, tea, soft drinks, beer, wine, juice, bottled water, and energy drinks.
The beverage database includes specific country signals for wine consumption, coffee production and trade, tea production, UK energy drinks, Vietnam carbonated soft drinks and juice, China tea, India ranking signals, and U.S. non-alcoholic beer volume growth. These country signals help turn a global beverage narrative into a market-entry and category-priority view.
| Country | Demand driver | Beverage opportunity | Maturity signal |
|---|---|---|---|
| United States | Large consumer base, sports drinks, energy drinks, bottled water, and RTD coffee. | Wine consumption of 33.3M. | High maturity and high innovation intensity. |
| China | Tea culture, bottled water, dairy drinks, RTD formats, and premiumization. | China held 47% of world tea output. | Large scale with strong local habits. |
| India | Tea, dairy beverages, bottled water, energy drinks, and urban convenience. | India appears as a top alcoholic. | High growth runway across mainstream formats. |
| Brazil | Coffee, soft drinks, beer, bottled water, and energy drinks. | Coffee production forecast of 66.4M. | Major supply and consumption market. |
| Vietnam | Coffee supply, tea, RTD beverages, and carbonated soft drinks. | Carbonated soft drinks forecast. | Emerging growth market with category expansion. |
| United Kingdom | Energy drinks, juice, low/no alcohol, bottled water, and coffee. | UK energy drinks forecast from USD. | Mature but trend-sensitive market. |
| France | Wine, bottled water, coffee, and premium beverage culture. | Wine consumption of 23.0M. | Mature premium beverage culture. |
| Italy | Wine, coffee, bottled water, and premium drinking culture. | Wine consumption of 22.3M. | High cultural category depth. |
Country readout
Country-level opportunity should be ranked by population, income, retail access, climate, beverage culture, regulation, and category-specific habits. The strongest country section should explain not just what is large, but why that market behaves differently.
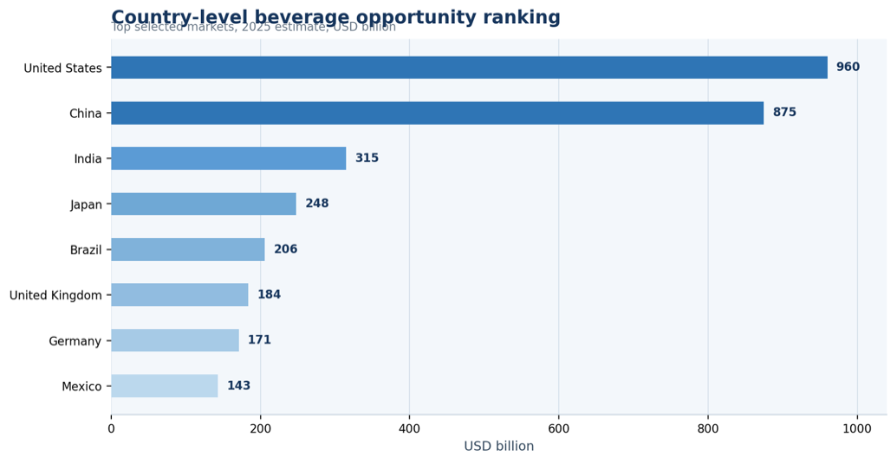
Figure 7. Country-level beverage opportunity is strongest where population, consumption habits, retail access, and category-specific demand align.
Company, Brand, and Category Competition Statistics
The beverage market rewards both scale and focus. Large companies compete through distribution, category portfolios, retail relationships, marketing budgets, sponsorships, bottling systems, and acquisition pipelines. Smaller brands often grow by owning a need state such as energy, gut health, hydration, protein, low sugar, premium taste, or alcohol moderation.
Competition is therefore different by category. Carbonated soft drinks are brand- and distribution-heavy. Bottled water depends on access, price, logistics, and trust. Energy drinks depend on lifestyle marketing and channel penetration. Coffee and tea depend on ritual, quality, origin, and convenience. Alcohol depends on regulation, premiumization, on-premise visibility, and brand storytelling.
| Company / category group | Market signal | Strategic role |
|---|---|---|
| Global soft drink companies | Large carbonated soft drink and packaged beverage portfolios. | Use scale, distribution, marketing, and reformulation to defend share. |
| Bottled water brands | Hydration and daily replenishment demand | Win through availability, price points, pack sizes, and trust. |
| Energy drink companies | Fast growth and lifestyle positioning | Compete through convenience, sponsorship, caffeine, and performance occasions. |
| Alcohol groups | Large global value base | Compete through premiumization, brand equity, channel control, and regulation. |
| Coffee and tea brands | Ritual plus RTD convenience | Blend quality, origin, foodservice, and cold RTD formats. |
| Functional beverage startups | Need-state ownership | Often lead innovation around gut health, electrolytes, adaptogens, focus, and hydration. |
| Private label | Retail value and affordability | Pressures branded pricing during inflation. |
Competition readout
Large beverage companies compete through scale, distribution, and brand portfolios. Smaller brands often win by owning a specific need state such as energy, gut health, hydration, low sugar, premium taste, or moderation.
Beverage Pricing and Margin Pressure
Beverage revenue can grow while margins remain under pressure. Ingredient costs, sweeteners, coffee and tea commodities, dairy inputs, alcohol inputs, aluminum, glass, PET and recycled PET, freight, energy, labor, cold chain, retail promotions, and pack-size changes can all affect profitability.
This matters because many beverage categories are competitive and promotion-sensitive. A company can report value growth from price increases while losing volume or retail share. The strongest operators therefore track price per litre pack mix, volume, premium share, input costs, promotional depth, channel mix, and gross margin together.
| Cost factor | Why it matters | Business response |
|---|---|---|
| Ingredients and sweeteners | Sugar, alternatives, flavors, dairy, coffee, tea, and alcohol inputs. | Use disciplined pricing and reformulation without weakening taste. |
| Aluminum cans | Important for energy drinks, beer, soft drinks, and RTD formats. | Track can cost, supplier risk, and pack profitability. |
| Glass bottles | Premium image, but heavier logistics and higher breakage exposure. | Reserve for premium, alcohol, mineral water, and hospitality formats. |
| PET and rPET | High-volume packaging base with cost and recycling pressure. | Balance cost, recycled content, and regulatory requirements. |
| Freight and energy | Beverages are heavy and costly to move. | Optimize network, pack size, palletization, and regional production. |
| Retail promotions | Promotions drive volume but can erode margin. | Track promotional lift, baseline sales, and post-promotion repeat. |
| Pack-size changes | Smaller packs can protect price points. | Monitor price per liter and shopper reaction. |
Margin readout
Beverage revenue can grow while margins weaken. The strongest operators track price per liter, pack mix, input costs, promotion intensity, channel mix, and premiumization together.
Health, Regulation, Sustainability, and Consumer Risk Factors
The beverage market is large, but it is exposed to health, regulation, sustainability, and consumer-trust risks. Sugar taxes, alcohol taxes, caffeine scrutiny, plastic packaging rules, deposit return systems, recycling targets, water stewardship, alcohol moderation, youth marketing rules, health warnings, and label transparency can reshape the economics of a category.
The key risk is not that consumers stop drinking beverages. The bigger risk is that demand migrates toward products that feel healthier, more transparent, more sustainable, better priced, or more convenient. Brands that do not adapt can lose shelf space and share even while the overall market grows.
| Risk area | Why it matters | Improvement path |
|---|---|---|
| Sugar regulation | Soft drinks, juices, energy drinks, and functional drinks face sugar scrutiny. | Reformulate, add zero-sugar choices, and improve serving-size clarity. |
| Alcohol regulation | Taxes, licensing, and marketing rules. | Segment by country and keep compliance central to market planning. |
| Caffeine scrutiny | Energy and focus drinks can face caffeine and youth-marketing scrutiny. | Use transparent labels and responsible positioning. |
| Plastic packaging | PET bottles face recycling, waste, and deposit-system pressure. | Increase recycled content, deposit-system readiness, and package redesign. |
| Water stewardship | Bottled water and beverage production. | Track water use, sourcing, replenishment, and local community risk. |
| Commodity volatility | Coffee, tea, sugar, aluminum, glass, PET, and freight costs can move quickly. | Use procurement strategy and portfolio pricing discipline. |
| Sustainability claims | Greenwashing risk can damage trust. | Support claims with measurable evidence and simple language. |
Risk interpretation
The biggest beverage risk is not that consumers stop drinking beverages. The bigger risk is that demand shifts toward healthier, more convenient, better-priced, more transparent, and more sustainable products.
Beverage Market Diagnostic
A diagnostic section turns the statistics into a scorecard. The useful question is not whether beverages are growing. The useful question is which beverage categories are growing profitably, in which channels, under which price points, with which packaging formats, and under which health, regulatory, and sustainability pressures.
| Problem area | Core signals to measure | Useful benchmark from this report |
|---|---|---|
| Category growth | Market value, CAGR, volume, repeat purchase, and household penetration. | Energy drinks at 8.1% CAGR and functional drinks at 8.5% CAGR show. |
| Volume versus value | Liters, units, price per liter, and premium mix. | Alcohol and coffee can grow in value even when volume is mixed. |
| Channel mix | Convenience, supermarket, foodservice, e-commerce, and quick commerce. | Channel affects impulse, replenishment, and premium occasions. |
| Health trend | Sugar, caffeine, functional claims, label rules, and moderation signals. | Non-alcoholic spirits at 9.5% CAGR show moderation demand. |
| Packaging pressure | PET, cans, glass, rPET, deposit systems | Packaging can drive both cost risk and sustainability risk. |
| Regional demand | Share, per-capita consumption, category mix, and local culture. | North America sports drink share of 35.93% shows regional category strength. |
| Country opportunity | Population, income, culture, retail access, regulation, and climate. | U.S., China, India, Brazil, Vietnam, UK, France, and Italy each require. |
Diagnostic readout
The useful question is not whether beverages are growing. It is which categories are growing profitably, in which channels, at what price tier, and under which health, regulatory, and packaging pressures.
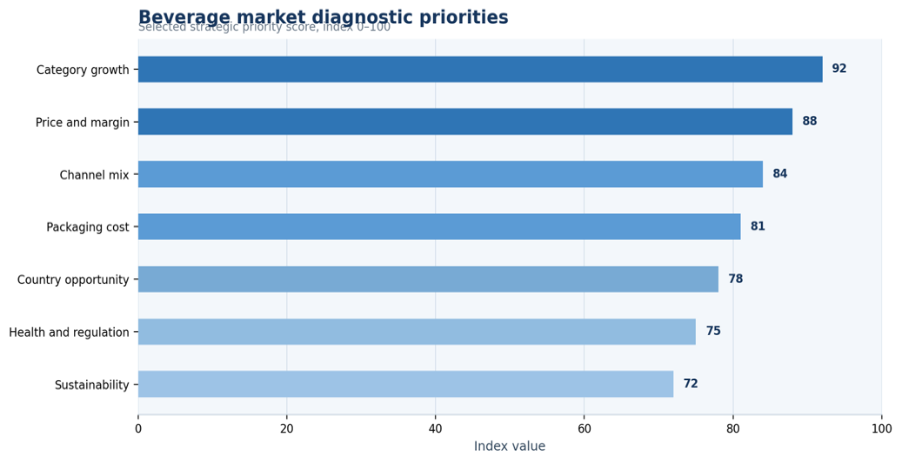
Figure 8. The beverage market diagnostic should prioritize category growth, price pressure, packaging risk, country opportunity, functional demand, moderation, and sustainability.
90-Day Beverage Market Research Plan
A 90-day research plan helps convert a large beverage statistics file into a decision dashboard. The plan should validate market-size ranges, rank categories, map countries, compare channels, review packaging risk, and turn the final findings into a practical scorecard.
| Timing | What to do | Output |
|---|---|---|
| Days 1–15 | Validate market-size forecasts across non-alcoholic, alcoholic, bottled water, energy drinks, and functional beverages. | Forecast range and category scope map. |
| Days 16–30 | Segment categories by hydration, energy, wellness, alcohol, coffee, tea, juice, RTD formats, and premium beverages. | Category opportunity map. |
| Days 31–45 | Map regional and country-level consumption signals. | Region and country priority list. |
| Days 46–60 | Review channel, packaging, pricing, and premiumization data. | Channel and packaging dashboard. |
| Days 61–75 | Compare regulation, sugar pressure, alcohol moderation, sustainability rules, and cost pressure. | Risk and compliance scorecard. |
| Days 76–90 | Build final market dashboard with category, region, country, channel, and margin metrics. | Beverage market decision dashboard. |
Planning principle
The best beverage research program does not chase one market-size number. It separates growth by category, occasion, channel, region, country, price tier, and consumer need state.
Metrics Beverage Leaders Should Track
A beverage dashboard should combine demand, price, margin, channel, packaging, and consumer trend metrics. Volume alone is not enough because value growth can come from price, mix, premiumization, or inflation. Similarly, a fast-growing category can still be risky if distribution, margins, packaging, or regulation are unfavorable.
| Metric | Why it matters |
|---|---|
| Category growth rate | Whether the category is expanding faster than the overall beverage market. |
| Volume growth | Separates real consumption growth from price-only value growth. |
| Value growth | Retail or market-value expansion. |
| Average selling price and price per liter | Tracks premiumization, inflation, and affordability pressure. |
| Channel mix | Whether growth comes from supermarket, convenience, foodservice, e-commerce, or quick commerce. |
| Pack-size mix | Affects margin, household value perception, and impulse demand. |
| Distribution points | Measures retail reach and execution. |
| Promotional lift | Whether discounting creates incremental sales or only pulls demand forward. |
| Gross margin | Connects revenue growth to profitability. |
| Sugar content trend | Tracks health and regulation exposure. |
| Packaging mix and recycled content | Tracks sustainability risk and compliance readiness. |
| Country-level growth | Finds markets where local behavior supports category expansion. |
Metrics readout
A useful beverage dashboard should combine demand, price, margin, channel, packaging, and consumer trend metrics. Volume alone is not enough.
How to Read Beverage Market Statistics Correctly
The beverage market is easy to overstate when every category is added together without checking scope. A non-alcoholic estimate may include packaged water, soft drinks, juices, RTD coffee, RTD tea, sports drinks, energy drinks, functional drinks, dairy beverages, and plant-based drinks, while an alcoholic estimate may include beer, wine, spirits, RTD alcohol, premium alcohol, and on-premise or off-premise value.
The safer reading is to compare like with like. Energy drinks belong with performance and caffeine occasions. Functional drinks belong with hydration, gut health, protein, and recovery occasions. Wine belongs with alcohol culture, income, foodservice, premiumization, and country-level drinking habits.
Value growth and volume growth also need to be separated. A beverage market can expand because shoppers buy more units, because prices rise, because premium products gain share, because pack sizes change, or because foodservice occasions recover. When inflation is high, value growth can look healthy even if underlying volume is weak.
Country comparisons require the same caution. The United States can be a large wine market by total consumption, while Portugal, Italy, and France may appear stronger on per-capita wine metrics. Brazil and Vietnam matter in coffee because of production and supply, while the United States and Europe matter heavily through imports and consumption. China matters for tea because of production, culture, and market share, while India matters through both tea and rising packaged beverage consumption.
Packaging statistics should be read as operating signals, not decoration. PET, aluminum cans, glass, cartons, multipacks, and recycled packaging affect shelf price, logistics, sustainability exposure, brand image, and retail execution. A beverage company can choose the right growth category and still lose margin if packaging cost, freight, deposit rules, or recycling obligations are not built into the plan.
The practical method is a stacked view: category size first, then growth rate, then channel fit, then country opportunity, then packaging and pricing pressure, then regulation and consumer-trend risk. This keeps the article close to the reference rhythm because every benchmark becomes a decision signal rather than a loose market fact.
| Reading issue | Why it matters | Reference-style interpretation |
|---|---|---|
| Mixed market scope | Headline totals can combine unlike categories. | Compare category families before comparing total value. |
| Value vs volume | Inflation can lift revenue without real consumption growth. | Separate unit growth, pricing, premiumization, and channel mix. |
| Country comparisons | Total demand and per-capita demand can tell different stories. | Read countries by population, income, climate, regulation, and habits. |
| Packaging pressure | PET, glass, cans, cartons, and rPET affect cost and margins. | Track pack type, freight, deposits, recycling rules, and retail execution. |
| Channel mix | Foodservice, convenience, supermarkets, and e-commerce convert demand differently. | Match each category to the buying occasion and route to market. |
Market reading rule:
Compare beverage statistics only within the same scope: category, value, volume, channel, country, packaging, and occasion.
Beverages Market Statistics FAQ
How big is the global beverages market?
The beverage market is measured at trillion-dollar scale. Non-alcoholic drinks were estimated at USD 1.46 trillion in 2023, while alcoholic beverages are forecast from USD 2.72 trillion in 2026 to USD 4.33 trillion by 2034.
How large is the non-alcoholic beverage market?
The workbook includes two major non-alcoholic benchmarks: USD 1.46 trillion in 2023 for non-alcoholic drinks and USD 1.44 trillion in 2025 for non-alcoholic beverages. One forecast reaches USD 3.04 trillion by 2034.
How large is the alcoholic beverage market?
Alcoholic beverages are forecast at USD 2.72 trillion in 2026 and USD 4.33 trillion by 2034. The category includes beer, wine, spirits, RTD alcohol, hard seltzers, premium alcohol, and low/no-alcohol alternatives.
Which beverage categories are growing fastest?
Specialty coffee, non-alcoholic spirits, functional drinks, energy drinks, and RTD beverages show some of the stronger CAGR signals in the workbook. Specialty coffee shows 10.8%, non-alcoholic spirits 9.5%, functional drinks 8.5%, and energy drinks 8.1%.
Which region leads the beverage market?
Leadership depends on category. North America has strong sports drink, energy drink, bottled water, RTD coffee, and functional beverage demand, while Europe remains important for alcohol, bottled water, coffee, wine, and low/no-alcohol products.
What is driving beverage market growth?
Growth is driven by hydration, convenience, energy, performance, health and wellness, premiumization, RTD formats, low sugar, alcohol moderation, and emerging-market income growth. Channel availability also matters because beverages are frequent and often impulse-driven purchases.
Are consumers shifting away from sugary drinks?
The data points to a shift toward lower sugar, zero sugar, functional claims, and healthier positioning. This does not mean sweetened beverages disappear; it means brands need more flexible formulas and clearer health positioning.
How important are functional beverages?
Functional drinks were estimated at USD 164.68 billion in 2025 and forecast at USD 315.89 billion by 2033. That makes functional positioning one of the most important beverage innovation themes.
What role does packaging play in beverage growth?
Packaging shapes cost, sustainability, logistics, channel fit, and consumer perception. PET bottles, cans, glass, cartons, multipacks, single-serve formats, and recycled packaging each create different market advantages and risks.
Which metrics matter most for beverage companies?
The most useful metrics are category growth, value growth, volume growth, price per liter, channel mix, pack-size mix, distribution points, promotional lift, gross margin, sugar content, packaging mix, and country-level growth.
Final Takeaway
Beverages remain one of the world’s largest consumer markets because they connect daily hydration, taste, energy, wellness, alcohol, convenience, foodservice, and premium occasions. The category is broad, but that breadth is also the reason it remains resilient: consumers do not use beverages for one need; they use them across many moments in the day.
The strongest growth is uneven. Bottled water, energy drinks, functional drinks, RTD coffee, low/no alcohol, and premium formats follow different paths from mature carbonated soft drinks, beer, wine, and traditional juice categories. Market size is useful, but category role, channel fit, price tier, packaging, and consumer need state explain the opportunity more clearly.
The best market reading combines category size, volume growth, value growth, channel mix, packaging, pricing, regulation, health trends, regional demand, and country-level consumption behavior. Beverage leaders that track all of those signals together will have a stronger view of where demand is growing, where margin is at risk, and where the next premium or functional opportunity may appear.