
United States solar energy is no longer an emerging power source. It is now one of the main systems reshaping electricity generation, utility investment, grid planning, state energy competition, storage deployment, manufacturing strategy, and household power economics. The market has moved from early adoption into national-scale infrastructure, which means the most useful statistics are not only about solar panels installed. They are about capacity, generation, project pipelines, state leadership, jobs, storage, domestic supply, policy stability, and grid access.
The strongest benchmarks show why the market deserves its own scorecard. SEIA’s national quick facts place U.S. installed solar capacity at 287.7 GWdc, solar and storage systems above 6.1 million, and solar and storage employment near 280,119 jobs. SEIA’s Q1 2026 market data also shows 7.8 GWdc of solar installed in one quarter, with solar representing 60% of new U.S. electricity-generating capacity added during that period. EIA data shows utility-scale solar generation reached 296,000 GWh in 2025, while small-scale solar reached 93,000 GWh.
Executive Solar Energy Benchmarks
These are the statistics that frame the U.S. solar market. They show the scale of the installed base, the pace of recent deployment, the role of solar in new power capacity, and the differences between utility-scale, residential, commercial, community, storage, and state-level growth.
The numbers that define the U.S. solar market
• The United States has 287.7 GWdc of installed solar capacity, making solar a national generation resource rather than a niche renewable category.
• More than 6.1 million solar and storage systems have been installed, showing that adoption now spans utility-scale plants, homes, commercial rooftops, community projects, and paired battery systems.
• The U.S. solar and storage market supports about 280,119 jobs, which makes solar a power-sector issue and a labor-market issue at the same time.
• Solar installed 7.8 GWdc in Q1 2026, even though quarterly installations were down 27% year over year and 42% quarter over quarter.
• Solar represented 60% of new U.S. electricity-generating capacity added in Q1 2026, while solar plus storage represented 91% of new capacity additions.
• Utility-scale solar installed 5.9 GWdc in Q1 2026, confirming that large projects remain the primary driver of quarterly deployment.
• Residential solar installed 1,179 MWdc in Q1 2026, growing 6% year over year but declining 15% from the prior quarter.
• Commercial solar installed 523 MWdc in Q1 2026, while community solar installed 247 MWdc during the same quarter.
• EIA reported 296,000 GWh of utility-scale solar generation in 2025, up 34% from the prior year.
• Small-scale solar generation reached 93,000 GWh in 2025, up 11%, showing that behind-the-meter generation still carries national-scale significance.
• California and Texas together account for more than 109 GWdc of installed solar capacity, making them the two largest state markets by a wide margin.
• Texas has 53,568 MWdc of installed solar capacity and 29,163 MWh of storage capacity, showing why the state has become a leading utility-scale solar and storage market.
• California has about 56,974 MWdc of installed solar capacity and 15,810 MWh of storage, showing both market maturity and deeper battery integration.
• The U.S. added 31.1 GWh of energy storage capacity in 2024 and reached 96 GWh of cumulative storage capacity, reinforcing the link between solar growth and flexibility resources.
Editorial readout
The headline statistics point to a market that should be measured through several systems at once: installed capacity, annual additions, electricity generation, state concentration, storage depth, jobs, manufacturing capacity, and project-delivery constraints. A solar market review that uses one blended capacity number will miss the operational story. The more useful approach is to separate utility-scale growth from residential adoption, state leadership from national totals, storage readiness from solar capacity, and policy support from interconnection reality.
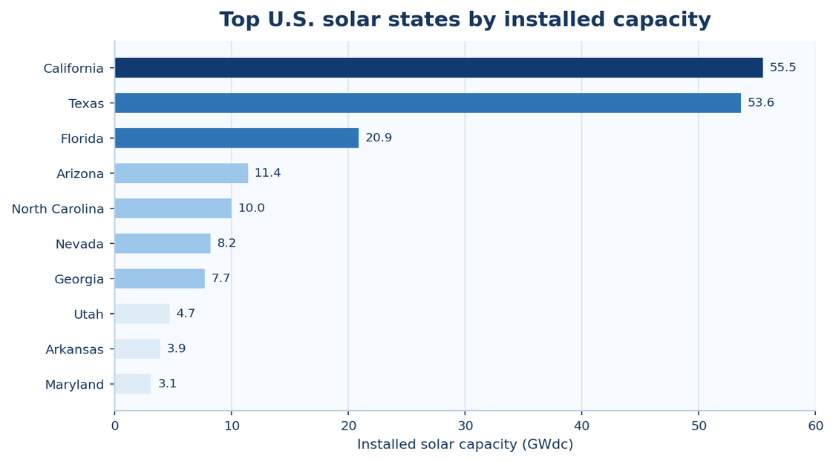
Figure 1. State-level solar capacity should be reviewed alongside national totals because U.S. solar deployment is concentrated in a small group of high-scale state markets.
Why Solar Now Carries U.S. Grid-Scale Stakes
Solar optimization matters more when electricity demand, power reliability, domestic manufacturing, and decarbonization targets all meet inside the same market. The U.S. solar industry is no longer judged only by whether panels are cheaper than they were a decade ago. It is judged by whether projects can interconnect, whether storage can shift output into evening peaks, whether supply chains can support growth, and whether state policy creates predictable customer economics.
The scale of the market changes the business case. A 1% improvement in project completion, approval rate, or interconnection timing becomes financially meaningful when cumulative installed solar capacity is measured in hundreds of gigawatts. Likewise, a small slowdown in large state markets such as California or Texas can affect national installation totals, supplier planning, installer employment, and power-sector forecasts.
This is why solar statistics should be interpreted as infrastructure signals. Installed capacity shows the existing base, new capacity additions show current momentum, generation output shows actual power-system contribution, storage capacity shows flexibility, and state rankings show where policy, land, solar resource, utility procurement, and demand conditions are combining most effectively.
Market-size and grid-growth benchmarks
• U.S. solar capacity has reached 287.7 GWdc, which is large enough to shape grid planning and state-level capacity competition.
• Solar accounted for 60% of new U.S. electricity capacity in Q1 2026, showing that solar remains central to new-generation planning.
• Solar plus storage accounted for 91% of new U.S. capacity in Q1 2026, showing that battery deployment is increasingly tied to renewable capacity additions.
• Utility-scale solar generation reached 296,000 GWh in 2025, up 34% year over year, making solar output visible in national electricity statistics.
• Small-scale solar reached 93,000 GWh in 2025, up 11%, confirming that distributed generation still adds meaningful output outside large power plants.
• The U.S. solar market now includes more than 6.1 million systems, which makes customer-side adoption an important complement to utility-scale growth.
Grid-scale interpretation
The market context changes the way solar should be discussed. Solar is not only a clean-energy category; it is a capacity resource, a grid-planning variable, a state economic-development tool, and a storage-growth driver. The most useful market reading compares solar capacity, solar generation, battery deployment, interconnection timing, and regional demand together rather than treating solar as a single national number.
U.S. Solar Capacity Growth
Capacity growth is the first layer of the U.S. solar story. Installed capacity shows the size of the existing fleet, while new annual and quarterly installations show whether the market is accelerating, slowing, or shifting between segments. A high cumulative capacity number proves that solar has matured, but current additions reveal whether developers, installers, manufacturers, utilities, and financiers are still adding new systems at a healthy pace.
The U.S. market is now large enough that quarterly movement matters. When solar installs 7.8 GWdc in one quarter, the number is not just a deployment statistic. It affects module demand, inverter demand, EPC workloads, grid studies, tax-credit monetization, storage procurement, and future generation forecasts. When the same quarter is down 27% year over year, the decline also matters because it signals pressure from policy transitions, financing, project timing, or interconnection delays.
Capacity should also be separated by market segment. Utility-scale solar produces the largest single block of additions, but residential solar determines household adoption, commercial solar reflects business economics, and community solar extends access to customers who cannot install rooftop systems. Treating all solar capacity as one market hides these differences.
Capacity-growth benchmarks
• U.S. installed solar capacity stands at 287.7 GWdc, which provides the market’s cumulative scale benchmark.
• Q1 2026 solar additions reached 7.8 GWdc, giving the market a recent deployment benchmark after a very strong prior buildout period.
• Utility-scale solar represented 5.9 GWdc of Q1 2026 additions, making it the largest near-term growth channel.
• Residential solar added 1,179 MWdc in Q1 2026, showing that home solar remains meaningful even when financing and policy conditions are uneven.
• Commercial solar added 523 MWdc in Q1 2026, while community solar added 247 MWdc.
• Solar and storage together represented 91% of new generating capacity in Q1 2026, indicating that the next growth cycle is increasingly paired with flexibility resources.
| Capacity signal | What to compare | Why it matters |
|---|---|---|
| Installed capacity | Cumulative GWdc by market and state | The size of the operating solar base. |
| Quarterly additions | New GWdc by segment | Current market momentum and slowdown risk. |
| Generation output | GWh from utility-scale and small-scale solar | How installed capacity becomes electricity supply. |
| Storage pairing | MWh and GWh attached to solar markets | Whether the grid can use more midday solar. |
| State concentration | Top state capacity and additions | Where growth is geographically concentrated. |
Utility-Scale Solar Market
Utility-scale solar is the main deployment engine in the United States. These projects are large enough to change regional capacity planning, utility procurement, wholesale power markets, and transmission needs. They also create the clearest link between solar statistics and grid-scale outcomes because a few large projects can move quarterly installation totals by gigawatts.
The segment’s strength comes from several advantages. Large projects can use lower-cost land, standardized equipment, contracted power sales, tax-credit structures, and increasingly battery storage. They also benefit from corporate clean-energy procurement and utility resource planning. However, utility-scale solar is also highly exposed to interconnection queues, transmission constraints, permitting timelines, procurement cycles, and tariff or supply-chain uncertainty.
For market analysis, the practical question is not only how much utility-scale capacity was installed. The better question is whether projects can move from announced pipeline to interconnection, construction, operation, and generation without long delays. A large development pipeline has less value if projects remain stuck in queues or face transmission limitations.
Utility-scale benchmarks
• Utility-scale solar installed 5.9 GWdc in Q1 2026, far above commercial and community solar additions.
• Utility-scale solar generation reached 296,000 GWh in 2025, up 34% from the prior year.
• Texas has become one of the strongest utility-scale solar markets because of land availability, power demand, competitive wholesale markets, and fast generation growth.
• California remains the largest cumulative solar market, but its growth story increasingly depends on storage, grid flexibility, and policy design.
• Utility-scale solar is the segment most directly affected by interconnection timelines because large projects must secure grid access before capacity can become generation.
| Utility-scale signal | What to measure | Why it matters |
|---|---|---|
| Annual GW additions | New utility-scale capacity | Project-delivery momentum. |
| Interconnection queue | Delays, withdrawals, grid-study timing | Whether projects can reach operation. |
| State pipeline | Projects by state and utility market | Where future growth is likely. |
| Storage pairing | Solar-plus-storage capacity | Flexibility and evening-peak readiness. |
| Generation output | Utility-scale solar GWh | Actual power-system contribution. |
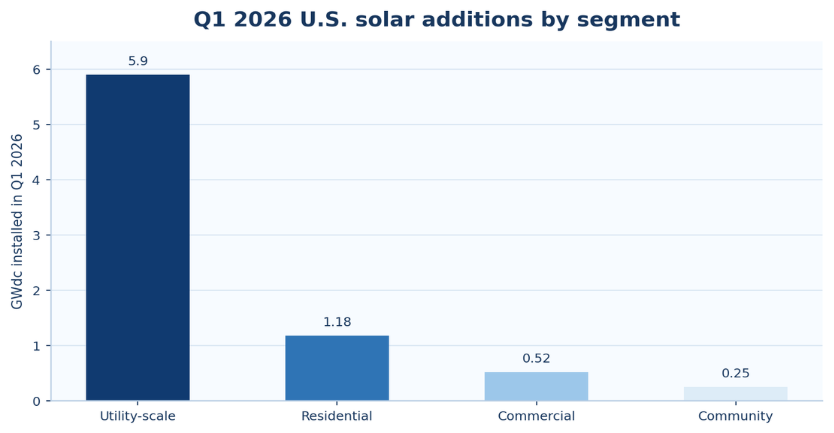
Figure 2. U.S. solar capacity additions show why utility-scale projects remain the main driver of new solar deployment while distributed segments still matter for customer adoption.
Residential Solar Market
Residential solar gives the U.S. market a different kind of signal. Utility-scale projects show grid growth, but residential systems show household adoption, consumer financing conditions, installer health, and state policy sensitivity. Rooftop adoption is affected by electricity rates, net-metering rules, battery attachment, tax credits, sales costs, interest rates, and homeowner confidence. That makes residential solar more exposed to consumer economics than large contracted projects.
The Q1 2026 numbers show this mixed position. Residential solar installed 1,179 MWdc and grew 6% year over year, but it also fell 15% quarter over quarter. That combination suggests the segment is still active, but not immune to short-term pressure. In mature states, changes to compensation rules can reshape project economics quickly. In emerging states, customer acquisition, installer trust, and financing remain key barriers.
Residential solar should be evaluated through more than installation volume. A strong residential market has healthy lead conversion, stable financing, good customer economics, low cancellation rates, reliable installation quality, and rising battery attachment where outages or time-of-use rates make storage attractive. A weak reading may appear first in quote-to-install conversion, project cancellations, or lower installer margins before it appears in national capacity totals.
Residential solar benchmarks
• Residential solar installed 1,179 MWdc in Q1 2026, keeping the segment above the 1 GW quarterly level.
• The residential segment grew 6% year over year in Q1 2026 but declined 15% from the prior quarter.
• More than 6.1 million solar and storage systems have been installed nationally, showing that distributed adoption is not limited to a few early markets.
• California remains the largest rooftop and solar-plus-storage market, but policy changes have shifted customer economics and increased the importance of battery attachment.
• High electricity rates, tax credits, backup-power demand, and time-of-use billing can support residential demand even when interest rates pressure financing.
Residential interpretation
Residential solar is best read as a consumer-finance and policy market. Capacity additions matter, but quote conversion, cancellation rates, customer payback, battery attachment, and installer margins often explain the trend earlier. A residential slowdown does not mean solar demand has disappeared; it may mean the project economics, financing terms, or state incentive design changed before customers were ready to commit.
Commercial and Community Solar
Commercial and community solar sit between utility-scale deployment and residential adoption. Commercial solar serves businesses, schools, farms, warehouses, public buildings, and institutions that want to reduce electricity costs or meet sustainability targets. Community solar serves customers who may not own suitable rooftops, including renters, multifamily residents, and small businesses that subscribe to a shared project.
These segments are smaller than utility-scale solar, but they are important because they broaden market access. A commercial rooftop project may not change national capacity totals in the way a utility-scale project does, but it can change operating costs for a school district, grocery chain, manufacturer, farm, or local government. Community solar can expand solar participation in markets where rooftop ownership, roof quality, credit, or upfront cost limits adoption.
The statistics show the relative scale. Commercial solar installed 523 MWdc in Q1 2026, while community solar installed 247 MWdc. Those numbers are lower than utility-scale and residential additions, but they give the market additional channels that are closely tied to state program design, subscription rules, retail electricity prices, tax-credit access, and local utility treatment.
| Segment | Main customer | Market implication |
|---|---|---|
| Commercial solar | Businesses, schools, farms, warehouses | Helps manage electricity costs and sustainability targets. |
| Community solar | Renters, shared subscribers, local customers | Expands access beyond rooftop ownership. |
| Industrial solar | Large facilities and energy buyers | Supports procurement and cost-control strategies. |
| Public-sector solar | Municipalities, schools, public buildings | Supports budget stability and public clean-energy goals. |
Segment rule
Commercial and community solar should not be judged only by total national capacity. Their value is often local: reducing electricity costs, supporting access, improving public-sector budgets, and creating state-level participation models. The best scorecard compares project volume, subscriber access, electricity-rate savings, program design, and customer retention together.
Solar Generation in the U.S. Electricity Mix
Installed capacity matters, but generation shows how that capacity becomes electricity. Solar generation is now visible enough in national power statistics that it must be tracked beside other major generation sources. The U.S. market is still not a solar-dominant grid, but the direction is clear: solar output is rising, utility-scale generation is growing faster than small-scale generation, and seasonal output patterns increasingly influence grid operations.
EIA data shows utility-scale solar generation reached 296,000 GWh in 2025, up 34% from the previous year. Small-scale solar generation reached 93,000 GWh, up 11%. The difference between these growth rates reflects the momentum of large projects, but the distributed figure remains material. Together, they show that solar is not just being installed; it is producing enough electricity to affect national and regional power balances.
Solar output is also seasonal. Generation is strongest during sunnier months and lower during winter months. That seasonal pattern is useful for summer daytime demand, but it also increases the importance of storage, transmission, demand response, and flexible resources that can manage evening peaks or periods when solar output declines.
Generation and output benchmarks
• Utility-scale solar generation reached 296,000 GWh in 2025, rising 34% from the prior year.
• Small-scale solar generation reached 93,000 GWh in 2025, rising 11% year over year.
• Solar’s generation role has grown from a small share of the U.S. electricity mix into a visible national power contributor.
• Monthly solar output is strongest in spring and summer, which makes storage and evening ramp management more important in high-solar regions.
• The spread between utility-scale and small-scale generation growth shows why national solar output depends heavily on large projects.
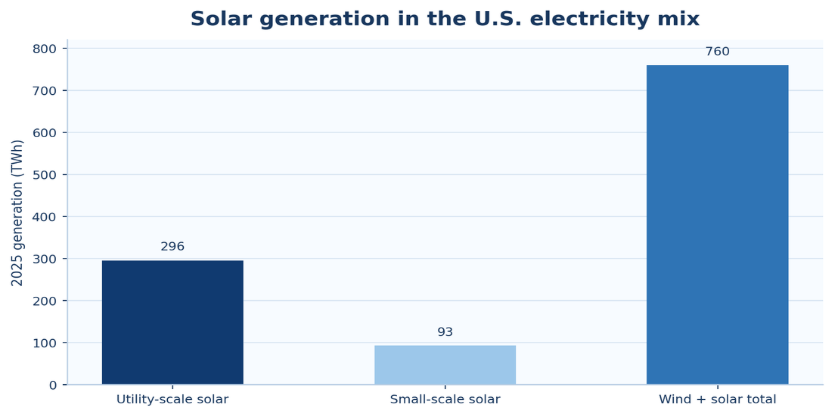
Figure 3. Solar generation in the U.S. electricity mix shows how installed capacity is becoming more visible in national power output.
State-by-State Solar Leadership
State-level analysis is one of the highest-value parts of a U.S. solar statistics report. National totals are important, but they hide the geographic concentration of capacity, storage, policy, and development activity. A state with strong solar resource, available land, supportive procurement, growing power demand, and workable interconnection rules can scale quickly. A state with strong demand but poor policy design or grid constraints can underperform its technical potential.
California and Texas define the top of the market, but they do so in different ways. California has the largest installed base and a mature solar-plus-storage ecosystem. Texas has become a fast-growing utility-scale solar and storage market linked to power demand, land availability, and competitive market dynamics. Florida, Arizona, North Carolina, Nevada, Georgia, and Virginia create the next tier, each with different combinations of solar resource, policy, utility procurement, land, and load growth.
A strong state-market reading separates capacity from momentum. California’s installed base is huge, but its future trajectory depends heavily on storage, grid operations, and customer economics. Texas has rapidly gained capacity, but its long-term performance depends on transmission, wholesale-market conditions, and project integration. Florida benefits from sunbelt demand and population growth, while Arizona and Nevada benefit from high solar resource and desert project economics.
State benchmarks worth separating
• California has about 56,974 MWdc of installed solar capacity, making it the largest state solar market by cumulative capacity.
• Texas has 53,568 MWdc of installed solar capacity, placing it close behind California and making it one of the most important growth markets.
• Florida has 20,936 MWdc of installed solar capacity, making it the largest solar market in the Southeast by scale.
• Arizona has 11,657 MWdc of installed solar capacity and strong solar resource conditions.
• North Carolina has 10,649 MWdc of installed solar capacity, showing the Southeast’s early utility-scale solar strength.
• Nevada has 9,829 MWdc of installed solar capacity and strong relevance for solar-plus-storage planning.
• Georgia has 9,353 MWdc of installed solar capacity, making it a significant Southeast market.
• Virginia has 8,409 MWdc of installed capacity, showing how solar growth extends beyond the sunniest states.
| State | Solar market signal | Why it matters |
|---|---|---|
| California | Largest installed solar base | Mature solar and storage market with policy sensitivity. |
| Texas | Fast utility-scale growth | Solar tied to power demand, land, storage, and wholesale-market dynamics. |
| Florida | Large sunbelt market | Strong long-term potential from population growth and electricity demand. |
| Arizona | High solar resource | Strong generation potential and desert project economics. |
| North Carolina | Established Southeast base | Early utility-scale solar maturity outside the West. |
| Nevada | Storage relevance | Solar economics align with battery and evening-peak needs. |
| Georgia | Growing Southeast capacity | Broader regional adoption beyond top two markets. |
State-market rule
The U.S. solar market should be analyzed by state, not only by national totals. State policy, utility procurement, interconnection speed, land availability, retail electricity prices, solar resource, and storage economics can produce very different outcomes. The same national incentive can generate very different deployment results depending on the state market where it is applied.
Solar Plus Storage
Solar plus storage is the clearest sign that the market is moving from simple capacity growth to grid integration. Solar produces heavily during daylight hours, but electricity demand often peaks later. Batteries help shift output, reduce curtailment, improve resource adequacy, support backup power, and make more solar usable in high-penetration markets. That is why storage has become a core market signal rather than an optional add-on.
The U.S. added 31.1 GWh of energy storage capacity in 2024 and reached 96 GWh of cumulative storage capacity. Those numbers matter because storage changes how solar is valued. In markets with high midday solar output, battery capacity can absorb excess generation and discharge during evening demand. In residential markets, batteries can support backup power and improve the economics of time-of-use rates. In utility markets, batteries can help solar projects compete as more flexible resources.
State-level storage data also changes the interpretation of solar leadership. Texas has 29,163 MWh of storage capacity, which is higher than California’s 15,810 MWh in the state fact-sheet data used for this article. That does not erase California’s solar leadership, but it does show why Texas is increasingly important in the solar-plus-storage discussion. Nevada, Florida, Arizona, and Georgia also show different storage-depth profiles compared with their solar capacity.
Storage benchmarks
• The U.S. added 31.1 GWh of energy storage capacity in 2024.
• Cumulative U.S. storage capacity reached 96 GWh, creating a larger flexibility base for solar and renewable integration.
• Texas has 29,163 MWh of storage capacity, showing how quickly storage has become central to high-growth solar markets.
• California has 15,810 MWh of storage capacity, reflecting its mature solar-plus-storage ecosystem.
• Florida has 3,197 MWh of storage capacity, while Arizona has 2,928 MWh and Nevada has 5,460 MWh.
• Solar plus storage represented a very large share of new capacity additions in Q1 2026, confirming the connection between renewable growth and flexibility resources.
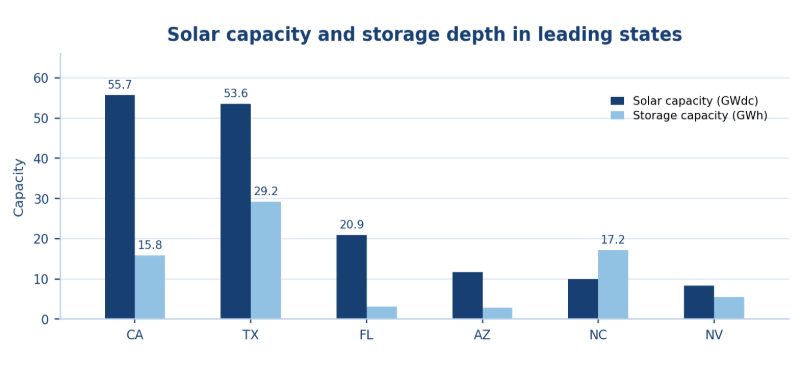
Figure 4. Solar-plus-storage depth shows why leading states should be measured by both solar scale and battery readiness.
Storage interpretation
Solar growth increasingly depends on storage because solar output and electricity demand do not always occur at the same time. Battery capacity helps convert daytime generation into flexible power that can support evening peaks, reliability needs, and customer backup. The strongest market reading compares solar MW, storage MWh, interconnection capacity, and local load shape together.
Manufacturing and Domestic Supply Chain
Manufacturing is now part of the U.S. solar market story because deployment scale creates supply-chain exposure. A solar project is not only a site, a developer, and a power contract. It also depends on modules, cells, wafers, inverters, trackers, racking, transformers, batteries, labor, and shipping. Domestic manufacturing capacity can reduce some exposure, but the depth of the supply chain matters. Module assembly alone is not the same as a fully domestic supply chain.
Federal incentives have encouraged factory announcements and domestic manufacturing expansion, but supply-chain resilience should be measured carefully. A strong module assembly base can help near-term supply, yet cell capacity, wafer capacity, polysilicon supply, inverter availability, transformer availability, and battery inputs also matter. A market can have strong installation demand and still face bottlenecks if critical components are delayed or expensive.
Manufacturing should be linked to deployment rather than discussed separately. If utility-scale projects grow quickly, demand rises for modules, inverters, trackers, EPC crews, interconnection equipment, and storage components. If residential solar slows, installer and equipment demand shifts. If trade rules or tariffs change, project economics and procurement timing can change even when solar demand remains strong.
| Supply-chain area | What to measure | Why it matters |
|---|---|---|
| Module capacity | Domestic assembly capacity | Near-term supply strength. |
| Cell capacity | U.S. cell production | Deeper supply-chain resilience. |
| Imports | Foreign supply dependence | Exposure to trade and logistics risk. |
| Inverters and transformers | Availability and lead times | Whether projects can move from procurement to operation. |
| Battery components | Storage supply and cost | Whether solar-plus-storage growth can scale. |
| Factory jobs | Manufacturing employment | Local economic-development impact. |
Manufacturing readout
Domestic manufacturing improves the solar market only when capacity, quality, cost, and delivery timing align with project demand. A strong manufacturing scorecard should track modules, cells, inverters, transformers, batteries, factory ramp timing, and project procurement risk. The practical question is whether supply can support deployment without raising project costs or delaying construction.
Jobs, Investment, and Market Ecosystem
Solar jobs and investment statistics show the economic footprint behind the capacity numbers. The U.S. solar and storage market supports about 280,119 jobs, but those jobs are spread across many activities: development, engineering, procurement, construction, sales, installation, operations, maintenance, manufacturing, finance, software, permitting, customer support, and grid services. The market is therefore broader than panel installation alone.
The job mix also changes by segment. Utility-scale solar creates demand for developers, EPC contractors, electrical workers, engineers, equipment suppliers, land teams, and long-term operations staff. Residential solar depends more on sales, customer acquisition, design, permitting, installation crews, electricians, and service teams. Manufacturing adds factory labor, quality control, logistics, and supply-chain roles. Storage adds battery-specific engineering, controls, safety, and system-integration work.
Investment follows these same channels. A large utility-scale project may require land, interconnection deposits, equipment procurement, financing, tax-credit structures, construction management, and long-term operations. Residential investment may depend more on loan rates, lease structures, dealer fees, battery bundles, and homeowner payback. For market leaders, the practical question is whether capital is flowing into profitable, financeable projects rather than only into announced pipeline.
Economic ecosystem benchmarks
• The U.S. solar and storage market supports about 280,119 jobs across multiple parts of the value chain.
• More than 6.1 million solar and storage systems create long-term operations, monitoring, service, and customer-support needs.
• Utility-scale growth supports large EPC and project-finance ecosystems, while residential solar supports local installer networks.
• Storage growth adds new roles in battery engineering, software controls, safety, procurement, and asset management.
• Manufacturing expansion can shift part of the employment story from installation into factory and supply-chain jobs.
Regional Solar Intelligence
Regional solar intelligence helps explain why the U.S. market does not behave as one uniform national market. The West has high solar penetration, mature policy experience, and storage needs. Texas and parts of the South show strong utility-scale growth. The Southeast includes large capacity markets but also state-by-state policy variation. The Northeast has less solar resource than the Southwest but often stronger rooftop, community solar, and policy-driven adoption. The Midwest is emerging through utility-scale projects, corporate procurement, and state policy changes.
Regional differences affect both economics and execution. A developer may prefer a region because of land availability and solar resource, but still face interconnection delays. A residential installer may prefer a state with high electricity rates, but customer economics can weaken if financing costs rise or export compensation changes. A manufacturer may target regions with incentives, labor supply, logistics access, and proximity to demand, but factory timing may not match project demand perfectly.
The strongest regional reading connects solar resource, state policy, load growth, utility procurement, interconnection conditions, storage economics, and customer economics. That prevents the article from treating all states as equal simply because they are inside the same national market.
| Region | Solar implication |
|---|---|
| West | Mature solar, storage, policy complexity, and grid-integration needs. |
| Texas and central South | Fast utility-scale growth linked to land, load growth, and competitive power markets. |
| Southeast | Large demand potential with state-by-state policy and utility differences. |
| Northeast | Smaller solar resource but strong rooftop, community solar, and policy-driven markets. |
| Midwest | Emerging utility-scale and corporate procurement opportunity. |
| Mountain and desert states | Strong solar resource and storage relevance, but transmission access matters. |
Regional readout
Regional solar data should be used as an operating map. The question is not which region is sunny in general. The better question is where solar resource, customer demand, interconnection capacity, land, policy, financing, and storage economics line up well enough to turn demand into completed projects.
United States in the Global Solar Market
The United States is one of the most important solar markets in the world, but it should be compared carefully with global leaders. China dominates global manufacturing and annual deployment scale, while Europe has strong distributed and policy-driven markets, and India continues to expand rapidly as power demand grows. The United States remains especially important because of its large electricity market, capital markets, utility procurement, tax-credit system, corporate clean-energy demand, and state-level market diversity.
The U.S. strength is not only installed capacity. It is the combination of demand scale, project finance, corporate buyers, storage growth, technology adoption, and policy support. The challenge is that deployment can be slowed by interconnection queues, transmission constraints, permitting, supply-chain uncertainty, trade policy, and local opposition. Global comparison therefore helps show both the opportunity and the execution gap.
the global section should not distract from U.S. details. Its role is to show that the United States is a large and sophisticated solar market, but not the only center of solar growth. Readers should use global comparisons to understand competitiveness, supply-chain exposure, and the importance of domestic manufacturing rather than to replace state-level U.S. analysis.
Country comparison signals
• China leads global solar manufacturing and annual deployment scale, which shapes module supply and global pricing dynamics.
• The United States remains one of the world’s largest solar markets because of electricity demand, finance capacity, corporate procurement, and utility-scale development.
• Europe remains important for distributed solar, policy design, and grid-integration lessons.
• India is a major growth market because of rising electricity demand and national renewable-energy targets.
• U.S. solar competitiveness depends on deployment speed, supply-chain resilience, storage growth, and grid access.
Policy, Interconnection, and Market Constraints
Policy and interconnection determine whether solar demand becomes operating capacity. Federal tax credits can improve project economics, but developers still need permits, grid studies, financing, equipment, labor, and utility approvals. Residential customers may qualify for incentives, but the final decision still depends on retail rates, net-metering or export compensation, financing terms, battery economics, and installer trust. Policy helps create the market, but execution determines the result.
Interconnection is one of the clearest constraints. A solar project can have land, customers, financing, and equipment but still fail to reach operation if grid access is delayed or too expensive. Transmission upgrades, queue reform, distribution capacity, and utility-study timelines therefore matter as much as headline demand. In high-growth regions, solar market statistics should be read beside interconnection queues and project completion rates.
Residential policy is also important. Net-metering reforms, time-of-use rates, export compensation, fixed charges, and battery incentives can change customer payback. When compensation declines, battery attachment may rise if customers can store more of their own generation. When interest rates rise, financed systems can become harder to sell even if electricity rates remain high.
Constraint benchmarks and signals
• Q1 2026 solar installations fell 27% year over year and 42% quarter over quarter, showing that deployment momentum can change quickly.
• Residential solar fell 15% quarter over quarter in Q1 2026, highlighting sensitivity to consumer economics and policy timing.
• Utility-scale projects remain exposed to interconnection queues, transmission upgrades, equipment timing, and permitting requirements.
• State policy changes can shift rooftop solar economics even when federal tax credits remain available.
• Storage incentives and time-of-use rates can increase battery attachment when solar export compensation changes.
Policy planning principle
The strongest solar markets usually combine strong demand, predictable incentives, available grid capacity, fast permitting, workable financing, and reliable project execution. Weakness in any one of those areas can slow deployment even when the solar resource is strong and national policy support is available.
U.S. Solar Market Diagnostic
A polished solar benchmark should help a team decide where to look next. The most useful structure is a diagnostic model that connects market statistics to operating questions. Each metric should answer whether the market is growing, where it is concentrated, what is slowing it, and which owner can act on the signal.
| Problem area | Core signals to measure | Useful benchmark |
|---|---|---|
| Grid interconnection | Queue delays, withdrawals, transmission access | Whether projects can reach operation. |
| Residential pressure | Installations, financing cost, policy changes | Whether household adoption is slowing. |
| Utility-scale expansion | GW additions, PPA activity, project pipeline | Where growth is strongest. |
| Storage attachment | Battery MWh, paired projects, backup adoption | Flexibility readiness. |
| Manufacturing | Factory capacity, imports, component availability | Supply-chain resilience. |
| State concentration | Capacity by state, growth by region | Where market leadership is concentrated. |
Diagnostic rule
The diagnostic model keeps the article from becoming a stat dump. Each number belongs to a business question: is the market large, is it still adding capacity, are the additions profitable, are projects reaching the grid, are customers still adopting, and is storage deep enough to support more solar?
90-Day Solar Benchmark Plan
Statistics become useful when they are translated into a repeatable review cycle. A 90-day solar benchmark plan gives utilities, developers, investors, manufacturers, and policy teams a practical way to turn public data into decisions.
| Timing | What to do | Output |
|---|---|---|
| Days 1-30 | Review national capacity, state rankings, generation share, and annual additions. | Clear solar market baseline. |
| Days 31-60 | Compare utility, residential, commercial, storage, and manufacturing data. | Segment-level opportunity map. |
| Days 61-90 | Review policy, grid, investment, and regional risk signals. | Practical solar market scorecard. |
Planning principle
The best solar teams do not chase every benchmark. They compare national statistics with their own project pipeline, state exposure, customer economics, interconnection status, and supplier risk. The priority should be the metric with the largest financial impact and the clearest owner.
Metrics Solar Leaders Should Track
The final scorecard should be detailed enough to locate the issue without becoming a vanity dashboard. These metrics are the minimum useful set for a mature U.S. solar market review.
| Metric | Why it matters |
|---|---|
| Installed solar capacity | Cumulative market scale. |
| Annual capacity additions | Current deployment momentum. |
| Solar share of generation | Power-system impact. |
| State capacity rankings | Geographic concentration. |
| Residential installations | Consumer-market health. |
| Utility-scale pipeline | Future project flow. |
| Storage capacity | Flexibility and reliability readiness. |
| Interconnection queue | Grid bottlenecks. |
| Solar jobs | Economic footprint. |
| Domestic manufacturing capacity | Supply-chain strength. |
United States Solar Energy Market Statistics FAQ
Common questions
• How big is the United States solar energy market?
The United States has about 287.7 GWdc of installed solar capacity and more than 6.1 million solar and storage systems. That makes solar a national-scale electricity market rather than a small renewable niche.
• Which U.S. state has the most solar capacity?
California remains the largest state solar market, with about 56,974 MWdc of installed solar capacity. Texas is close behind with 53,568 MWdc, making the top two states far larger than the next tier.
• Is Texas becoming a major solar market?
Yes. Texas has 53,568 MWdc of installed solar capacity and 29,163 MWh of storage capacity. Its growth reflects utility-scale project development, land availability, power demand, and stronger storage integration.
• What share of U.S. electricity comes from solar?
Solar now represents a visible and rising share of U.S. generation. EIA data shows utility-scale solar generation reached 296,000 GWh in 2025, while small-scale solar reached 93,000 GWh.
• Is residential solar still growing in the United States?
Residential solar remains important but more sensitive to financing and policy. The segment installed 1,179 MWdc in Q1 2026, up 6% year over year but down 15% quarter over quarter.
• Why is utility-scale solar important?
Utility-scale solar is the largest deployment channel. It installed 5.9 GWdc in Q1 2026, far more than commercial and community solar, and it drives much of the national solar generation increase.
• Why does battery storage matter for solar growth?
Storage helps shift solar output into evening demand and reduces grid-flexibility pressure. The U.S. added 31.1 GWh of storage capacity in 2024 and reached 96 GWh of cumulative storage capacity.
• How many people work in the U.S. solar industry?
The U.S. solar and storage market supports about 280,119 jobs. Those jobs include installation, development, construction, manufacturing, operations, maintenance, finance, customer support, and storage integration.
• What are the biggest challenges for U.S. solar growth?
The main challenges are interconnection queues, transmission limits, permitting, residential financing pressure, supply-chain uncertainty, labor availability, and policy changes. These constraints can slow deployment even when demand remains strong.
• What is the future outlook for the U.S. solar market?
The outlook remains large but uneven. Solar growth will depend on utility-scale project completion, state-market policy, residential customer economics, storage deployment, domestic supply, and the ability to connect projects to the grid.
Final Takeaway
United States solar energy market statistics point to one clear conclusion: solar is now a national-scale power, investment, and infrastructure market. Installed capacity has reached 287.7 GWdc, solar and storage systems exceed 6.1 million, and solar represented 60% of new U.S. generating capacity in Q1 2026. Those numbers show that solar is no longer a side category inside the electricity system. It is one of the main sources of new capacity and one of the clearest indicators of how the grid is changing.
The strongest reading is by segment and state. Utility-scale solar remains the main growth engine, residential solar shows consumer and policy sensitivity, commercial and community solar broaden market access, and storage turns solar from a daytime resource into a more flexible grid asset. California and Texas dominate installed capacity, but Florida, Arizona, North Carolina, Nevada, Georgia, Virginia, and other state markets show why national averages are not enough. The market is large, but it is not uniform.
For solar leaders, the practical test is whether demand can be converted into completed, interconnected, financeable, and reliable projects. Use the statistics as a scorecard: compare capacity additions, state rankings, generation share, storage depth, interconnection status, policy stability, residential economics, manufacturing capacity, and workforce availability. If demand grows while projects slow, the issue is not interest in solar; it is execution, grid access, financing, or market design.