A practical statistics report on billable hours, realization, collections, PSA software, e-invoicing, late payments, regional adoption, and the financial controls that help consulting, legal, accounting, IT services, design, engineering, and advisory firms turn work into cash.
Professional services billing is not just invoice formatting. It is the point where expertise, scope, utilization, rates, project delivery, approval rules, and collections all become measurable. A firm can win valuable clients and still lose margin if time is not captured, if write-downs are high, if partners delay approvals, if invoices create disputes, or if clients pay slowly after the work is complete.
A stronger way to read this topic is as a revenue-control problem. Professional services firms rarely lose money in one dramatic moment. They lose it through small repeated gaps: a consultant enters time late, a project manager accepts extra work without a change order, a partner writes down a bill before the client sees it, or finance sends an invoice that lacks the detail needed for approval. None of those problems looks large alone, but together they decide whether delivered expertise becomes collectible revenue.
The most useful statistics in this category connect three layers: the size of the professional services and software markets, the operating benchmarks that show where revenue leaks, and the regional payment and compliance trends that change how firms bill clients. This article uses curated benchmarks rather than a raw stat dump, with short interpretation blocks after dense sections so the numbers stay useful for planning.
For this topic, depth comes from connecting the statistics rather than stacking them. A PSA market forecast is useful, but it becomes more meaningful when it is read alongside utilization, realization, DSO, bad-debt, e-invoicing, and compliance data. The combined picture shows why many firms are modernizing the full quote-to-cash or project-to-cash chain instead of buying a narrow invoice tool.
The strongest billing teams usually treat invoice creation as the last visible step in a much longer operating system. They standardize scope language, protect rate cards, capture time earlier, review work-in-progress before month end, attach the right evidence to invoices, and monitor payment behavior after the bill is sent. That broader lens is what turns billing statistics into management guidance rather than isolated software numbers.
Headline Professional Services Billing Statistics
These headline numbers show why billing has become a strategy issue for service firms. The market is large, software spending is growing, utilization remains under pressure, and late payments continue to affect cash flow even after work has been delivered.
• The global professional services market is valued around $5.9 trillion in 2025 and is projected to reach about $9.3 trillion by 2034, according to one long-range outlook.
• Another professional services forecast expects the market to add about $1.94 trillion from 2026 to 2030, with a projected 4.9% CAGR.
• Professional services automation software was estimated at $12.40 billion in 2024 and projected to reach $40.25 billion by 2033.
• An alternate PSA forecast values the market at $14.46 billion in 2025 and projects it to reach $50.51 billion by 2034.
• Billing and invoicing software is projected to grow from $7.4 billion in 2025 to $18.9 billion by 2034.
• The time-tracking software market was valued at $7.13 billion in 2024 and projected to reach $29.88 billion by 2033.
• The global e-invoicing market has estimates ranging from $7.97 billion in 2024 to $18.5 billion in 2025, depending on market definition.
• One e-invoicing outlook projects the market at $70.3 billion by 2034, while another projects $62.68 billion by 2031.
• Rocketlane/SPI reports employee billable utilization falling to 66.4% in 2025, which is 3.6 percentage points below SPI’s 70% minimum healthy benchmark.
• A 2024 professional services maturity benchmark reported employee billable utilization at 69.3%.
• Legal billing benchmarks show average law-firm utilization around 38%, or about 3.0 billable hours in an eight-hour day.
• Legal realization around 88% means about 12% of captured billable value does not convert to invoiced or collected value at full rate.
• North American B2B payment data shows 64% of sales transacted on credit and payment terms around 43 days from invoicing.
• Overdue invoices affect about 38% of North American credit-based B2B sales, while 4% are written off as bad debt.
• UK B2B payment data places overdue invoices at 51% of invoices and bad debts at 7%.
• Central and Eastern Europe payment data shows overdue invoices averaging 53% of credit B2B sales and bad debts at 8%.
• The EU estimates that e-invoicing and digital reporting reforms could reduce VAT fraud by up to EUR 11 billion per year and cut administrative and compliance costs by more than EUR 4.1 billion per year.
• North America captured 37.74% of PSA software revenue in 2025, while Europe accounted for 22.7% of global PSA software revenue in another benchmark.
• Asia-Pacific PSA software generated $2.66 billion in 2024 and is expected to grow at a 16.8% CAGR from 2025 to 2033.
• Workday/SPI benchmark data reports that the most mature Level 5 firms achieved a 71% improvement in billable utilization over Level 1 organizations.
The headline pattern is clear: service firms are not buying billing systems only to send cleaner invoices. They are buying operating visibility. The commercial question is whether each hour, project milestone, expense, retainer, and client approval can move through the revenue cycle with less leakage and less manual correction.
The headline numbers also explain why billing performance cannot be judged by revenue growth alone. A consulting firm can grow revenue while quietly losing margin through poor staffing, late time entry, discounting, or slow collections. A law firm can increase billed value while still underperforming if realization and collection do not move with it. A creative or IT services agency can win more retainers but still create cash pressure if scope changes are not documented before the invoice is issued.
That is why the most valuable statistics in the rest of the article are not only the biggest market-size figures. They are the operating benchmarks that reveal where value leaks between work performed and cash collected. Utilization, realization, invoice accuracy, approval time, DSO, write-offs, and dispute frequency are the metrics that make billing software financially relevant.
Market Size and Future Outlook
Professional services billing sits inside a very large services economy, but its software categories grow faster than the underlying market. That gap matters. It suggests firms are investing in systems that connect staffing, delivery, timekeeping, invoicing, revenue recognition, collections, and reporting because manual processes are no longer enough for complex client work.
Professional services and PSA software growth
• Professional services are a multi-trillion-dollar category, with one outlook placing the market at $5.9 trillion in 2025 and $9.3 trillion by 2034.
• The projected professional services market CAGR of 5.2% through 2034 is moderate compared with the double-digit outlook for PSA software.
• PSA software rising from $12.40 billion to $40.25 billion implies more than 3x growth over the forecast period.
• Grand View Research projects PSA software CAGR at 14.7% from 2025 to 2033.
• Fortune Business Insights projects PSA software growth from $16.61 billion in 2026 to $50.51 billion by 2034, with a 14.91% CAGR.
• Persistence Market Research projects PSA software at $15.0 billion in 2026 and $32.5 billion by 2033.
• Project and resource management led PSA software functionality modules with 34.28% share in 2025.
• IT and telecom held 26.35% of PSA software revenue by end-user industry in 2025.
• Consulting and advisory is projected to post the highest PSA end-user CAGR at 13.74% through 2031.
• Business analytics and reporting is advancing fastest among PSA modules, with a projected 15.21% CAGR through 2031.
Billing, invoicing, time tracking, and e-invoicing markets
• Billing and invoicing software is projected to reach $18.9 billion by 2034 after starting from $7.4 billion in 2025.
• That billing and invoicing forecast implies about 2.55x growth over the period.
• Legal billing software is estimated around $2.15 billion and expected to reach $4.28 billion, nearly doubling under that market definition.
• Legal practice management software was valued at $4.8 billion and projected to reach $10.9 billion.
• Time-tracking software moving from $7.13 billion to $29.88 billion implies more than 4x growth by 2033.
• Global e-invoicing market estimates vary, but several forecasts cluster around strong double-digit growth, including 15.96%, 17.1%, and 22.4% CAGR estimates from different research firms.
• One e-invoicing estimate projects the market from $18.5 billion in 2025 to $70.3 billion by 2034.
• Another e-invoicing estimate projects growth from $12.47 billion in 2023 to $62.68 billion by 2031.
• Maximize Market Research estimates e-invoicing at $16.37 billion in 2025 and nearly $44.63 billion by 2032.
These market estimates use different boundaries, so they should not be compared as exact equivalents. Some include core software revenue, while others include implementation, adjacent workflow tools, legal practice management, invoice processing, compliance, or automation layers. The shared signal is more important: professional services firms are modernizing the systems that decide when work becomes billable, when invoices go out, and how quickly cash comes back.
The future outlook is especially important for firms that have outgrown simple time sheets and manual invoice templates. As projects become more distributed and clients demand clearer evidence of work, billing systems need to connect project data, contract terms, expenses, change orders, tax rules, and payment status. This is why PSA, time tracking, billing, AR automation, and e-invoicing markets increasingly overlap in practice even when research firms measure them separately.
For smaller firms, the key decision is usually not whether to buy the most advanced platform immediately. It is whether the current workflow can reliably answer basic questions: who worked on what, what is billable, what has been approved, what is waiting for client confirmation, what has been invoiced, and what is overdue. If those answers require several spreadsheets and inbox searches, the firm is already carrying hidden billing risk.
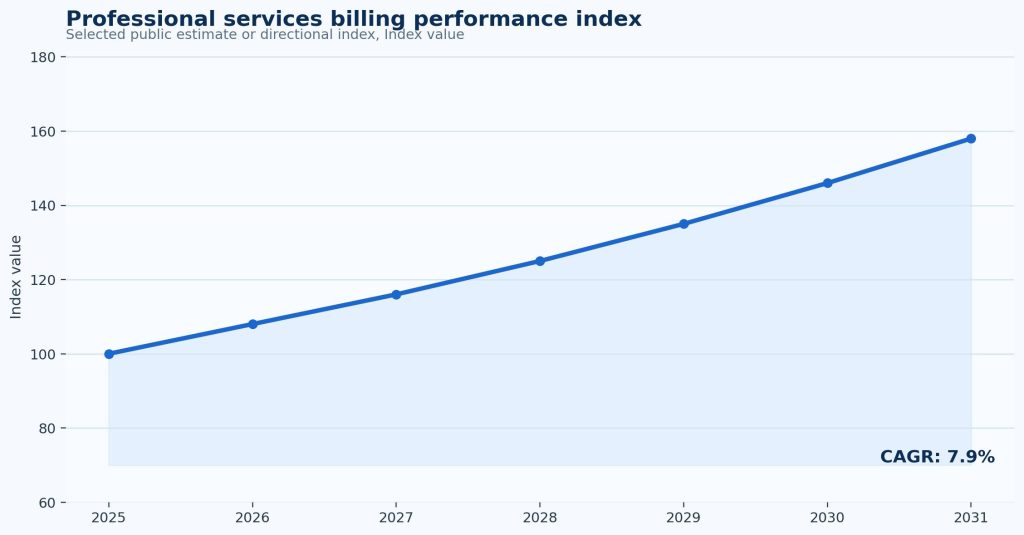
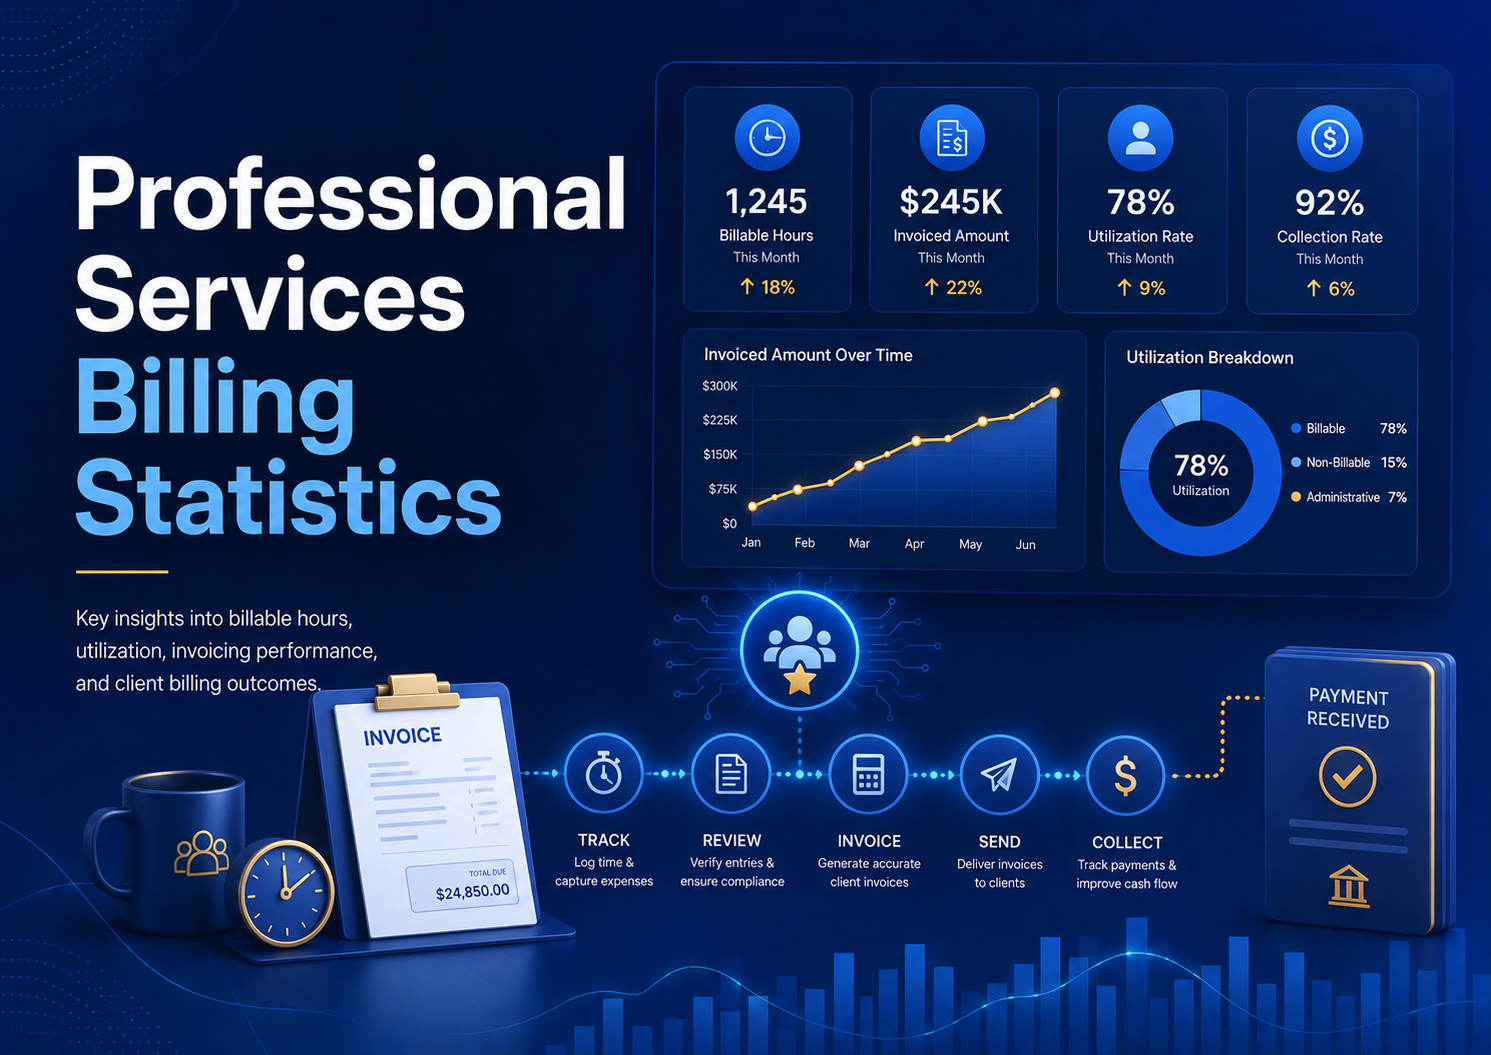
Figure 1. Professional services billing performance index summarizes the growth direction of software, invoicing, and project-to-cash systems. Market estimates should be interpreted as directional because vendors define PSA, billing, and invoice automation differently.
The Professional Services Revenue Waterfall
The cleanest way to understand billing performance is to follow the revenue waterfall. A firm first has available capacity. Some of that capacity becomes billable utilization. Some captured work survives partner review, discounting, and write-downs as realized value. Some invoiced value is collected on time. Every step can leak revenue, and every leak has a different owner.
The useful question is not only how much revenue a firm booked. It is how much value survived each gate in the chain. Available capacity has to become scheduled delivery work. Delivery work has to become accurate time, expenses, or milestone evidence. That evidence has to survive review without unnecessary write-downs. The invoice then has to pass client approval and convert into cash within the expected payment window.
This is why the same market statistic can mean very different things for different firms. A growing PSA software market says firms want better systems, but the operating value depends on whether the system improves the specific gate where the firm is losing value. A firm with weak time capture needs different discipline than a firm with strong time capture but poor collections. A firm with fast invoicing but low realization needs better scoping and billing review, not only faster reminders.
| Stage | What it measures | Useful benchmark signal |
|---|---|---|
| Available capacity | The working hours or project capacity the firm can deploy. | A 2,000-hour professional at 70% utilization creates about 1,400 billable hours before realization or collection effects. |
| Billable utilization | How much capacity becomes client-chargeable work. | SPI-linked data places billable utilization around 66.4% to 69.3% in recent benchmarks. |
| Realization | How much captured value survives write-downs, discounts, billing review, or rate leakage. | Legal realization around 88% implies 12% value leakage before full-rate revenue is secured. |
| Collection | How much invoiced value is paid and how quickly. | North America shows 38% of credit-based sales affected by overdue invoices and 4% written off. |
| Margin quality | Whether the work was delivered profitably after staffing, rework, and admin effort. | EBITDA being 28% below a five-year average signals that revenue alone does not prove billing health. |
This waterfall prevents a common management mistake: treating billing as only a finance function. In reality, finance sees the result of decisions made earlier by sales, project managers, partners, delivery teams, and account owners. A low collection rate may begin with unclear scope. A high write-down rate may begin with poor staffing. Weak utilization may begin with a sales-pipeline problem. The dashboard only works when it shows the whole chain.
The waterfall also changes how leaders should read billing statistics. A low utilization rate is not automatically a finance problem; it may reflect weak demand planning, underused specialist capacity, or too much non-billable internal work. Low realization is not always caused by client resistance; it may come from unclear estimates, poor task coding, vague scope boundaries, or partner write-down habits. Slow collections may reflect the client’s payment behavior, but it may also reflect late invoice submission, missing purchase-order numbers, or weak follow-up ownership.
A polished billing article should therefore treat each statistic as a signal in a larger chain. When the chain is visible, a firm can decide whether the next improvement should be better time capture, stronger project governance, clearer billing narratives, faster invoice approval, client-specific payment terms, or automated reminders.
Utilization, Time Capture, and Realization Benchmarks
Utilization is one of the most sensitive metrics in professional services because small percentage changes can represent large revenue swings. It also has to be read carefully. Very low utilization may show weak demand, poor staffing, or administrative overload. Very high utilization may show burnout risk, limited training time, or underinvestment in future sales. The goal is not simply to push every person to the maximum; it is to balance billable output, quality, and sustainability.
Billable utilization and capacity statistics
• Rocketlane/SPI reported employee billable utilization at 66.4% in 2025.
• That 66.4% utilization was 3.6 percentage points below SPI’s 70% minimum healthy benchmark.
• The 2024 Professional Services Maturity Benchmark reported 69.3% employee billable utilization.
• Another SPI-linked commentary reported billable utilization falling to 68.9% in 2024, described as a five-year low.
• Healthy billable utilization is often cited in a 74% to 84% target range, though acceptable levels differ by role and firm model.
• If a professional has 2,000 available hours and utilization is 66.4%, roughly 1,328 hours become billable before realization losses.
• At the same 2,000 available hours, raising utilization from 66.4% to 70% adds 72 billable hours per professional.
• At a $200 hourly rate, those 72 hours represent $14,400 of potential annual billings per professional before realization and collection effects.
• Across a 50-person delivery team, the same utilization movement can represent about 3,600 additional billable hours.
• At $200 per hour, that 3,600-hour improvement equals $720,000 of potential annual billings before write-downs and payment risk.
Legal realization and time-capture benchmarks
• Clio’s more recent legal benchmark places average law-firm utilization around 38%.
• A 38% legal utilization benchmark equals about 3.0 billable hours in an eight-hour workday.
• Clio’s earlier 2017 benchmark reported 29% utilization, equivalent to about 2.3 billable hours in an eight-hour day.
• Legal realization around 88% means about 12% of captured billable work does not convert at full value.
• The 2017 Clio benchmark listed realization at 82% and collection at 86%, showing the older gap between recorded work, invoiced work, and collected cash.
• Solo law firms are billing 38% more than in 2016 after adjusting for inflation, according to Clio’s solo and small firm data.
• Solo firms are collecting 42% more than in 2016 after inflation adjustment.
• Small law firms are billing 49% more than in 2016 and collecting 55% more, after adjusting for inflation.
• If a firm captures 10,000 standard-rate billable hours but realizes only 88%, the realized value is equivalent to 8,800 hours.
• A 5-point realization improvement on $10 million of standard value is worth $500,000 before considering collection speed.
The practical lesson is that utilization, realization, and collections should not be managed in isolation. A firm can improve utilization by overstaffing projects, but that may reduce realization if clients reject inefficient work. A firm can preserve realization with strong partner review, but still hurt cash flow if invoices sit in approval queues. A mature billing process shows the trade-offs clearly enough for managers to act before the month closes.
A more mature benchmark review separates utilization quality from utilization volume. High utilization is not automatically healthy if the work is underpriced, written down, or performed by the wrong staffing mix. Low utilization is not always a failure if senior people are protecting sales, training, strategy, or quality control. The best dashboards therefore compare utilization with realization, project margin, staffing mix, and client profitability rather than treating a single utilization target as the whole answer.
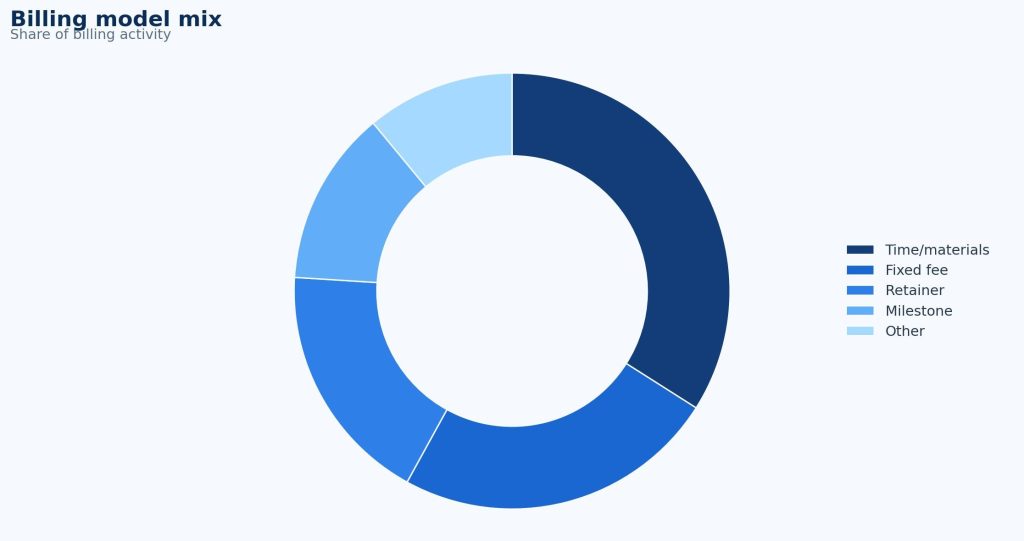
Figure 2. Professional services billing workflow shows why time capture, realization, invoice approval, and collection speed must be managed together rather than as separate finance tasks.
Invoicing, Collections, and Late-Payment Statistics
Professional services firms often experience cash-flow stress after the work is already complete. This is especially common when projects are milestone-based, partner-reviewed, or billed monthly after time and expenses are approved. Late payment is not always a client problem. It can be caused by billing errors, unclear purchase-order references, missing supporting documents, weak milestone language, or slow internal invoice approval.
B2B payment and bad-debt benchmarks
• North American B2B payment data shows 64% of sector sales transacted on credit.
• North American payment terms remain around 43 days from invoicing.
• Overdue invoices affect 38% of North American B2B sales on credit.
• Bad debts account for 4% of North American credit-based B2B sales.
• U.S. payment-practices data shows overdue invoices affecting 43% of credit-based B2B sales.
• UK payment-practices data shows 51% of B2B invoices currently overdue.
• Bad debts account for 7% of all UK B2B invoices in the cited benchmark.
• Central and Eastern Europe data shows overdue invoices at 53% of credit B2B sales.
• Bad debts stand at 8% of all B2B invoices in the Central and Eastern Europe benchmark.
• Western Europe payment-practices data reports nearly 50% of B2B sales affected by late payments.
• Western Europe bad debts are reported at 8% of all B2B sales.
• Allianz Trade data shows 42% of companies globally had payment terms above 60 days of turnover.
• Asia had the highest share in that benchmark, with 46% of companies above the 60-day threshold.
• Canada small business payment delays worsened from 7.6 days to 8.2 days beyond agreed terms in one 2024 period.
• Australia and New Zealand SMB data showed 41% of Australian SMBs and 35% of New Zealand SMBs reporting payments more than 14 days overdue on average.
AR automation and billing-error benchmarks
• AR automation benchmarks suggest 92% of payments can require no manual intervention in highly automated environments.
• One AR benchmark reported billing errors accounting for 60% of late payments.
• The same benchmark reported 61% of invoices containing at least one error.
• The U.S. AR automation market is estimated at $1.62 billion in 2025 and projected to reach $4.18 billion by 2033.
• The global AR automation market is estimated at $4.48 billion in 2025 and projected to reach $11.99 billion by 2033.
• If a services firm sends 1,000 invoices a month and 5% need correction, it creates 50 avoidable billing exceptions.
• If each exception takes 20 minutes, those 50 corrections consume more than 16 hours of monthly billing-team capacity.
• If invoice approval takes 10 days longer than planned, every billing cycle becomes harder to forecast even when clients eventually pay.
Collections improve fastest when firms fix upstream causes. Clean time entry, clear engagement terms, consistent expense documentation, client-ready invoice narratives, and faster approval routes can reduce disputes before the collections team ever has to follow up. In that sense, billing software is most valuable when it prevents the invoice from becoming a negotiation.
Regional and Country-Level Billing Software Statistics
Professional services billing is increasingly regional. Software adoption, e-invoicing rules, client payment habits, labor markets, and project delivery models vary by country. A U.S. consulting firm, a German engineering practice, a UK law firm, and an Asia-Pacific IT services provider may all use PSA software, but the billing problem they are solving is not identical.
| Region or country | Strong benchmark | Billing implication |
|---|---|---|
| North America | North America captured 37.74% of PSA software revenue in 2025. | The region remains a core PSA market, with billing linked to resource planning, client reporting, and collections discipline. |
| United States | U.S. PSA software is expected to reach $10.37 billion by 2032 at an 11.76% CAGR. | U.S. firms need billing systems that connect project delivery, revenue operations, and client profitability. |
| Europe | Europe PSA software generated $2.81 billion in 2024 and is expected to grow at a 14.4% CAGR. | European firms face both project-to-cash pressure and rising structured e-invoicing expectations. |
| United Kingdom | UK PSA software generated $496.3 million and is expected to reach $1.57 billion. | The UK market combines strong software adoption with late-payment exposure and professional services density. |
| Germany | Germany PSA software generated $397.4 million and is projected to reach $1.09 billion by 2033. | Engineering, consulting, and technical services make billing accuracy, project tracking, and compliance especially important. |
| Benelux | Benelux PSA software is projected to reach $714.9 million by 2033. | Smaller regional markets still require sophisticated multi-client, multi-language, and compliance-ready billing workflows. |
| Asia-Pacific | Asia-Pacific PSA software generated $2.66 billion in 2024 and is expected to grow at a 16.8% CAGR. | Fast growth reflects demand from IT services, outsourcing, consulting, and delivery teams scaling across borders. |
| India | India business software and services is forecast to grow at a 14.4% CAGR from 2024 to 2030 in one regional outlook. | Large services workforces create strong pressure for time capture, resource planning, and project-to-cash control. |
Regional data also changes the compliance lens. The EU’s VAT in the Digital Age reforms point toward structured e-invoicing and digital reporting across cross-border transactions. From 1 July 2030, e-invoicing is expected to become the default method for issuing invoices in relevant intra-Community contexts, and structured e-invoices must be issued within 10 days of the chargeable event under the cited rule set. For professional services firms operating across Europe, billing design is now partly a regulatory architecture question.
For global firms, the practical issue is standardization versus localization. The firm may want one billing policy, one chart of accounts, and one management dashboard, but clients pay through local procurement rules, tax systems, currency practices, and invoice formats. A mature billing setup keeps the core process consistent while localizing the parts that affect approval and payment: tax fields, entity names, invoice language, e-invoicing requirements, purchase-order formats, and reminder timing.
E-Invoicing, Compliance, and Digital Reporting
E-invoicing is important because professional services invoices are often more complex than retail or simple product invoices. They may include time narratives, expenses, milestone references, retainers, tax treatment, cross-border client entities, and supporting documentation. When governments push structured invoice formats, firms need their billing data to be clean before the invoice is generated.
• The EU estimates that e-invoicing and digital reporting reforms could reduce VAT fraud by up to EUR 11 billion per year.
• The same EU reform package could reduce administrative and compliance costs for EU traders by more than EUR 4.1 billion per year.
• The ViDA package was adopted on 11 March 2025.
• Digital reporting and e-invoicing for intra-Community transactions are scheduled for introduction by July 2030.
• Implementation is expected to progress through January 2035 under the phased reform timeline.
• From 1 July 2030, e-invoicing becomes the default method for issuing invoices in the relevant EU framework.
• Structured e-invoices must be issued within 10 days of the chargeable event.
• Invoice data must be reported to national VAT authorities in real time under the digital reporting model.
• E-invoicing market forecasts include $70.3 billion by 2034, $62.68 billion by 2031, and $44.63 billion by 2032 under different definitions.
The compliance lesson is practical. A firm cannot wait until the final invoice step to fix bad billing data. Matter codes, project IDs, tax fields, client entities, purchase-order references, fee arrangements, and expense categories must be clean earlier in the workflow. E-invoicing rewards firms that treat billing data as structured operational data rather than free-form administrative text.
Segment Differences: Legal, Accounting, Consulting, IT, and Agencies
Professional services billing varies because the work varies. Legal services rely heavily on time narratives, matter management, realization, and collection. Accounting firms manage recurring work, filing deadlines, advisory projects, and client-document dependencies. Consulting firms manage utilization, project margin, travel or expense policies, and scope change. IT services and agencies often mix retainers, support, implementation milestones, and change orders.
Legal and alternative legal services
• The legal billing software market is estimated at $2.15 billion and expected to grow to $4.28 billion.
• Legal practice management software is projected from $4.8 billion to $10.9 billion.
• North America accounts for 38.6% of the legal practice management software market in one estimate.
• The alternative legal services market reached $28.5 billion, up from $20.6 billion in 2021.
• Independent alternative legal service companies generated $25.1 billion of that ALSP total.
• Law firm affiliates accounted for $1.8 billion, while Big Four accounting firms contributed $1.6 billion.
• Legal utilization around 38% and realization around 88% show why law-firm billing analytics often focuses on captured time, write-downs, and payment behavior.
Accounting, consulting, IT services, and advisory
• Global accounting services were valued at $646.06 billion in 2024 and projected to reach $986.50 billion by 2032.
• Accounting services are projected to grow at a 5.40% CAGR through 2032.
• North America held 34.63% of the accounting services market in 2024.
• Management consulting services were valued at $466.68 billion in 2024 and projected to reach $721.60 billion by 2032.
• Management consulting is forecast to grow at a 5.63% CAGR during the forecast period.
• North America held 33.51% of the management consulting services market in 2024.
• Another consulting services estimate placed the market at $318.89 billion in 2024 and projected $471.59 billion by 2034.
• IT and telecom held 26.35% of PSA software revenue by end-user industry in 2025.
• Deloitte provides professional services to nearly 90% of Fortune Global 500 companies and operates in more than 150 countries and territories.
• PwC reported $55.4 billion in FY2024 global revenue and a workforce of about 370,000 people.
These segments should not use the same billing dashboard without adjustment. A law firm may prioritize utilization, realization, matter-level WIP, and collection rate. A consulting firm may prioritize project margin, scope changes, milestone acceptance, and resource forecasting. An accounting firm may prioritize recurring revenue, deadline-driven workflows, client-document status, and write-offs. An agency may prioritize retainers, change orders, approval cycles, and profitability by client.
Where Billing Risk Changes by Firm Type
The article becomes more useful when the statistics are read against the billing model of the firm. A law firm, architecture studio, IT services provider, management consultancy, accounting practice, and creative agency may all sell expertise, but they do not lose revenue in the same way. Their billing software, approval workflows, and KPI targets should reflect those differences.
Time-and-materials firms
Time-and-materials billing depends heavily on complete, timely, and well-described time capture. The main risk is not only that hours are missed. It is that hours are captured too late, coded to the wrong task, described poorly, or written down because the client cannot see the connection between the work and the deliverable. In this model, realization is often the most revealing metric because it shows whether captured work survives review and client acceptance.
• The most important operating controls are time-entry compliance, task coding, WIP aging, write-down reasons, and billing narrative quality.
• If utilization rises but realization falls, the firm may be doing more work without protecting the value of that work.
Fixed-fee and milestone firms
Fixed-fee and milestone billing shifts the risk from time capture to scope control. The invoice may be simple, but the margin behind it depends on whether the project was estimated correctly, staffed correctly, and protected from uncontrolled changes. These firms need billing data that connects estimates, change orders, milestone evidence, delivery status, and margin movement.
• The strongest indicators are project margin, budget burn, change-order approval rate, milestone readiness, and the amount of unbilled out-of-scope work.
• A fixed-fee project can look easy to bill while quietly becoming unprofitable if scope changes are not documented before the invoice date.
Retainer and recurring advisory firms
Retainer billing looks predictable, but it can hide delivery imbalance. Some clients consume far more advisory time than the retainer covers, while others underuse the service and later question value. Better dashboards compare recurring revenue with actual service consumption, renewal risk, client profitability, and the amount of strategic work versus reactive support.
• Useful metrics include retainer utilization, support-load concentration, renewal timing, unpaid overage work, and average collection time by client tier.
• Recurring billing is healthiest when the invoice is supported by visible value evidence, not only by an automatic schedule.
Automation, Maturity, and AI Pressure
Billing performance improves when automation supports better decisions, not when it simply moves bad data faster. Mature firms connect project setup, staffing, time entry, expense capture, approvals, invoice narratives, payment follow-up, and revenue reporting. Immature firms may have a billing system but still rely on spreadsheets, email approvals, manual reminders, and partner memory to keep the process moving.
• Workday/SPI reports Level 5 firms seeing a 739% increase in revenue growth over Level 1 organizations.
• The same benchmark reports Level 5 firms achieving a 537% boost in profit margins over Level 1 organizations.
• Level 5 firms also achieved a 71% improvement in billable utilization over Level 1 organizations.
• Rocketlane/SPI says EBITDA is 28% below its five-year average in a recent professional services benchmark.
• A 2024 benchmark reported respondents achieving 87.7% of annual margin target.
• Another commentary reports EBITDA falling from 15.4% in 2023 to 9.8% in 2024.
• Capgemini maintained full-year operating-margin guidance between 13.3% and 13.6%.
• Global business software and services are forecast to grow materially through 2030, with one estimate adding about $569.72 billion from 2024 to 2030.
• Business analytics and reporting PSA modules are projected to grow at 15.21% CAGR, reflecting demand for real-time performance visibility.
• Cloud-based PSA adoption is identified as a major growth driver, especially for distributed delivery teams and firms that need project data accessible across offices.
AI adds another layer of pressure. It can help summarize time narratives, flag missing entries, detect scope drift, predict collection risk, or identify margin leakage. But AI only helps if the underlying project and billing data is consistent. A system cannot reliably predict billing risk if matter codes are inconsistent, project milestones are vague, rates are buried in email, or invoices are corrected manually after the fact.
The risk is treating automation as a substitute for billing governance. AI can draft time narratives, identify missing entries, summarize project activity, and flag unusual discounts, but it cannot decide whether the original scope was realistic or whether the client had approved the extra work. Firms that get the most value from automation usually define approval rules, exception categories, and ownership first, then use automation to make those rules easier to follow.
Billing Maturity: What Better Firms Do Differently
The most useful professional services billing programs are not defined by how many dashboards they have. They are defined by how consistently the firm can turn delivered work into accurate, defensible, and collectible invoices. Mature firms usually make billing visible before the invoice date rather than waiting for finance to discover problems after month end.
1. They review work-in-progress before invoices are created
A large share of billing leakage begins while the project is still active. If time entries are late, tasks are coded inconsistently, expenses lack documentation, or milestone evidence is incomplete, the invoice will either be delayed or discounted. Mature firms use work-in-progress reviews to find these issues before the billing cycle closes.
• A weekly WIP review helps separate truly billable work from training, rework, internal meetings, or scope creep before those items reach the invoice.
• Project managers should see unbilled time, unapproved expenses, approaching caps, and missing purchase-order references before finance starts invoice production.
• The goal is not to make billing slower. The goal is to make the final invoice easier to approve because the evidence has already been checked.
2. They manage realization as a project-quality signal
Realization is often treated as a finance percentage, but it usually reveals delivery and scoping quality. If a firm repeatedly writes down time on similar projects, the issue may be pricing, estimation, training, staffing mix, or a mismatch between client expectations and actual delivery effort. Better firms use realization reports to ask why value leaked, not only how much leaked.
• Low realization on fixed-fee work can indicate underpriced proposals, unclear assumptions, or uncontrolled scope changes.
• Low realization on hourly work can indicate excessive write-downs, weak billing narratives, or client discomfort with unexplained activity.
• Realization trends are most useful when compared by client, practice area, project type, role, and partner or project manager owner.
3. They connect billing language to client approval behavior
Many invoice disputes are not caused by the amount alone. They are caused by unclear descriptions, missing milestones, vague expense categories, weak references to the statement of work, or poor alignment with the client’s procurement system. Professional services billing has to translate expert work into language that a client approver can understand and defend internally.
• A technical consulting invoice should connect work to deliverables, systems, tickets, phases, or implementation milestones.
• A legal invoice should make activity clear enough to support review without overloading the client with unnecessary detail.
• An agency invoice should separate retainers, production work, media spend, revisions, and out-of-scope changes so the client can approve each part cleanly.
4. They treat collections as a billing-design outcome
Collections teams often inherit problems created earlier in the revenue cycle. If the invoice does not match the contract, if approvers were not confirmed, if supporting documents are missing, or if payment terms are unclear, reminders alone will not solve the problem. Mature firms design invoices so the client has fewer reasons to pause payment.
• Client-specific billing requirements should be stored in the system, not remembered by individual account managers.
• Invoices should show the information clients need to match the bill to a purchase order, project code, retainer, milestone, or statement of work.
• Aged receivables should be reviewed by reason code, not only by invoice age, so the firm can distinguish cash timing from preventable billing defects.
Metrics Leaders Should Track
The best billing dashboards are not overloaded with every possible KPI. They focus on the few measures that explain where work, value, and cash are leaking. A strong dashboard also separates firmwide averages from segment-level reality. Legal, consulting, accounting, architecture, agencies, and IT services may all need different thresholds.
| Metric | Why it matters | How to read it |
|---|---|---|
| Billable utilization | Shows how much capacity becomes chargeable work. | Read alongside role, seniority, project pipeline, and burnout risk. |
| Realization rate | Shows how much captured value survives write-downs and discounting. | Low realization often points to pricing, scope, review, or client-approval issues. |
| Collection rate | Shows how much invoiced value turns into cash. | A high realization rate is not enough if collections are slow or disputed. |
| Invoice cycle time | Measures how long it takes from work completion or period close to invoice delivery. | Slow cycles often reveal time-entry delays, partner review bottlenecks, or missing documentation. |
| WIP aging | Shows work recorded but not billed. | Old WIP can become write-downs, disputes, or forgotten revenue. |
| AR aging and DSO | Shows whether invoices are turning into cash on time. | Useful by client, region, partner, sector, and contract type. |
| Write-down rate | Shows how much work is removed before invoicing or collection. | High write-downs often signal scope control, rate pressure, or poor time narratives. |
| Billing exception rate | Shows how often invoices need manual correction or client clarification. | A rising exception rate can indicate weak project setup or poor data quality. |
Leaders should also watch the relationship between metrics. Rising utilization with falling realization may mean staff are busy on poorly scoped work. Rising rates with falling collections may mean clients are resisting price increases. Faster invoicing with more corrections may mean the process is speeding up but quality is falling. The value of a dashboard is in these combinations, not in single-number reporting.
A better executive view shows a small set of linked measures rather than a crowded dashboard. One useful model is to group billing KPIs into four families: capacity conversion, value protection, invoice quality, and cash conversion. Capacity conversion covers utilization and staffing. Value protection covers realization, write-downs, and margin. Invoice quality covers approval time, exceptions, and disputes. Cash conversion covers overdue invoices, DSO, collection rate, and write-offs.
This structure helps leaders avoid blaming the wrong team. If invoice cycle time is fast but collections are slow, the problem may be client payment behavior or missing purchase-order data. If collections are strong but realization is weak, the firm may be billing quickly but discounting too much before the invoice is sent. If utilization is high but margins fall, the staffing mix or project scope may be the real issue.
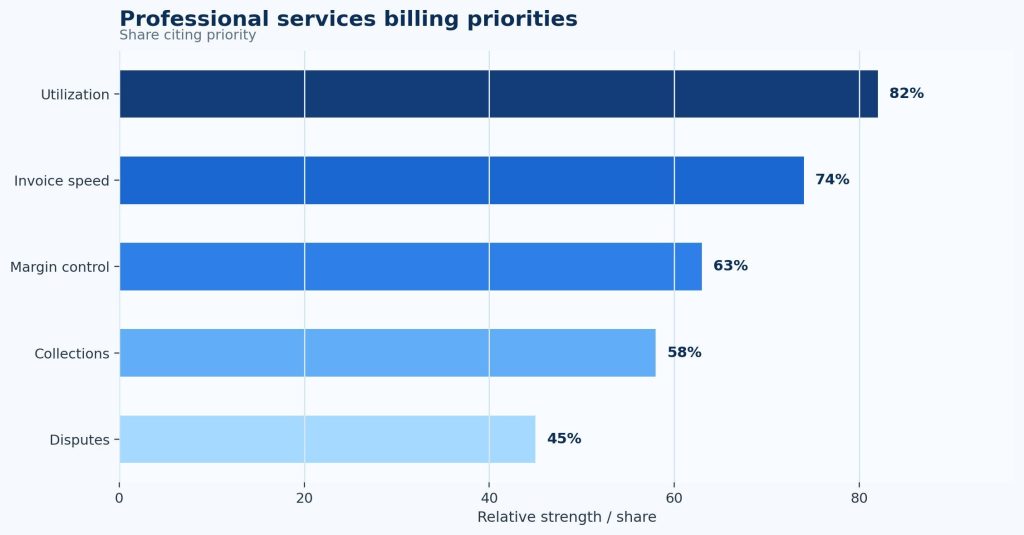
Figure 3. Billing software market and workflow benchmarks should be read together because software growth only matters when it improves time capture, realization, invoice accuracy, and collection speed.
Practical Billing Scenario: What a Small Leak Can Cost
Consider a 75-person professional services firm with consultants, project managers, analysts, and account leads. If 50 delivery employees each have 2,000 available annual hours, the firm has 100,000 potential delivery hours before utilization. At 66.4% billable utilization, it records about 66,400 billable hours. At 70%, it records 70,000 billable hours. That difference is 3,600 hours before realization or collection effects.
If the blended billing rate is $175 per hour, the utilization gap represents $630,000 of potential annual billings. If realization is 88%, that $630,000 becomes $554,400 of realized value. If collection issues, disputes, or payment delays reduce cash conversion further, the firm may lose or defer even more value. The point is not that every firm should force utilization higher. The point is that small movements in utilization, realization, and collection can become material when multiplied across people, projects, and months.
• A 3.6-point utilization gap on 100,000 available hours equals 3,600 billable hours.
• At $175 per hour, those hours represent $630,000 in potential annual billings.
• At 88% realization, the realized value is $554,400 before collection timing.
• If 38% of credit-based invoices become overdue, more than one-third of the firm’s invoiced value may need active follow-up.
• If 5% of invoices require correction and the firm sends 800 invoices a month, the team handles 40 avoidable correction cases monthly.
• At 20 minutes per correction, those cases consume more than 13 hours of finance or admin time every month.
This scenario is why the best professional services firms do not wait for year-end profitability reviews to examine billing quality. They monitor time-entry compliance, WIP aging, invoice approvals, write-down reasons, client dispute categories, and AR aging every month. A billing process is healthy when it can show where value is created, where it leaks, and who owns the fix.
How to Interpret These Statistics
Professional services billing statistics can be misleading if they are read without context. Market-size numbers show demand for software, not guaranteed operational improvement. Utilization benchmarks show capacity conversion, not necessarily project quality. Realization rates show value defense, but not always client satisfaction. Collection rates show cash conversion, but not whether the original invoice was clear or accurate.
• Read market forecasts directionally because PSA, billing, e-invoicing, invoice processing, and legal billing tools are defined differently across publishers.
• Compare utilization only within similar roles and business models; a senior partner, staff consultant, paralegal, engineer, and project manager should not share one target blindly.
• Treat realization below 90% as a prompt to investigate pricing, scope, discounts, write-downs, and invoice narratives.
• Treat overdue-invoice exposure above 40% as a warning sign that billing quality and collection routines need review.
• Use regional payment statistics to adjust credit terms, invoice follow-up timing, and client onboarding expectations.
• Use e-invoicing deadlines to improve structured billing data before compliance becomes urgent.
• Benchmark against internal history as well as external data; a firm’s own utilization, WIP aging, and collection trend often explain more than market averages.
The strongest use of these statistics is planning. A leadership team can use the market numbers to understand where technology spending is going, but it should use utilization, realization, WIP, AR, write-down, and regional payment data to decide what to fix first. The firms that benefit most from billing automation are usually the ones that define the problem before buying the tool.
The most effective next step is often a targeted leakage review instead of creating a broad technology wish list. Businesses can begin by selecting a recent billing cycle and tracking a sample of matters, projects, or retainers from completed work to final payment collection. During this process, teams should identify where billable hours were missed, where invoices were delayed, which charges were adjusted, which clients disputed payments, and which accounts exceeded agreed payment terms. Using organized tools such as a printable invoice template can also help improve billing consistency and documentation, turning industry benchmarks into a practical and actionable internal improvement strategy.
FAQ
What is professional services billing?
Professional services billing is the process of converting expert work into client charges. It can include time-based billing, fixed fees, milestone billing, retainers, project expenses, success fees, subscription-style advisory retainers, and hybrid models. The process usually depends on accurate time capture, project tracking, rate rules, approvals, invoice preparation, payment follow-up, and financial reporting.
Why do utilization and realization matter so much?
Utilization shows whether capacity becomes billable work. Realization shows whether captured work is billed or collected at full value. A firm can be busy but still unprofitable if utilization is low, if rates are discounted, if partners write down time, or if clients dispute invoices. That is why the revenue waterfall is more useful than a single revenue number.
What is a healthy billable utilization rate?
Benchmarks vary by role and business model. SPI-linked data places recent employee billable utilization around 66.4% to 69.3%, while some healthy target ranges are cited around 74% to 84%. The right target depends on delivery role, seniority, sales responsibility, training needs, project type, and firm strategy.
How does e-invoicing affect professional services firms?
E-invoicing forces invoices to be more structured and machine-readable. For professional services firms, that means billing data such as client entities, tax fields, engagement IDs, project references, fee arrangements, and chargeable events must be accurate before invoice generation. EU reforms make this especially important for firms operating across borders.
Which billing metrics should firms track first?
Start with billable utilization, realization rate, collection rate, invoice cycle time, WIP aging, AR aging, write-down rate, and billing exception rate. These metrics show whether work is being captured, billed, defended, and collected. Once those basics are reliable, firms can add profitability by client, matter, project, practice area, region, and billing model.
Final Takeaway
Professional services billing statistics point to one practical conclusion: billing performance is a full operating system, not an invoice template. Market forecasts show rapid investment in PSA, billing, time tracking, AR automation, and e-invoicing. Utilization and realization benchmarks show where value leaks before the invoice is even sent. Regional payment data shows why collection risk changes by market. Compliance trends show why structured billing data is becoming more important.