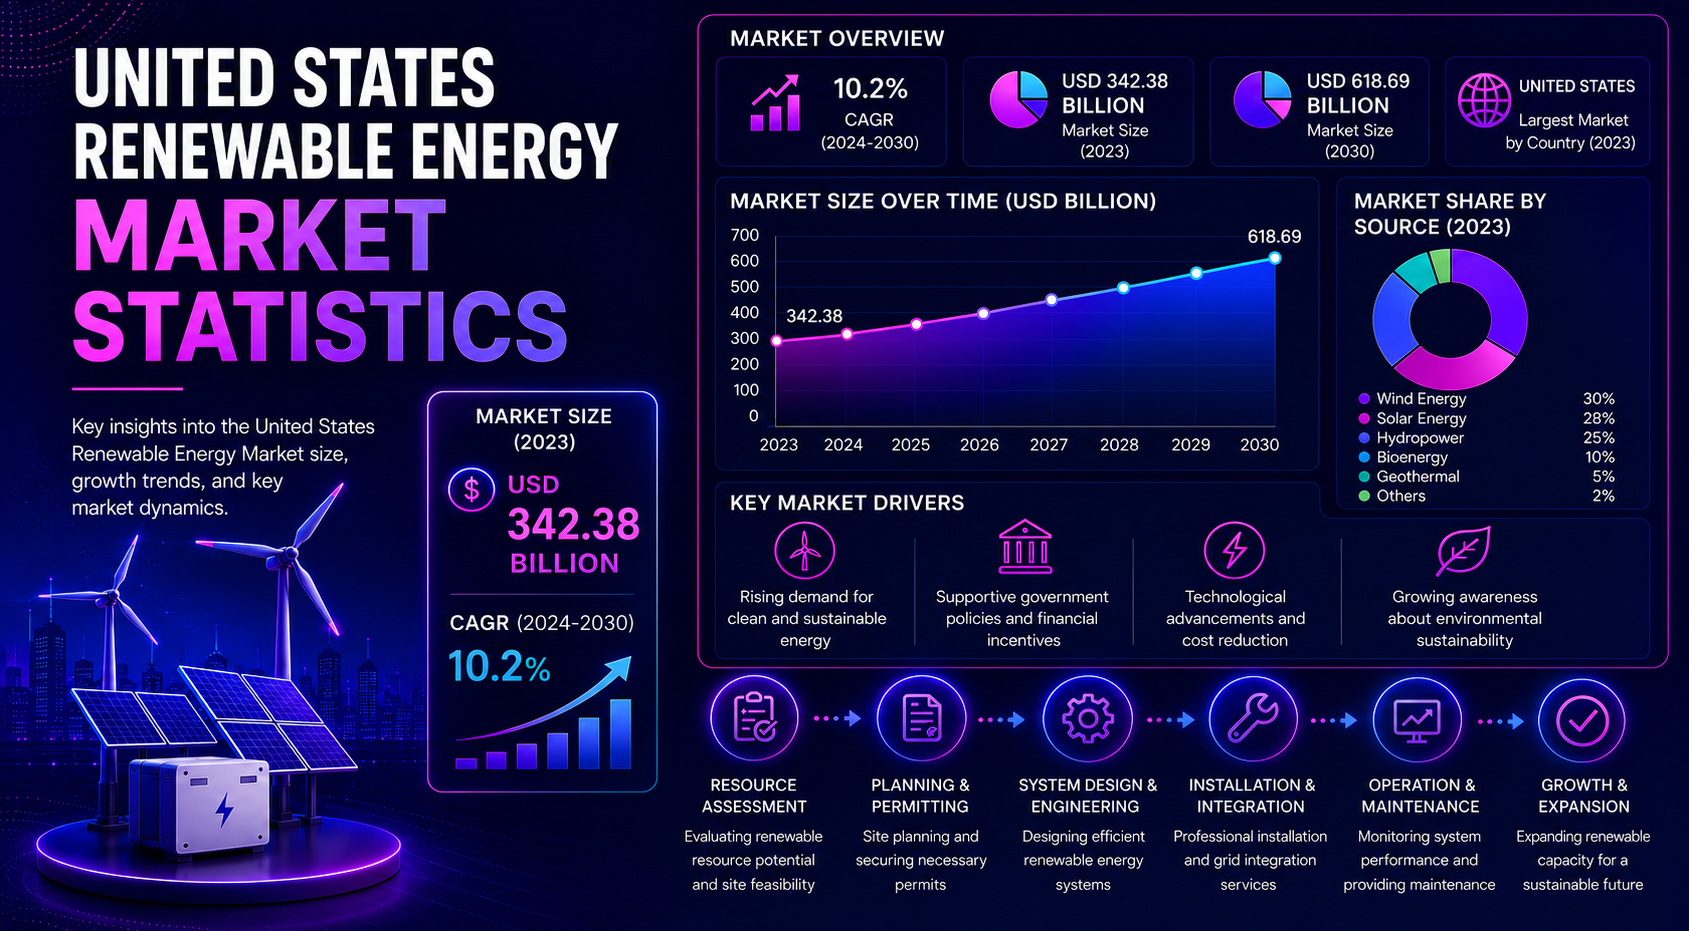
United States renewable energy is no longer a niche power category. It now sits at the center of electricity generation, grid planning, capital investment, state policy, corporate procurement, and long-term reliability strategy. Solar and wind are the visible growth engines, but the market also depends on hydropower, geothermal, biomass, storage, transmission, interconnection, and the ability of each region to match clean generation with rising demand.
The strongest statistics show why the market deserves its own benchmark scorecard. U.S. renewable electricity reached roughly 22.5% of total generation in 2024 in the state-level dataset used for this workbook. EIA’s electricity-source table shows renewables at 21.4% in its latest comparable national mix, while recent EIA outlook data points to renewables moving from about 24% of the U.S. power mix in 2025 toward 27% in 2027. American Clean Power reported 49 GW of new clean power capacity in 2024 and an operating clean energy fleet above 313 GW. SEIA and Wood Mackenzie reported 43.1 GWdc of solar installed in 2025, even as the market absorbed policy and financing pressure.
Executive Renewable Energy Benchmarks
These are the statistics that frame the U.S. renewable energy market. They show the scale of clean power generation, the technologies driving capacity additions, the state-level leaders, and the constraints that will shape the next stage of growth.
The numbers that define the U.S. renewable energy market
• Renewable electricity accounted for about 22.5% of total U.S. generation in 2024 in the state-level benchmark table, equal to about 970.6 TWh of renewable electricity.
• EIA’s latest electricity-source table lists renewables at 894 billion kWh, or 21.4% of U.S. utility-scale electricity generation, with wind, hydropower, solar, biomass, and geothermal all contributing to the mix.
• Wind remained the largest renewable electricity source in the EIA electricity-source table, producing about 425 billion kWh and representing roughly 10.2% of U.S. generation.
• Hydropower contributed about 240 billion kWh in the same EIA mix, equal to about 5.7% of utility-scale electricity generation.
• Solar generated about 165 billion kWh in the EIA electricity-source table, while newer EIA reporting shows utility-scale solar generation reaching about 296,000 GWh in 2025 and small-scale solar reaching about 93,000 GWh.
• Utility-scale solar generation grew 34% year over year in 2025, while small-scale solar generation grew 11%, showing that solar growth is no longer limited to one segment.
• American Clean Power reported 49 GW of new clean power capacity deployed in 2024, a 33% year-over-year increase in annual installations.
• The U.S. operating clean energy fleet reached more than 313 GW in 2024, with projects operating in all 50 states.
• Clean power represented about 93% of new U.S. electricity capacity additions in 2024, confirming that most new build decisions are now clean-energy decisions.
• SEIA and Wood Mackenzie reported 43.1 GWdc of solar capacity installed in 2025, down 14% from 2024 but still one of the strongest annual solar markets globally.
• EIA expects 2026 utility-scale capacity additions to be led by solar at 51% of planned additions, followed by battery storage at 28% and wind at 14%.
• Texas and California remain the largest practical markets for renewable scale, but Iowa, South Dakota, Washington, Vermont, Kansas, Oklahoma, and other states show how renewable leadership can be measured by generation share, not only by absolute volume.
• U.S. power consumption is expected to reach new records in 2026 and 2027, which means renewable growth must be evaluated against demand growth rather than against historical electricity use alone.
| Metric | Latest benchmark | Why it matters |
|---|---|---|
| Renewable generation share | About 22.5% in the 2024 state benchmark table | Shows renewables are a core power-system source, not a marginal category. |
| Clean power additions | 49 GW in 2024 | Shows the scale of new infrastructure entering the grid. |
| Operating clean energy fleet | More than 313 GW | Shows how large the installed base has become across all states. |
| Solar installed in 2025 | 43.1 GWdc | Shows solar remains the leading new-capacity engine even after a slower year. |
| Planned 2026 additions | Solar 51%, batteries 28%, wind 14% | Shows the next build cycle is dominated by renewables and storage. |
Editorial readout
The headline data points to six different ways to read the U.S. renewable energy market: generation, installed capacity, annual additions, state leadership, grid readiness, and demand growth. A national renewable share is useful, but it hides the operational reality that Texas is a wind-solar-storage scale market, California is a solar-storage-curtailment market, the Pacific Northwest is a hydropower market, and the Midwest is a wind-heavy generation market. A useful benchmark report separates these signals instead of treating renewable energy as one blended category.
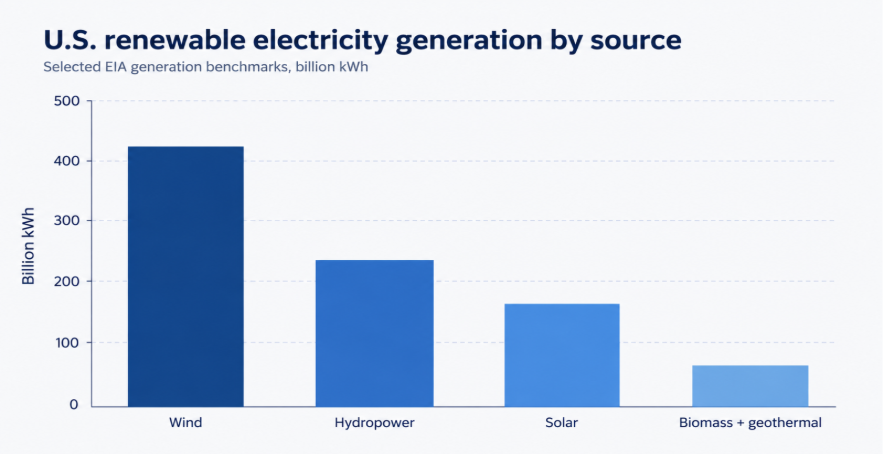
Figure 1. U.S. renewable electricity generation should be reviewed by source because wind, solar, hydropower, biomass, and geothermal play different roles in reliability, growth, and regional planning.
Why Renewable Energy Now Carries Grid-Level Stakes
Renewable energy matters more when electricity demand is rising. For much of the previous decade, renewable growth could be described mainly as a replacement story: solar and wind displaced some fossil generation and helped lower emissions. The current market is broader. Data centers, electrification, manufacturing, cooling demand, electric vehicles, and industrial load growth mean clean power must help serve a larger electricity system, not just change the fuel mix of a static one.
Market-size and demand-growth benchmarks
• U.S. power consumption is forecast to rise from about 4,195 billion kWh in 2025 to 4,271 billion kWh in 2026 and 4,397 billion kWh in 2027.
• Renewables are expected to increase their power-generation share from about 24% in 2025 to 27% in 2027, while coal’s share falls from about 17% to 15% over the same period.
• Commercial electricity consumption is expected to surpass residential electricity use in 2026, reflecting the weight of data centers, digital infrastructure, and business-sector load growth.
• Solar power is expected to make up 51% of planned 2026 utility-scale capacity additions, while battery storage contributes 28% and wind contributes 14%.
• Developers added about 53 GW of new U.S. generating capacity in 2025, the highest single-year total since 2002 according to EIA reporting.
• Global context also matters: IEA projects the renewable share of global electricity generation to rise from 32% in 2024 to 43% by 2030.
• IEA expects renewables to meet more than 90% of global electricity demand growth over 2025-2030, making the U.S. part of a wider grid-transition cycle.
• The U.S. renewable market is therefore tied to both domestic capacity additions and a global competition for clean power equipment, capital, and grid expertise.
| Market force | Signal to watch | Market implication |
|---|---|---|
| Demand growth | Power consumption forecasts | Renewables must serve incremental load, not only replace legacy generation. |
| New capacity mix | Solar, storage, and wind additions | The buildout is increasingly clean-power-led. |
| Grid pressure | Interconnection and transmission limits | Capacity additions can be delayed or curtailed without grid upgrades. |
| Corporate demand | PPA and utility procurement trends | Large buyers increasingly influence where clean power is built. |
Market context
The market context changes the business case. A renewable energy statistic is not only a climate indicator or a technology adoption number. It can affect utility planning, capacity markets, transmission expansion, power purchase agreements, data-center siting, customer electricity bills, and reliability strategy. The U.S. market should therefore be analyzed as a power-system transition in which renewable growth must keep pace with demand growth and grid modernization.
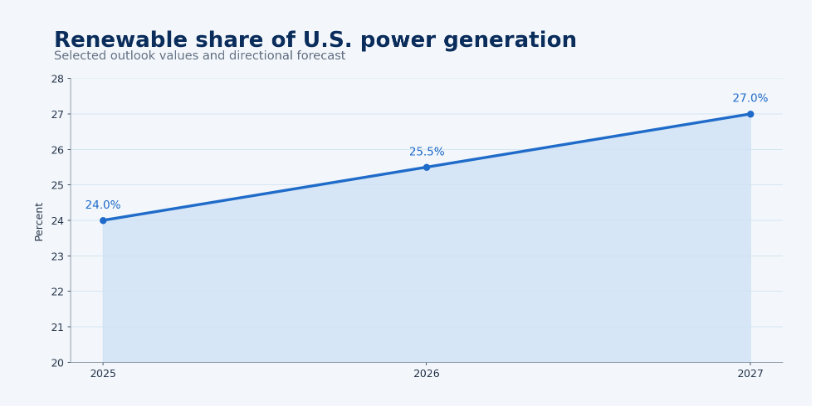
Figure 2. Renewable share forecasts should be reviewed beside electricity demand forecasts because clean generation must scale in a larger power system.
U.S. Renewable Electricity Generation: Where Clean Power Is Actually Produced
Generation data answers a different question from capacity data. Capacity shows how much infrastructure exists. Generation shows how much electricity actually reaches the power system. That distinction is especially important for renewables because solar, wind, hydropower, biomass, and geothermal have different output profiles, seasonal patterns, capacity factors, and regional constraints.
Generation benchmarks worth separating
• The 2024 state-level benchmark table records about 4,308.6 TWh of total U.S. electricity generation and about 970.6 TWh of renewable generation.
• Renewables represented about 22.5% of total U.S. generation in that 2024 benchmark, while the latest EIA electricity-source table records renewables at 21.4% in its comparable national mix.
• Wind generated about 425 billion kWh in the EIA electricity-source table, making it the largest U.S. renewable electricity source by output.
• Hydropower generated about 240 billion kWh, keeping it a major renewable source even though its annual output can move with water conditions.
• Solar generated about 165 billion kWh in the EIA electricity-source table and has since expanded sharply through utility-scale and small-scale deployment.
• EIA’s 2025 generation update shows wind at about 464,000 GWh, utility-scale solar at about 296,000 GWh, and small-scale solar at about 93,000 GWh.
• Wind and solar together supplied about 17% of U.S. electricity in 2025, showing the growing role of variable renewables in the grid mix.
• Utility-scale solar maintained a 20-year annual growth streak through 2025, while small-scale solar has built a 12-year data series since EIA began tracking it separately in 2014.
• Solar output growth is strongest in high-resource regions and states with large utility-scale development, while wind output remains concentrated in Texas, the Plains, the Midwest, and selected western states.
| Source | Recent generation benchmark | What it signals |
|---|---|---|
| Wind | 425 billion kWh in EIA electricity-source table; 464,000 GWh in 2025 update | Largest renewable generator and a mature regional power source. |
| Hydropower | 240 billion kWh in EIA electricity-source table | Stable renewable system asset, especially in the Pacific Northwest and western states. |
| Solar | 165 billion kWh in EIA table; 296,000 GWh utility-scale in 2025 update | Fastest-scaling generation source, with strong growth from utility-scale projects. |
| Small-scale solar | 93,000 GWh in 2025 update | Shows the role of rooftop and distributed generation outside large power plants. |
How to read generation data
Generation statistics should not be read as a simple ranking of technologies. Wind can produce more electricity than solar even if solar is adding capacity faster, because wind has a different installed base and output profile. Hydropower can appear stable in capacity but variable in generation because water availability changes. Solar can add capacity quickly while still facing curtailment, interconnection, and evening-peak challenges. A strong renewable scorecard reviews generation, capacity, capacity factor, curtailment, and regional resource quality together.
Solar Energy Statistics: The Main Capacity Growth Engine
Solar is the main capacity growth engine of the U.S. renewable energy market. It scales through large utility projects, rooftop systems, commercial installations, community solar, and solar-plus-storage. But solar is not one market. Utility-scale solar responds to interconnection, land, tax credits, module supply, and power purchase agreements. Residential solar responds to financing costs, customer acquisition, net metering, and local policy. Community solar depends heavily on state programs and subscriber rules.
Solar deployment and generation benchmarks
• SEIA and Wood Mackenzie reported 43.1 GWdc of U.S. solar capacity installed in 2025, a 14% decline from 2024 but still a very large annual installation total.
• Solar represented about 54% of new U.S. electricity-generating capacity installed in 2025, keeping it the largest new-capacity source for another year.
• In Q1 2026, the U.S. solar industry installed 7.8 GWdc, down 27% from Q1 2025 and 42% from Q4 2025, showing a slower start after a strong buildout cycle.
• Residential solar installed about 1,179 MWdc in Q1 2026, up 6% year over year but down 15% quarter over quarter.
• Commercial solar installed about 523 MWdc in Q1 2026, down 4% year over year and 25% quarter over quarter.
• Utility-scale solar remained the dominant solar segment because it can add large volumes of capacity when projects clear interconnection, permitting, financing, and procurement hurdles.
• Community solar added more than 1.8 GW in 2024 but slowed in the first half of 2025, with installations down 36% year over year in the workbook benchmark.
• EIA’s 2025 update shows utility-scale solar generation at about 296,000 GWh, up 34% year over year, making generation growth one of the strongest solar signals.
• Small-scale solar generation reached about 93,000 GWh in 2025, up 11% year over year, showing that distributed solar still contributes meaningful electricity output even when residential installation growth slows.
• Solar-plus-storage has become increasingly important because solar output peaks during daylight while many power systems face more challenging net-load ramps in the evening.
Solar interpretation
Solar is the clearest growth story in U.S. renewable energy, but the details matter. A strong year for utility-scale solar does not automatically mean a strong year for residential solar, and a large solar capacity addition does not always translate into the same level of useful peak-period power. The most practical solar scorecard compares annual installations, generation, segment mix, state concentration, storage attachment, financing pressure, and interconnection delays.
Wind Energy Statistics: Mature Scale, Regional Strength, and Transmission Pressure
Wind remains one of the largest renewable electricity sources in the United States. Its story is different from solar. Wind is mature, geographically concentrated, and closely tied to transmission availability. The strongest wind markets are not simply the states with the most policy ambition; they are the states with high-quality wind resources, buildable land, experienced developers, supportive grid connections, and power markets that can absorb or export output.
Wind market benchmarks
• Wind generated about 425 billion kWh in the latest EIA electricity-source table, making it the largest renewable source in that generation mix.
• EIA’s 2025 update shows wind generation at about 464,000 GWh, up 3% year over year.
• Wind and solar together supplied about 17% of U.S. electricity in 2025, showing how wind now works beside solar rather than as a separate renewable story.
• Texas ranked as the leading wind generation state in the workbook’s regional leadership rows, reflecting its large wind fleet and ERCOT market scale.
• Iowa ranked among the top wind generation states and also has one of the highest renewable electricity shares in the country.
• Oklahoma ranked as another top wind state, showing the importance of the southern Plains resource corridor.
• Kansas, Illinois, Minnesota, Colorado, New Mexico, and North Dakota are also important wind markets because the central U.S. offers strong resource quality and large project sites.
• Wind growth faces a different set of constraints from solar, including local siting limits, turbine supply, permitting, transmission availability, and repowering economics.
• Offshore wind remains strategically important for East Coast clean energy targets, but the market faces cost resets, contract renegotiations, port constraints, and project-delivery risk.
• Wind repowering is increasingly relevant because older projects can produce more electricity with newer turbines, better equipment, and improved operations.
| Wind signal | What to measure | Why it matters |
|---|---|---|
| Generation scale | Wind MWh and share of U.S. electricity | Wind’s actual contribution to the grid. |
| State concentration | Top wind states and regional clusters | Where wind economics and resources are strongest. |
| Transmission access | Congestion, curtailment, queue delays | Whether high-resource wind can reach demand centers. |
| Repowering | Older fleet size and upgrade economics | Growth potential without entirely new sites. |
Wind interpretation
Wind is not a weak technology story; it is a location and infrastructure story. The best wind resources often sit far from the largest demand centers, so transmission determines how much value wind can deliver. State renewable rankings can also be misleading unless they separate absolute generation from percentage share. Texas can lead in total wind output, while Iowa or South Dakota can show a much higher renewable share of total in-state generation.
Hydropower, Biomass, and Geothermal: Stable Renewable System Assets
Solar and wind dominate growth discussions, but the U.S. renewable energy market also depends on mature renewable sources. Hydropower, biomass, and geothermal do not usually add capacity at the same pace as solar, but they provide regional value, operational diversity, and in some cases more stable generation profiles.
Mature renewable benchmarks
• Hydropower generated about 240 billion kWh in the EIA electricity-source table and represented about 5.7% of U.S. utility-scale electricity generation.
• Washington generated about 71.1 TWh of renewable electricity in the 2024 state benchmark and remains one of the most important hydropower states.
• Oregon, Idaho, Montana, and other western states rely on hydropower as a major part of their renewable generation profiles.
• Hydropower output can vary with precipitation, snowpack, drought, reservoir management, and competing water needs, so its capacity and generation should be evaluated separately.
• Geothermal remains a small share of total U.S. generation but has strategic value because it can produce steady output in suitable western resource areas.
• California, Nevada, Utah, and other western states are important geothermal markets because the resource is geographically concentrated.
• Biomass and waste-to-energy are smaller renewable categories but can support local power systems, industrial sites, and waste-management strategies.
• The residual EIA renewable generation categories, including biomass and geothermal, account for the remaining renewable output after wind, hydropower, and solar.
• These mature renewable sources help diversify the clean power mix, even if they are not the primary source of annual growth.
| Source | Where it matters most | Strength | Constraint |
|---|---|---|---|
| Hydropower | Pacific Northwest and western river systems | Large renewable output and flexibility | Drought and water-management risk |
| Geothermal | Western resource states | Steady output and reliability value | Limited resource geography |
| Biomass | Local and industrial power systems | Dispatchable renewable fuel use | Feedstock, emissions, and cost questions |
Mature renewable interpretation
Hydropower, biomass, and geothermal should not be treated as outdated categories. They are different system assets. Hydropower can provide flexibility but is weather-sensitive. Geothermal can provide steadier generation but is geographically limited. Biomass and waste-to-energy can serve local or industrial roles but face feedstock and emissions questions. A balanced renewable market article should separate fast-scaling technologies from stable regional resources.
Clean Power Capacity and Investment: What Is Being Built
Capacity statistics show where the U.S. energy system is investing. They do not prove that every megawatt is immediately delivering electricity, but they show what developers, utilities, corporate buyers, and financiers are preparing to bring onto the grid.
Capacity and investment benchmarks
• American Clean Power reported 49 GW of new clean power capacity deployed in 2024.
• That 2024 clean power deployment represented 33% year-over-year growth in new capacity additions.
• The U.S. operating clean energy fleet exceeded 313 GW in 2024.
• Clean power projects were operating in all 50 states, showing that renewable energy is now a nationwide infrastructure category.
• Clean power represented about 93% of new U.S. electricity capacity additions in 2024.
• The operating clean power fleet was reported as powering the equivalent of about 79 million homes.
• Energy storage capacity in the clean power fleet was reported as enough to power the equivalent of 19 million homes during peak-hour conditions.
• ACP reported more than 320 GW of installed clean power capacity by Q1 2025, with 7.4 GW of new capacity installed during that quarter.
• Q2 2025 utility-scale clean power deployments exceeded 11 GW in the workbook benchmark, with associated investment value of about $15.2 billion.
• EIA’s planned 2026 capacity mix shows solar, battery storage, and wind accounting for the large majority of planned utility-scale additions.
| Metric | What it tells you | What it does not tell you |
|---|---|---|
| Installed capacity | How much clean power infrastructure exists | Whether every asset is producing at full value. |
| Annual additions | How fast the market is building | Whether grid connection is keeping up. |
| Generation | How much electricity is actually produced | How much more could be produced without curtailment. |
| Pipeline | What developers want to build | Which projects will actually reach commercial operation. |
| Interconnection queue | Where demand for grid connection is concentrated | Which projects will survive cost and timing studies. |
Capacity interpretation
Capacity additions are important because they show where capital is flowing, but they should not be confused with delivered electricity. A project can be announced, financed, built, interconnected, curtailed, or delayed at different points in the development cycle. The most useful capacity analysis compares annual additions, operating fleet size, generation output, interconnection status, transmission availability, and storage pairing.
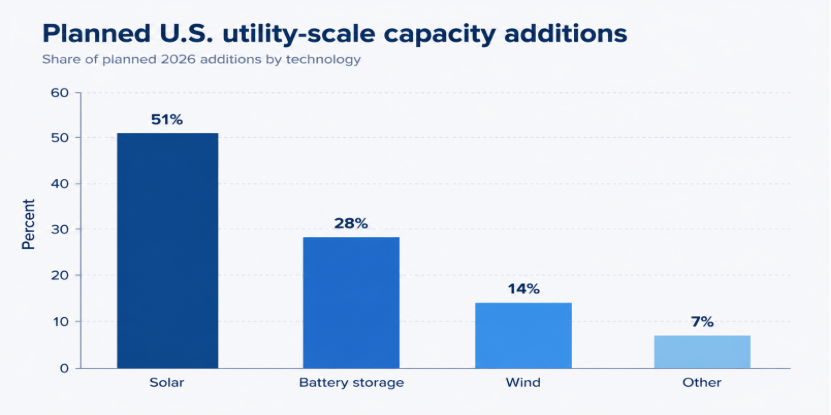
Figure 3. Planned capacity additions show where infrastructure is being built, but generation and interconnection data are needed to understand actual power-system impact.
Regional Renewable Energy Intelligence
The U.S. renewable energy market is regional by design. Resource quality, land availability, electricity demand, policy, grid structure, wholesale markets, water conditions, and transmission constraints vary sharply across states. A national average can show the direction of the market, but regional data explains how the market actually works.
Regional and state-level benchmarks
• Vermont had a renewable electricity share of about 99.8% in the 2024 state benchmark table, although its total generation volume was small at about 2.3 TWh.
• South Dakota generated about 81.6% of its electricity from renewables in the 2024 state benchmark, reflecting the strength of wind and hydro resources in a smaller power market.
• Washington generated about 71.1 TWh of renewable electricity in 2024, representing about 69.5% of its in-state generation and 7.33% of U.S. renewable output.
• Texas generated the largest absolute volume of renewable electricity in the state benchmark table, reflecting the scale of its wind, solar, and increasingly storage-heavy ERCOT market.
• California remains a defining solar and storage market because its high solar penetration creates midday surplus, evening ramp needs, and curtailment challenges.
• Iowa, Kansas, Oklahoma, and other central states show how wind can dominate state renewable generation when resource quality and project economics align.
• Florida, Georgia, North Carolina, and the broader Southeast show how utility-scale solar can expand even in regions that historically relied more heavily on gas, coal, and nuclear generation.
• Nevada, Arizona, New Mexico, and Utah are high-resource solar states where utility-scale solar and storage economics are central to future growth.
• New York, New Jersey, Massachusetts, and other Northeast markets depend more heavily on policy targets, offshore wind procurement, transmission upgrades, and distributed solar programs.
• The Pacific Northwest remains renewable-heavy because of hydropower, but that strength is exposed to water-year variability and regional load growth.
| Region | Leading renewable sources | Market implication |
|---|---|---|
| Texas / ERCOT | Wind, solar, storage | Largest flexible clean-power growth market with fast demand growth. |
| California / CAISO | Solar, storage, distributed solar | Why storage and curtailment management matter. |
| Midwest and Plains | Wind | Strong generation region, but transmission is critical. |
| Southwest | Solar, storage, geothermal in selected states | High-resource region for utility-scale solar and storage. |
| Pacific Northwest | Hydropower, wind | Renewable-heavy but weather-sensitive. |
| Southeast | Utility-scale solar | Solar is scaling in traditionally fossil-heavy markets. |
| Northeast | Offshore wind, hydro imports, distributed solar | Policy-led market with transmission and cost challenges. |
Regional readout
Regional renewable energy intelligence is one of the highest-value parts of this article. Texas and California often dominate clean-power headlines, but renewable leadership has several forms. Texas leads by scale. California leads in solar-storage integration. Iowa and South Dakota lead by renewable share. Washington leads through hydropower volume. The Southeast shows utility-scale solar growth in historically fossil-heavy markets. The Northeast shows policy-driven procurement and transmission pressure.
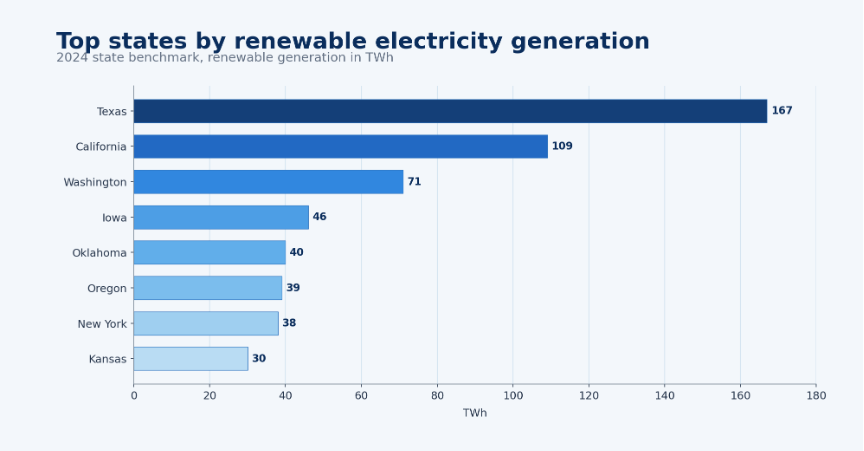
Figure 4. State renewable generation volumes show which markets deliver the most clean electricity, not only which states have high renewable percentages.
Corporate Procurement and Utility Demand
Renewable energy demand is no longer only policy-driven. Utilities, corporations, municipalities, data centers, manufacturers, universities, and community choice buyers all influence where renewable projects are built. Procurement data matters because it shows whether clean energy capacity has a buyer, a contract structure, and a route into the power market.
Procurement benchmarks and market signals
• Corporate power purchase agreements remain a major route for large buyers to secure renewable electricity and hedge long-term energy exposure.
• Virtual power purchase agreements allow companies to support renewable projects even when the physical electricity is delivered into a different grid region.
• Utility procurement remains critical because regulated utilities and competitive power markets both shape the pace of solar, wind, storage, and transmission development.
• Data-center demand is one of the fastest-growing electricity demand drivers and is increasingly tied to clean energy procurement strategies.
• Manufacturing load growth in selected states adds another demand layer for utilities planning renewable resources and capacity adequacy.
• Green tariffs, renewable energy certificates, and community solar subscriptions all allow buyers to participate in renewable energy without owning physical generation assets.
• Procurement quality matters: a renewable purchase that supports new capacity has a different market impact from a certificate-only claim tied to older generation.
• State-level procurement rules can shape whether corporate demand flows into local projects, utility programs, or national certificate markets.
| Procurement model | Who uses it | What it signals |
|---|---|---|
| Utility PPA | Utilities and developers | Core route for grid-scale renewable capacity. |
| Corporate PPA | Large companies and developers | Direct buyer demand for new clean power. |
| Virtual PPA | Corporate buyers | Supports projects financially even without physical delivery. |
| Green tariff | Utility customers | Lets customers buy clean energy through utility programs. |
| Community solar | Households, renters, small businesses | Expands access where rooftop ownership is not practical. |
| REC purchase | Companies and institutions | Tracks renewable attributes but may vary in additionality. |
Procurement interpretation
Corporate and utility procurement should be treated as demand-side infrastructure. Renewable projects scale faster when buyers, contracts, interconnection, tax credits, and transmission line up. The practical question is not only how many companies have clean energy goals. It is whether those goals translate into new projects, useful grid capacity, hourly matching, local economic benefits, and durable electricity supply.
Storage, Transmission, and Grid Bottlenecks
The next stage of U.S. renewable growth depends as much on grid readiness as on renewable technology cost. Solar and wind can be built quickly in high-resource areas, but their value depends on interconnection, transmission capacity, storage, market rules, and the ability to manage variable output.
Grid and storage benchmarks
• Battery storage is expected to represent about 28% of planned U.S. utility-scale capacity additions in 2026, second only to solar in the EIA planned-capacity mix.
• Energy storage in the ACP clean power fleet was reported as enough to power the equivalent of 19 million homes during peak-hour conditions.
• Solar-plus-storage is increasingly important because storage can shift daytime solar output into evening demand periods.
• Interconnection queues remain a major bottleneck because many proposed solar, wind, and storage projects must wait for grid studies, upgrade cost estimates, and final approvals.
• Transmission constraints can reduce the value of renewable generation even when projects are operational, especially in wind-rich and solar-rich regions far from demand centers.
• Curtailment is a growing signal in high-renewable markets because it shows when clean electricity is available but cannot be fully used or delivered.
• Capacity additions without storage can increase midday solar supply but may not solve evening reliability needs.
• Regional transmission organizations and independent system operators increasingly influence renewable value through queue reform, market design, capacity accreditation, and congestion pricing.
• The most useful grid-readiness benchmark combines storage capacity, transmission availability, interconnection time, curtailment, capacity factor, and load-growth forecasts.
| Bottleneck | Primary metric | Likely owner |
|---|---|---|
| Interconnection | Queue size, study time, upgrade cost | Grid operators, utilities, developers |
| Transmission | Congestion, transfer capacity, project lead time | RTOs, utilities, regulators |
| Storage readiness | Battery capacity, duration, solar pairing | Developers, utilities, grid planners |
| Curtailment | MWh curtailed and affected regions | Grid operators and market planners |
| Permitting | Approval timelines and local restrictions | State agencies, counties, federal agencies |
| Load growth | Peak demand and annual electricity forecasts | Utilities, large customers, regulators |
Grid interpretation
Grid readiness is the practical test of renewable scale. The next question is not whether the U.S. can build solar panels, wind turbines, and batteries. It is whether the grid can connect them quickly, move their output across regions, store their energy when needed, and maintain reliability during peak demand. Storage, transmission, and interconnection should be treated as core renewable market metrics, not supporting details.
Policy, Tax Credits, and State Clean Energy Standards
Policy shapes the U.S. renewable energy market, but it does not affect every technology in the same way. Utility-scale solar, residential solar, wind, offshore wind, energy storage, domestic manufacturing, community solar, and transmission each respond to different incentives, rules, and approval pathways.
Policy signals to track
• Federal tax credits remain central to the economics of solar, wind, storage, and clean energy manufacturing.
• Policy uncertainty can delay projects even when demand exists, because developers need visibility on tax-credit eligibility, domestic-content rules, interconnection costs, and contract timing.
• State renewable portfolio standards and clean energy standards influence utility procurement and long-term planning in many markets.
• States with 100% clean or renewable energy goals create long-term demand signals, but their progress depends on project delivery, transmission, storage, and affordability.
• Net metering policy changes can sharply affect residential solar economics and installer activity.
• Community solar depends heavily on state program design, subscriber rules, bill-credit rates, and program caps.
• Offshore wind procurement depends on state targets, power contracts, port infrastructure, supply-chain development, and cost recovery rules.
• Domestic manufacturing incentives can influence where solar modules, batteries, and related components are produced, which can affect project costs and supply-chain resilience.
• Transmission policy and regional planning reforms can be just as important as generation incentives because many renewable projects need new grid capacity to deliver power.
| Policy area | What it affects | Market impact |
|---|---|---|
| Federal tax credits | Project economics and manufacturing | Can accelerate solar, wind, storage, and domestic supply chains. |
| State clean energy standards | Utility procurement and long-term planning | Create durable demand signals. |
| Net metering | Residential solar economics | Can speed or slow rooftop solar adoption. |
| Community solar rules | Access for renters and small customers | Determines whether shared solar can scale. |
| Transmission reform | Grid connection and deliverability | Can unlock projects stuck behind network limits. |
Policy interpretation
Policy should be read as a market signal, not only a legal framework. A strong tax credit can support project economics, but it cannot solve every interconnection problem. A state clean energy target can create demand, but it does not automatically create transmission or storage. The most useful policy analysis links incentives to actual deployment, cost, permitting, grid connection, and customer affordability.
Renewable Energy Jobs and Economic Impact
Renewable energy statistics should not stop at electricity and capacity. Jobs, manufacturing, construction, tax revenue, land lease payments, port investment, and supply-chain activity explain why states compete for clean energy projects. Economic impact also helps readers understand why renewable energy is both a power-sector story and a regional-development story.
Economic-impact benchmarks and signals
• Clean energy projects create construction jobs during development and more specialized operations and maintenance jobs after commissioning.
• Solar employment is spread across installation, development, sales, engineering, manufacturing, operations, and maintenance.
• Wind employment includes turbine manufacturing, project development, construction, technician services, blade repair, repowering, and operations.
• Battery storage adds jobs in project development, system integration, software, safety management, manufacturing, construction, and grid operations.
• Rural landowners can receive lease payments from wind and solar projects, which can diversify farm and ranch income.
• Local governments can receive property tax revenue or negotiated community benefits from utility-scale renewable projects.
• Manufacturing announcements in solar, batteries, inverters, and related components can reshape state-level economic development strategies.
• Offshore wind can create port, vessel, and supply-chain investment opportunities, although the market is exposed to cost and contract risk.
• Workforce availability can become a deployment constraint if project pipelines grow faster than qualified electricians, technicians, engineers, and construction crews.
| Impact area | Statistic type to use | Why it matters |
|---|---|---|
| Jobs | Clean energy, solar, wind, storage employment | Workforce scale and constraints. |
| Manufacturing | Factory announcements and capacity | Supply-chain localization. |
| Rural income | Lease payments and tax revenue | Local project value. |
| Infrastructure | Ports, transmission, substations | Enabling investment beyond generation. |
| Training | Technician and electrician demand | Whether the labor market can support deployment. |
Economic readout
The economic value of renewable energy is distributed unevenly. A state may gain construction jobs and tax revenue from utility-scale solar, while another gains factory investment, transmission work, or wind technician employment. A mature renewable market report should therefore connect capacity additions to local economic impact, workforce needs, supply-chain resilience, and regional competitiveness.
Renewable Energy Market Challenges and Bottlenecks
The U.S. renewable energy market is strong, but it is not frictionless. The reference-style way to read this section is as a risk diagnostic: what can stop capacity from becoming useful generation? The answer often lies in grid connection, financing, permitting, transmission, local opposition, supply chains, and demand timing.
Challenge benchmarks and risk signals
• Interconnection delays can keep renewable projects in queues even after developers secure sites, permits, and customers.
• Transmission shortages can strand wind or solar output in high-resource areas and increase congestion costs.
• Curtailment can rise when renewable output exceeds local demand or transmission capability during certain hours.
• Higher interest rates can pressure residential solar, utility-scale project finance, and corporate procurement economics.
• Policy uncertainty can delay project starts, especially when developers must interpret tax-credit timelines, domestic-content rules, and permitting requirements.
• Local opposition can slow wind, solar, transmission, and battery projects even when state or federal policy supports clean energy growth.
• Supply-chain disruptions can affect solar modules, inverters, transformers, batteries, turbines, and specialized grid equipment.
• Offshore wind faces higher cost exposure because projects require specialized vessels, ports, long development timelines, and large upfront capital commitments.
• Residential solar can slow when financing costs rise, net metering changes, or customer acquisition costs increase.
• A renewable market scorecard should separate temporary market slowdowns from structural constraints that limit long-term deployment.
| Risk area | Signal to measure | Why it matters |
|---|---|---|
| Interconnection delay | Queue age and withdrawal rate | Whether projects can reach operation. |
| Transmission shortage | Congestion and curtailment | Whether generation can reach load. |
| Financing pressure | Cost of capital and PPA pricing | Project economics. |
| Policy uncertainty | Rule changes and tax-credit timing | Developer confidence. |
| Local opposition | Permit denials and zoning restrictions | Siting risk. |
| Supply chain | Equipment lead times | Delivery risk. |
Risk interpretation
The most important risk is not whether renewable technologies work. The risk is whether projects can be financed, permitted, interconnected, transmitted, and integrated quickly enough to serve rising electricity demand. A market can report record capacity additions and still face reliability or cost problems if storage, transmission, and interconnection lag behind generation growth.
Renewable Energy Growth Diagnostic
The diagnostic model below connects renewable energy statistics to action areas.
| Problem area | Core signals to measure | Likely owner |
|---|---|---|
| Capacity growth | Solar, wind, and storage additions | Developers, utilities, investors |
| Generation output | Renewable electricity by source and state | Utilities, grid operators, analysts |
| Grid connection | Interconnection queue, transmission constraints, curtailment | RTOs, utilities, regulators |
| State leadership | Renewable share, total renewable generation, policy targets | State agencies and utilities |
| Storage readiness | Battery capacity, duration, solar-plus-storage share | Grid planners and developers |
| Policy support | RPS, clean energy standards, tax credits | Federal and state policymakers |
| Demand pressure | Load growth, data centers, electrification | Utilities and corporate buyers |
How to use the diagnostic
Each statistic belongs to a business question: where is renewable generation growing, which technologies are adding capacity, which states are leading, where is the grid constrained, and what signals show whether growth is durable? The best energy teams do not chase every headline. They build a scorecard that separates operating output from planned capacity, local resource strength from national averages, and market opportunity from grid bottlenecks.
90-Day Renewable Energy Benchmark Plan
Statistics become useful when they are translated into a measurement plan. A practical U.S. renewable energy review can be organized into a 90-day benchmark cycle rather than a vague market scan.
| Timing | What to do | Output |
|---|---|---|
| Days 1-30 | Build the baseline by technology, state, generation, capacity, policy, and electricity demand. | A national and state renewable benchmark map. |
| Days 31-60 | Compare solar, wind, hydro, storage, transmission, interconnection, and procurement signals. | An opportunity and bottleneck matrix. |
| Days 61-90 | Prioritize states, technologies, procurement channels, and grid risks by strategic value. | A renewable energy scorecard for investment, policy, or content strategy. |
Planning principle
The best renewable energy analysis compares external statistics against a defined use case. An investor may prioritize capacity additions and policy risk. A utility may prioritize generation, storage, and peak demand. A state agency may prioritize jobs, grid constraints, and local economic development. The benchmark plan should always connect statistics to a decision.
Metrics Energy Leaders Should Track
The final scorecard should be detailed enough to locate the market signal without becoming a vanity dashboard. These metrics are the minimum useful set for a mature U.S. renewable energy review.
| Metric | Why it matters |
|---|---|
| Renewable generation share | How much electricity renewables actually supply. |
| Total renewable generation | Measures delivered clean electricity, not just installed infrastructure. |
| Installed renewable capacity | Infrastructure scale and capital deployment. |
| Annual capacity additions | Current buildout momentum. |
| Solar capacity additions | Tracks the main U.S. capacity growth engine. |
| Wind generation and additions | Tracks the largest mature renewable generation source. |
| Battery storage capacity | Readiness to shift renewable output and support peak demand. |
| Capacity factor | How efficiently installed assets produce electricity. |
| Curtailment | Where renewable output cannot be fully used. |
| Interconnection queue volume | Future project demand and bottleneck risk. |
| Transmission availability | Whether clean power can reach demand centers. |
| PPA volume | Buyer demand and bankable procurement. |
| State policy targets | Long-term regulatory demand signals. |
| Renewable jobs and investment | Economic impact beyond electricity. |
| CO2 intensity | How generation mix affects emissions performance. |
Renewable Market Readiness Scorecard
A final readiness scorecard helps turn the statistics into planning signals. The U.S. renewable energy market can look strong in national capacity totals while still showing weaknesses in project timing, regional deliverability, storage coverage, transmission access, or demand matching.
| Readiness area | What to measure | Why it matters |
|---|---|---|
| Operating clean power | Renewable generation, capacity, and utilization | Whether installed assets are producing usable electricity. |
| Project pipeline | Planned solar, wind, storage, and transmission projects | Whether future growth is credible or still stuck in development. |
| Grid deliverability | Interconnection queues, curtailment, and transmission limits | Whether clean power can reach demand centers. |
| Storage readiness | Battery capacity, solar-plus-storage projects, and peak support | Whether renewables can support evening and reliability needs. |
| State policy depth | RPS targets, clean energy standards, incentives, and permitting | Whether growth has policy stability behind it. |
| Demand matching | Load growth, data centers, electrification, and corporate procurement | Whether renewable growth is aligned with electricity demand. |
Planning principle
The best use of the 300-plus-stat workbook is not to quote every number. It is to group the numbers by decision: which technologies are adding capacity, which resources are generating electricity, which states are structurally ahead, which bottlenecks are slowing deployment, and which indicators show whether the U.S. renewable market is ready for the next phase of demand growth.
United States Renewable Energy Market Statistics FAQ
Common questions
What percentage of U.S. electricity comes from renewable energy?
The 2024 state-level benchmark table used in the workbook places renewable electricity at about 22.5% of total U.S. generation. EIA’s latest electricity-source table shows renewables at 21.4% in its comparable national generation mix, while more recent outlook data points to about 24% in 2025 and 27% by 2027.
What is the largest renewable electricity source in the United States?
Wind is the largest renewable electricity source in the EIA electricity-source table, with about 425 billion kWh of generation. EIA’s 2025 update places wind generation at about 464,000 GWh, while utility-scale solar is growing faster from a smaller base.
Is solar or wind growing faster in the United States?
Solar is growing faster by annual capacity additions and recent generation growth. Utility-scale solar generation rose about 34% year over year in 2025, while wind generation rose about 3%, but wind still produced more total renewable electricity.
Which U.S. states lead renewable energy production?
Texas and California lead in absolute renewable electricity scale, while states such as Washington, Iowa, South Dakota, Vermont, Kansas, and Oklahoma stand out when renewable share is measured against total in-state electricity generation.
Why is battery storage important for renewable energy?
Battery storage helps shift solar and wind output into hours when electricity demand is higher or renewable production is lower. EIA expects battery storage to represent about 28% of planned 2026 utility-scale capacity additions, making storage a central part of the next clean-power build cycle.
How does renewable capacity differ from renewable generation?
Capacity measures the size of installed infrastructure, usually in MW or GW. Generation measures actual electricity produced, usually in MWh, GWh, or TWh. A project can add capacity but still produce less electricity than expected if it faces curtailment, low resource conditions, or grid limits.
What are the biggest challenges for U.S. renewable energy?
The largest challenges are interconnection delays, transmission constraints, storage needs, permitting timelines, local opposition, financing costs, and policy uncertainty. These issues determine whether renewable projects move from pipeline statistics into operating generation.
What metrics should energy leaders track?
Energy leaders should track renewable generation share, installed capacity, annual additions, solar and wind output, storage capacity, curtailment, interconnection queues, transmission availability, state policies, corporate procurement, jobs, investment, and emissions intensity.
Final Takeaway
United States renewable energy performance depends on five systems working together: generation growth, technology mix, state and regional leadership, grid and storage readiness, and policy and investment durability. The statistics show that renewable energy is already a major part of the U.S. electricity system, but they also show why the market cannot be measured by one number.
If solar capacity is rising but interconnection delays are growing, the issue is grid connection. If wind resources are strong but transmission is limited, the issue is deliverability. If a state has a high renewable share but small total generation, the issue is scale. If corporate demand is rising but projects lack transmission or storage, procurement alone will not solve the market constraint.
For energy leaders, the practical goal is not only to count renewable capacity. The goal is to understand which renewable sources are actually generating electricity, which states are scaling fastest, where grid constraints are emerging, and whether storage, transmission, policy, and demand growth are moving together. A mature U.S. renewable energy benchmark should therefore treat clean power as a system: built capacity, delivered generation, regional resource quality, buyer demand, and grid readiness all have to be measured together.