Brazil’s solar energy market has moved from early adoption into national scale. Solar now affects capacity planning, consumer bills, project finance, regional development, and the way utilities manage two-way electricity flows.
The strongest statistics show why solar deserves its own scorecard. Installed capacity, distributed generation, utility-scale projects, investment, jobs, regional adoption, and grid readiness all point to different parts of the same market story.
The sections below use statistics as decision signals rather than as a raw list. Each number is placed beside its market meaning so capacity, generation, investment, jobs, regional adoption, and grid readiness can be read together.
Brazil Solar Energy Market Statistics: Key Benchmarks
These are the headline benchmarks that frame Brazil’s solar market. They show the scale of operating capacity, the weight of distributed generation, the size of the utility-scale pipeline, and the reason grid readiness now matters as much as new project announcements.
The numbers that define Brazil’s solar market
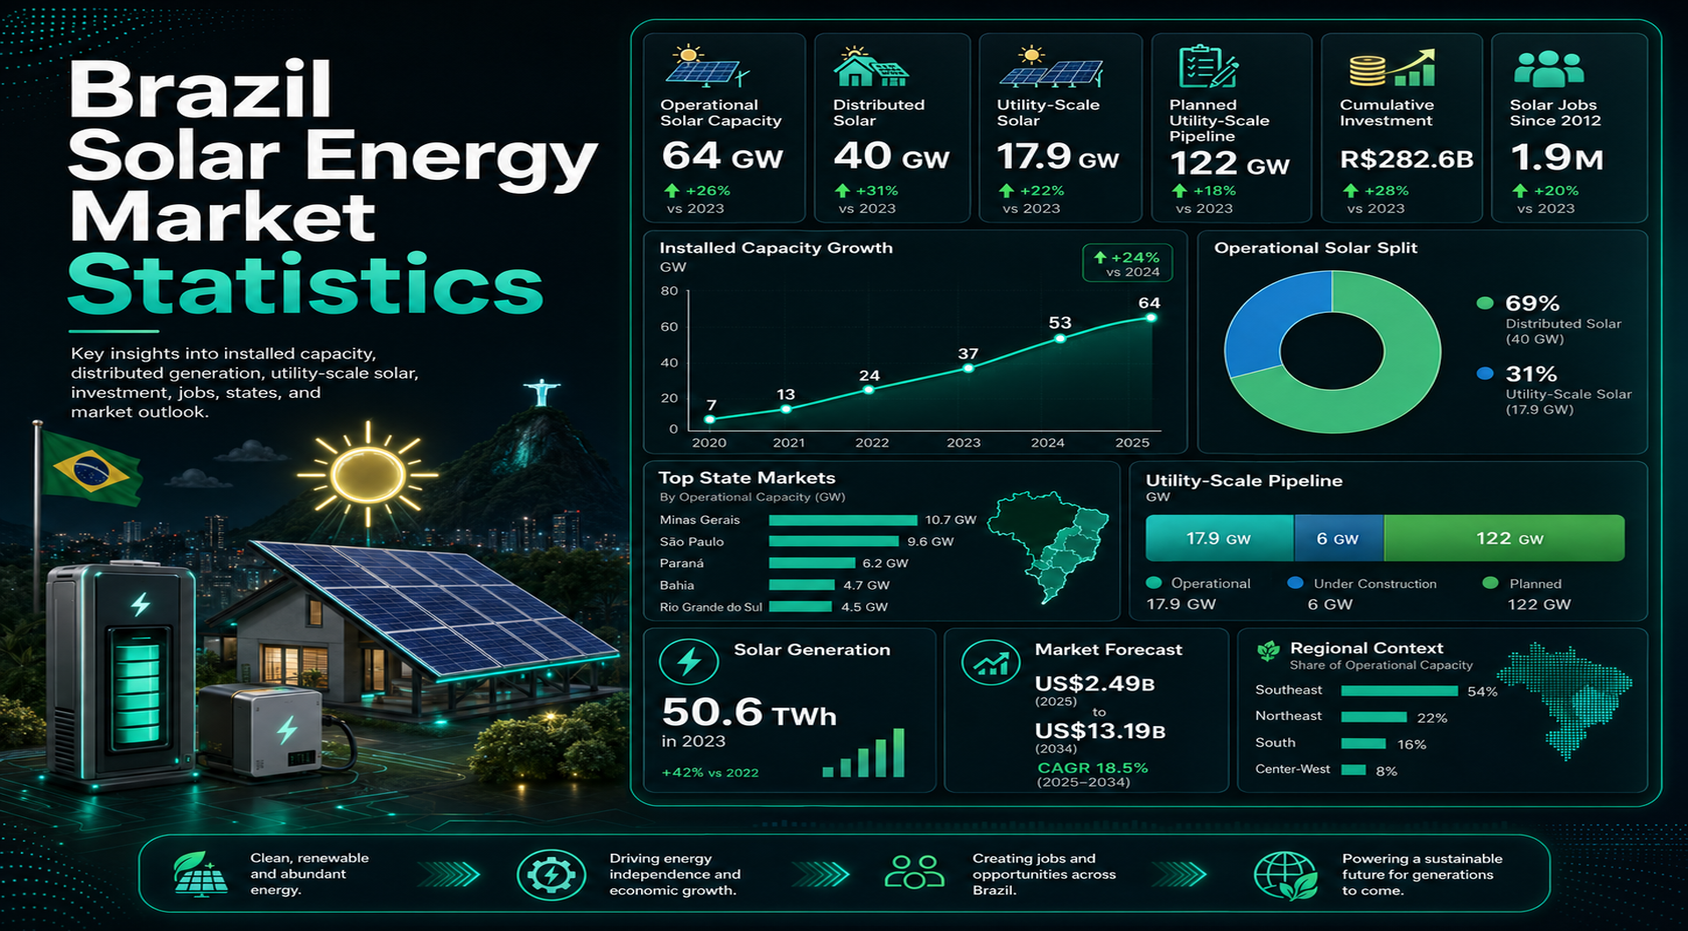
• Brazil’s 64 GW of operational solar PV capacity shows that solar is now part of national power planning, not a niche renewable category.
• The 10.6 GW added in 2025 matters because each new wave of capacity also creates connection, financing, and operational questions.
• Solar’s 24.5% share of Brazil’s electricity generation complex places PV close to the center of long-term system planning.
• Distributed solar reached 40 GW by June 2025, making rooftop and small-scale adoption the largest visible layer of the market.
• Utility-scale solar reached 17.9 GW by June 2025, giving centralized projects a clear role beside rooftop and commercial systems.
• ANEEL’s 122 GW planned utility-scale pipeline shows deep developer interest, but it also raises the practical question of how much can connect and finance on time.
• Only 6 GW of planned utility-scale solar was under construction in June 2025, so the pipeline should be read as opportunity, not guaranteed supply.
• Solar PV generated 50.6 TWh in 2023, proving that the market is no longer only an installed-capacity story.
• ABSOLAR’s R$32.9 billion in new 2025 investment and R$282.6 billion since 2012 show how solar has become an economic sector as well as an energy source.
• The sector’s 319,800 new 2025 jobs and roughly 1.9 million cumulative jobs since 2012 make labor capacity part of the solar story.
• The estimated 94.4 million tons of avoided CO2 connects solar growth with climate, energy security, and fuel-displacement benefits.
• Forecasts from US$2.49 billion in 2025 to US$13.19 billion by 2034 are positive, but they depend on grid readiness, financing, and policy stability.
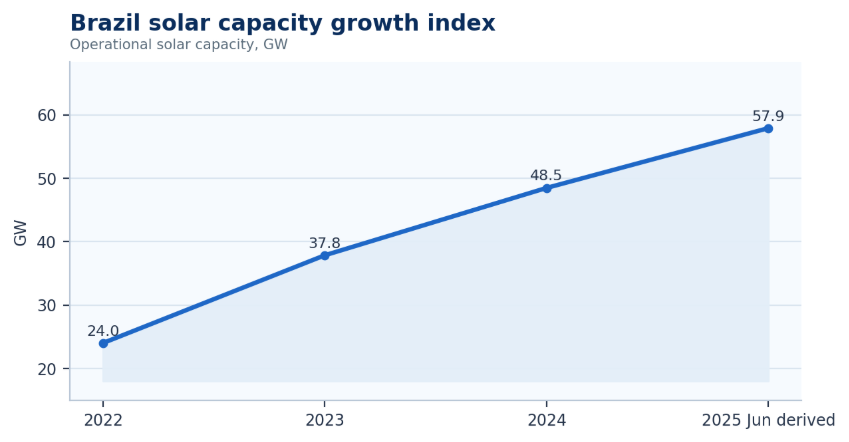
Figure 1. Brazil solar capacity growth shows how quickly solar moved from an emerging renewable segment into a major electricity-market category.
Why Brazil Solar Now Carries Market Stakes
Brazil’s solar expansion now matters because PV is large enough to influence power planning, consumer bills, project finance, distribution networks, and regional development. A change in connection rules, project delivery, or grid absorption can now affect gigawatts of capacity, not only a small group of pilot projects.
That is why the strongest reading does not stop at total installed GW. It compares operating capacity with generation, state-level adoption, under-construction projects, investment flow, financing conditions, and the grid’s ability to absorb new output.
| Solar signal | What it measures | Why it matters |
|---|---|---|
| Installed capacity | Overall solar scale | Shows solar’s power-system role |
| Annual additions | Deployment momentum | Shows whether growth is accelerating |
| Distributed solar | Rooftop and small-scale adoption | Shows consumer and business participation |
| Utility-scale solar | Centralized project delivery | Shows large-project investment strength |
| Solar generation | Actual electricity output | Shows usable power contribution |
| Project pipeline | Future development pressure | Shows grid and financing needs |
Distributed Solar Statistics
Distributed solar is where Brazil’s energy transition becomes visible at household, business, farm, and public-building level. A rooftop system changes the customer’s relationship with the grid, while a small commercial system can turn electricity from a monthly cost into a long-term planning variable.
The growth is positive, but it also changes the work of distribution utilities. Networks that were designed mainly for one-way delivery now need better visibility, connection planning, voltage management, and customer-level data.
• Distributed solar reached 40 GW by June 2025, more than double the utility-scale base and large enough to change distribution planning.
• Distributed solar was about 2.2 times utility-scale solar capacity at mid-2025, so any market review that ignores rooftop and small-scale systems is incomplete.
• Distributed generation was expected to reach 45.3 GW by the end of 2025, reinforcing its central role in new solar deployment.
• Distributed generation was expected to contribute 8.5 GW of 2025 solar expansion, compared with 4.6 GW from centralized solar in the same outlook.
• MMDG solar generation rose from 20 GWh in 2015 to 29,813 GWh in 2023, showing how consumer-side generation became a real supply source.
• Solar made up 96.3% of MMDG generation in 2023, meaning Brazil’s distributed-generation market is overwhelmingly a PV market.
• Residential solar adoption reflects household payback economics, while commercial adoption reflects cost control and long-term operating planning.
• Rural and agribusiness solar growth matters because farms often have land, electricity demand, and a clear incentive to reduce operating costs.
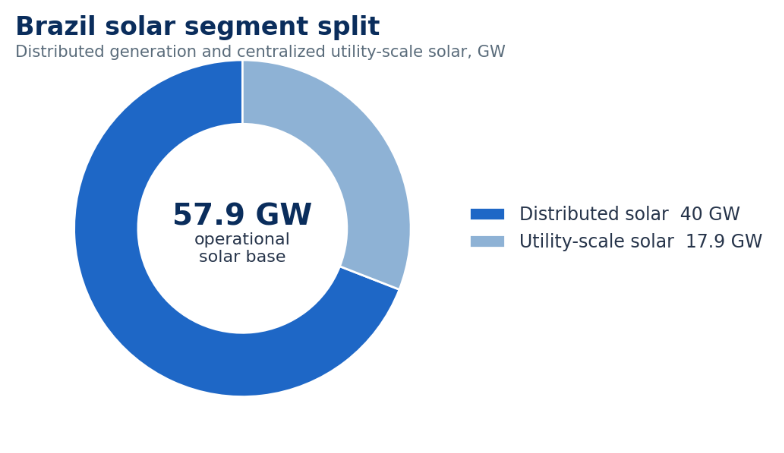
Figure 2. Distributed and utility-scale solar should be reviewed separately because rooftop systems and solar farms grow through different economics, policy rules, and grid conditions.
| Distributed signal | What it shows | Market meaning |
|---|---|---|
| Residential systems | Household adoption | Solar becomes a consumer energy choice |
| Commercial systems | Business cost control | Companies manage electricity costs |
| Rural systems | Agribusiness use | Solar spreads beyond urban rooftops |
| Consumer units | Connected participants | Adoption becomes more democratic |
| Compensation rules | Payback economics | Regulation can speed or slow adoption |
Utility-Scale Solar And Pipeline Statistics
Utility-scale solar follows a different logic from distributed generation. It is the large-project side of the market, where developers need land, grid access, project finance, offtake agreements, environmental approvals, transmission capacity, and execution discipline.
• Operating utility-scale solar reached 17.9 GW by June 2025, enough to make centralized PV a major part of the supply picture.
• ANEEL’s 122 GW planned pipeline signals strong developer appetite, but the delivery path depends on connection, finance, and offtake.
• The planned pipeline was about 6.8 times the operating utility-scale base, which makes project quality more important than headline volume.
• Only 6 GW, or about 4.9% of the planned pipeline, was under construction in June 2025, highlighting the difference between registration and delivery.
• Centralized solar was forecast to reach 21.9 GW by the end of 2025 in one outlook, compared with 17.9 GW operating at midyear.
• New solar PV power plants represented 147 plants and 5,630 MW of capacity in 2024 in one project summary.
• Solar and wind accounted for 91% of Brazil’s new power capacity added in 2024, showing that variable renewables dominated new-build activity.
• The main utility-scale risk is whether projects can secure connection, financing, offtake, and transmission capacity on schedule.
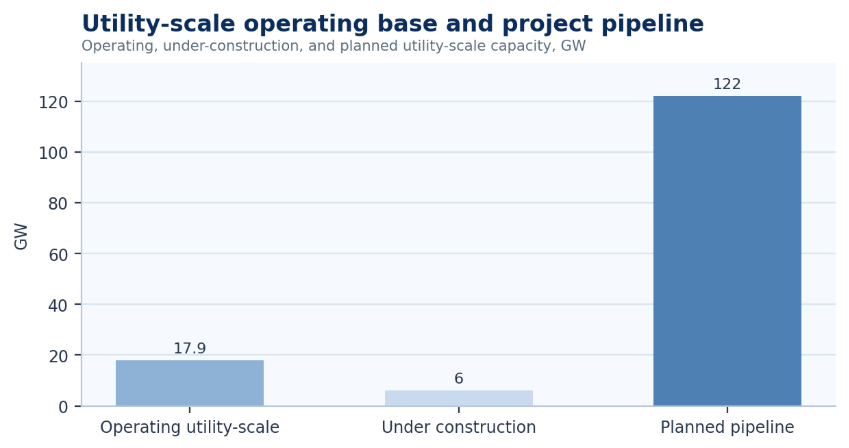
Figure 3. Brazil’s utility-scale solar pipeline shows strong developer interest, but future delivery depends on transmission access, connection approvals, financing, and execution.
| Utility-scale signal | What it measures | Why it matters |
|---|---|---|
| Operational capacity | Solar farms producing | Shows current maturity |
| Planned pipeline | Projects under development | Shows future pressure |
| Grid connection | Export ability | Shows delivery risk |
| PPA activity | Buyer confidence | Shows bankability |
| Regional concentration | Project locations | Shows where land and grid align |
Solar Generation And Electricity Mix Statistics
Capacity shows what Brazil has built; generation shows how much electricity those systems actually deliver. Both numbers matter because investors, utilities, and policymakers need to know whether installed PV is becoming usable power at the right time and in the right places.
• Solar PV generation reached 50.6 TWh in 2023, giving PV a measurable role in the electricity actually supplied.
• Distributed solar PV generated 29.8 TWh in 2023, showing that rooftop and small-scale systems now contribute meaningful output.
• MMDG solar output rose from 20 GWh in 2015 to 29,813 GWh in 2023, one of the clearest signals of long-term distributed adoption.
• Solar represented 96.3% of MMDG generation in 2023, underlining that Brazil’s distributed-generation market is mainly a solar market.
• Generation data matters because capacity does not become market value until electricity is consumed, exported, stored, or dispatched.
• Solar’s role beside hydro and wind is especially important because Brazil’s system must balance seasonal resources, demand patterns, and grid constraints.
• A capacity-heavy market still needs generation monitoring, curtailment tracking, and better forecasting to turn installed assets into reliable value.
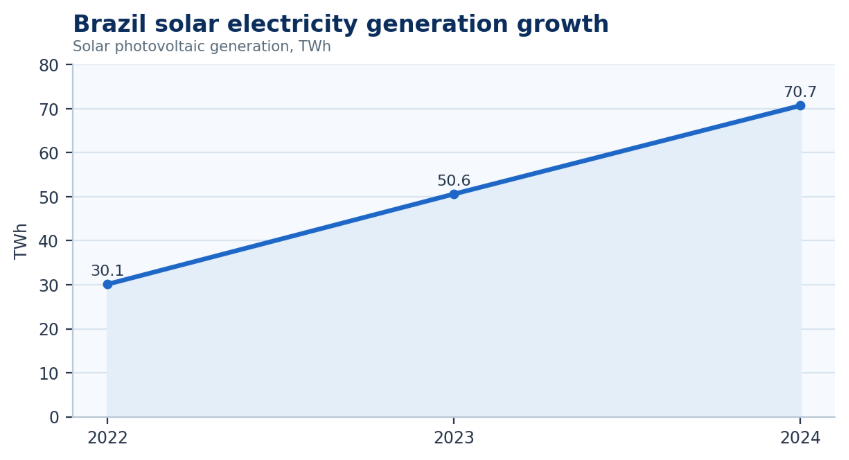
Figure 4. Solar generation growth matters because installed capacity only becomes market value when systems produce usable electricity for the grid or on-site consumption.
Regional And Country Solar Statistics
Brazil’s solar market is not geographically uniform. State-level performance reflects electricity demand, irradiation, rooftop potential, agribusiness activity, land availability, distribution-grid conditions, financing, and local project development. Regional comparison also helps explain why Brazil is one of Latin America’s most important solar markets, but not the only one with strong PV fundamentals.
• São Paulo was estimated at about 5.8 GW of distributed solar capacity, supported by large electricity demand and strong commercial rooftop potential.
• Minas Gerais’ 4.9 GW distributed-solar base shows why the state remains a benchmark for rooftop and small-scale adoption.
• Paraná and Rio Grande do Sul, at about 3.7 GW and 3.4 GW, show that strong distributed adoption is not limited to the Southeast.
• Mato Grosso’s 2.6 GW reflects the role of farms, logistics, irrigation, and regional business demand in solar adoption.
• Bahia and Goiás remain important because the market story combines distributed solar, high irradiation, land availability, and large-project potential.
• The Northeast is especially important for utility-scale solar because irradiation and land availability support centralized project development.
• Brazil should be compared with Chile and Mexico when reviewing Latin American solar because each market has different grid, policy, demand, and financing conditions.
• Regional statistics are most useful when they explain why adoption happens, not only where capacity is located.
Figure 5. State-level solar adoption shows that Brazil’s market is shaped by irradiation, demand, land availability, financing, policy, and grid access.
| State / region | Solar strength | What it means |
|---|---|---|
| Minas Gerais | Distributed leadership | Strong consumer, rural, and business adoption |
| São Paulo | Rooftop demand | Large electricity market supports expansion |
| Bahia | Utility-scale strength | Irradiation and land support solar farms |
| Rio Grande do Sul | Distributed adoption | Homes and businesses are active users |
| Northeast region | Centralized projects | Strong resource quality supports scale |
| Center-West | Agribusiness solar | Farms use solar for cost control |
Solar Investment, Jobs, And Economic Impact
Solar statistics are also economic statistics. Every gigawatt of new capacity creates demand for design, sales, financing, engineering, installation, construction, monitoring, grid services, and maintenance. That makes Brazil’s solar market a jobs and investment story as well as an electricity story.
• ABSOLAR reported more than R$32.9 billion in new solar investment in 2025, showing that the sector remains a major destination for capital.
• Cumulative solar investment reached about R$282.6 billion since 2012, making PV one of Brazil’s most visible energy-transition investment channels.
• The sector was associated with about 319,800 new green jobs in 2025, reinforcing solar’s role in installation, engineering, construction, and services.
• Cumulative solar jobs reached roughly 1.9 million since 2012, showing that the sector has built a broad employment footprint.
• Solar helped avoid about 94.4 million tons of CO2, linking market growth with climate and energy-security benefits.
• Distributed solar supports local installers and small businesses, while utility-scale solar supports construction, operations, and project-finance activity.
• Investment quality should be judged by operating assets, generation output, local jobs, and grid integration rather than by headline capital alone.
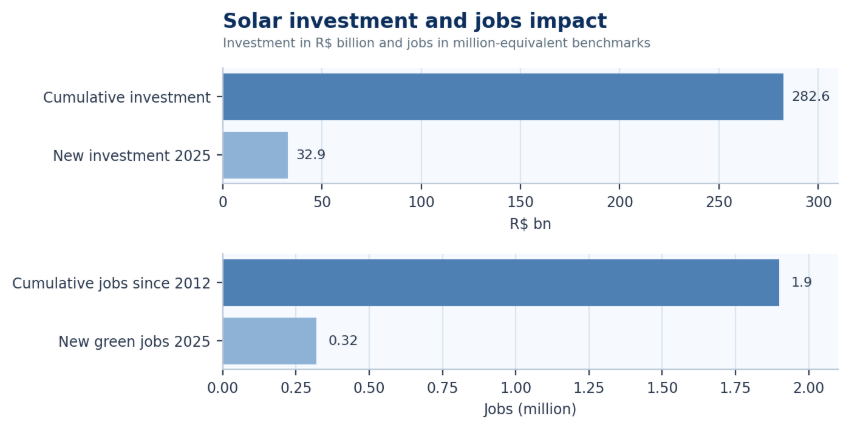
Figure 6. Solar investment and jobs statistics show why Brazil solar now links electricity transition with regional economic development.
| Economic signal | What it measures | Why it matters |
|---|---|---|
| Investment | Capital entering solar | Shows market confidence |
| Jobs | Employment linked to deployment | Shows labor-market impact |
| Tax revenue | Public-sector return | Shows fiscal contribution |
| Installer activity | Local business participation | Shows distributed economic value |
| O&M work | Long-term service demand | Shows recurring employment |
Policy, Grid, Curtailment, And Market Rules
Brazil’s next solar challenge is not only building more panels. The market also needs connection capacity, distribution upgrades, transmission expansion, storage, forecasting, and stable rules that keep projects financeable while protecting grid reliability.
• Brazil’s 122 GW planned utility-scale pipeline shows strong interest, but it also raises questions about interconnection, transmission, and project sequencing.
• Only 6 GW of planned utility-scale solar was under construction in June 2025, showing why pipeline data must be separated from near-term delivery.
• Distributed solar rules matter because compensation changes can quickly affect consumer payback and installation timing.
• Connection approvals shape how fast both rooftop systems and solar farms become operating capacity.
• Transmission capacity determines whether utility-scale projects can export generation from high-resource regions to demand centers.
• Curtailment risk becomes more important as solar output rises faster than local grid absorption and flexibility.
• Storage, forecasting, and hybrid projects can help convert solar growth into more reliable electricity-market value.
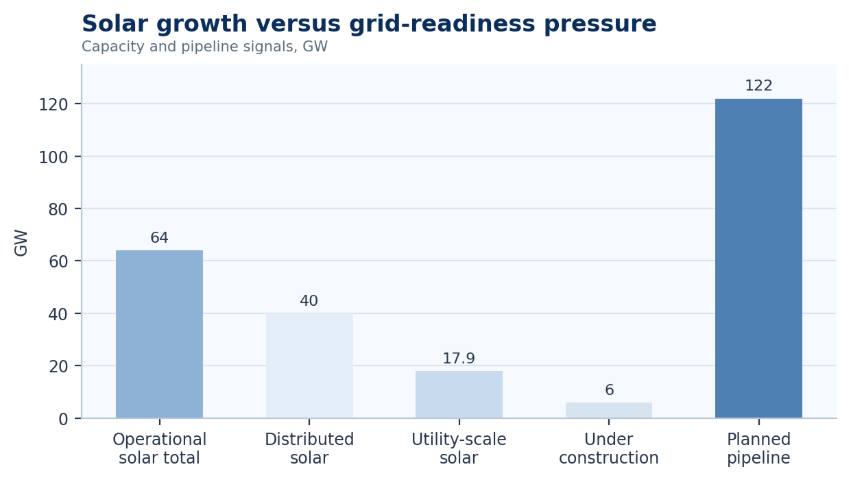
Figure 7. Brazil’s next solar-market challenge is not only building more capacity, but making sure the grid can connect, absorb, and manage that generation.
| Area | What it affects | Market impact |
|---|---|---|
| DG compensation | Rooftop payback | Shapes consumer adoption |
| Connection rules | Project timing | Affects deployment speed |
| Transmission | Utility-scale delivery | Determines export ability |
| Financing | Affordability | Influences adoption economics |
| Storage | Flexibility | Helps manage solar variability |
| Curtailment | Usable output | Shows grid absorption limits |
Brazil Solar Market Forecast Statistics
Forecasts are useful when they are treated as scenarios rather than promises. Brazil has strong solar fundamentals, but future deployment will depend on financing costs, regulation, grid access, storage, and the ability to turn planned projects into operating assets.
• One forecast places Brazil’s solar energy market at about US$2.49 billion in 2025.
• The same outlook projects the market could reach US$13.19 billion by 2034 if growth conditions remain supportive.
• The implied path reflects a high-growth market, but the real outcome depends on grid readiness and policy stability.
• Distributed solar forecasts depend strongly on consumer payback, financing, compensation rules, and electricity prices.
• Utility-scale forecasts depend more on project finance, PPAs, connection approvals, and transmission availability.
• Storage and grid flexibility become more important as solar’s share of generation rises.
• Forecasts should be checked against operating capacity, under-construction capacity, and actual generation, not only planned pipeline.
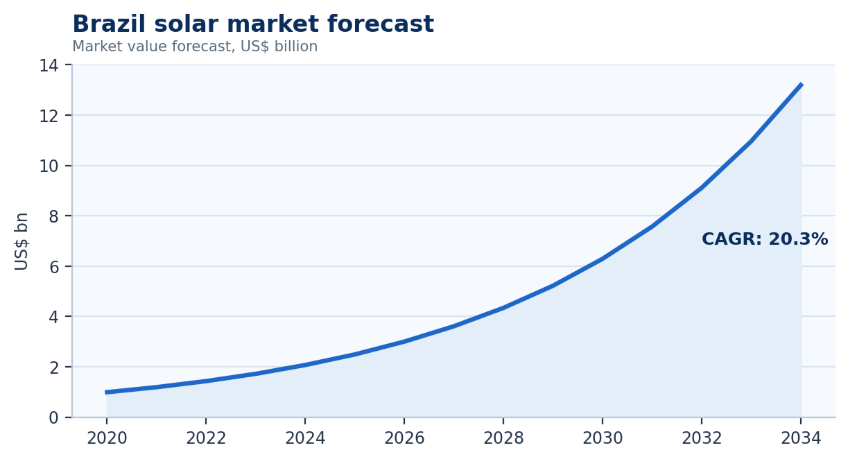
Figure 8. Brazil’s solar outlook remains positive, but future growth depends on grid readiness, financing, policy stability, and storage.
Installed Capacity Growth: What The Headline Numbers Really Show
The headline capacity number is strongest when it is broken into operating capacity, annual additions, pipeline depth, and delivery status. That keeps the discussion practical instead of treating every announced project as equal.
Capacity signals worth separating
- Operational solar capacity shows what has already reached service and can be counted in the power system.
- The 10.6 GW added in 2025 shows that deployment is still happening at national infrastructure scale.
- The 122 GW planned utility-scale pipeline points to future demand for transmission, approvals, PPAs, equipment, and financing.
- Under-construction capacity is the near-term delivery layer, while planned capacity is a longer-term pressure signal.
- The useful capacity question is not only how much Brazil has announced, but how much can connect, generate, and operate profitably.
| Capacity layer | What it shows | Why it matters |
|---|---|---|
| Operating capacity | Solar already in service | Real supply and market maturity |
| Annual additions | Current deployment pace | Momentum entering the system |
| Under construction | Near-term delivery | Projects closest to operation |
| Planned pipeline | Developer appetite | Future grid and financing pressure |
Distributed Solar Adoption By Customer Segment
Distributed solar deserves its own section because it is where Brazil’s energy transition becomes visible at household, business, farm, and public-building level. A rooftop system changes a customer’s relationship with the grid, while a rural system can support irrigation, storage, cooling, and production continuity.
Adoption signals worth separating
- Residential solar adoption shows where households see payback, bill control, and protection from rising electricity costs.
- Commercial solar adoption shows where companies are treating self-generation as an operating-cost strategy.
- Rural solar adoption matters because agribusiness can use PV for farms, pumping, storage, refrigeration, and regional production systems.
- Public and institutional systems show how schools, municipal buildings, and public facilities can use solar as a budget-planning tool.
- State-level distributed solar should be compared by installed capacity, number of systems, customer mix, tariffs, and local grid limits.
| Customer segment | Main signal | Market meaning |
|---|---|---|
| Residential | Bill control and payback | Shows consumer confidence |
| Commercial | Operating-cost reduction | Shows business energy management |
| Rural | Agribusiness and resilience | Shows adoption beyond cities |
| Public sector | Budget stability | Shows institutional use cases |
Utility-Scale Solar: Pipeline Quality, Delivery Risk, And Market Confidence
Utility-scale solar is Brazil’s project-delivery test. It links resource quality with land, PPAs, transmission access, financing, construction, and long-term operating discipline. The headline pipeline is encouraging, but pipeline quality matters more than pipeline size.
Utility-scale signals worth separating
- Operating utility-scale capacity shows what has already reached the grid and can be counted as real supply.
- Under-construction capacity shows the near-term delivery layer, not just the long-term project queue.
- Planned pipeline capacity shows developer appetite, but it should be discounted for connection, financing, permitting, and execution risk.
- Regional concentration matters because strong solar resources are not always closest to demand centers.
- Transmission availability can turn a strong solar resource into a bankable project, a delayed asset, or curtailed output.
| Pipeline layer | What it means | Planning question |
|---|---|---|
| Operating | Already producing | How much is real supply? |
| Under construction | Near-term delivery | What can connect soon? |
| Planned | Developer interest | What may be delayed? |
| Transmission | Grid access | Where can output move? |
Regional And Country Comparison: Why Brazil Is Not One Solar Market
Brazil’s national solar statistics are useful, but regional details explain the real market shape. The Southeast is driven by demand and distributed adoption, the Northeast by irradiation and utility-scale potential, and the Center-West by agribusiness demand.
Regional signals worth separating
- São Paulo and Minas Gerais show how demand, tariffs, and policy can drive large distributed-solar adoption.
- Bahia and other Northeast states show why irradiation, land, and transmission access matter for centralized solar.
- Paraná and Rio Grande do Sul prove that strong distributed adoption is not limited to the sunniest regions.
- Mato Grosso and the Center-West connect solar to farms, irrigation, storage, logistics, and agribusiness electricity demand.
| Region / country angle | What to compare | Why it matters |
|---|---|---|
| Southeast Brazil | Demand and rooftop adoption | Shows consumer and business scale |
| Northeast Brazil | Irradiation and utility projects | Shows centralized potential |
| Center-West Brazil | Farms and logistics | Shows rural energy demand |
| Chile / Mexico | Grid and policy structure | Adds regional context |
Solar Investment, Jobs, And Local Economic Value
Solar investment is not only an energy statistic. It is a confidence signal across engineering, installation, financing, project development, operations, and long-term electricity demand.
Economic signals worth separating
- Annual investment shows current market confidence and the pace at which capital is still entering the sector.
- Cumulative investment shows how deeply solar has already embedded itself into Brazil’s energy economy.
- Jobs created since 2012 show that solar is now a labor-market story as well as a generation story.
- Tax revenue and local business activity explain why solar adoption matters to regions, not only electricity planners.
- Operations and maintenance work matters because solar creates recurring service demand after installation and construction milestones.
| Economic signal | What it shows | Why it matters |
|---|---|---|
| Investment | Capital confidence | Shows market depth |
| Jobs | Installer and service demand | Shows labor-market impact |
| Tax revenue | Public-sector return | Shows fiscal contribution |
| O&M | Long-term service work | Shows recurring value |
Grid Readiness, Storage, And Curtailment Risk
Brazil’s next solar challenge is system integration. Building more capacity is not enough if the grid cannot connect, transport, absorb, or balance the output, especially when solar grows quickly in regions where demand, transmission, and project concentration do not always line up.
Grid signals worth separating
- Connection queues indicate where market interest may be running ahead of infrastructure readiness.
- Curtailment risk matters because installed capacity does not create full market value if output is regularly limited.
- Storage becomes more important as solar penetration rises because it can shift output and support flexibility.
- Hybrid projects can improve the value of solar by combining generation profiles or adding storage.
- Distribution upgrades are essential because many local networks were designed for one-way power flows.
| Grid issue | What it affects | Market impact |
|---|---|---|
| Connection queue | Project timing | Can delay new capacity |
| Curtailment | Usable output | Can reduce market value |
| Storage | Flexibility | Can shift solar output |
| Distribution upgrades | Local exports | Supports rooftop growth |
How Energy Teams Should Use These Statistics
Strong solar statistics should help different audiences make better decisions. Policymakers, utilities, investors, installers, and businesses need a scorecard that connects headline numbers to operating reality.
How to use the data
- Pair market size with generation data so capacity is tested against real electricity output.
- Pair distributed solar with consumer-unit and state-level data so adoption can be understood by user group and location.
- Pair pipeline data with under-construction and connection information so future growth is not overstated.
- Pair investment with jobs and regional data so economic impact is visible.
- Pair policy changes with payback and financing conditions so adoption risk is clear.
| Statistic type | Pair it with | Purpose |
|---|---|---|
| Capacity | Generation | Tests usable output |
| Distributed solar | State and user data | Shows adoption pattern |
| Pipeline | Construction and connection | Tests delivery risk |
| Investment | Jobs and regions | Shows economic value |
Solar Financing, Payback, And Customer Economics
Solar adoption in Brazil is also a financing story. Homes, farms, factories, and retailers may understand the value of solar, but adoption usually depends on cash flow, credit terms, tariff levels, installer quality, and payback confidence.
Customer-economics signals worth separating
- Distributed solar needs customer finance, predictable compensation rules, clear installer quality, and simple payback communication.
- Commercial customers often evaluate solar through operating-cost reduction, not only sustainability targets.
- Rural users may value solar through energy resilience, irrigation support, refrigeration, and production continuity.
- Payback-period statistics are most useful when compared by customer type, region, tariff level, and financing cost.
- Policy uncertainty can change adoption timing even when solar resource quality remains strong.
| Customer question | Statistic to check | Why it matters |
|---|---|---|
| Can I finance it? | Credit and payback | Controls adoption speed |
| Will it cut costs? | Tariff and usage profile | Shows savings logic |
| Will it perform? | Installer and equipment quality | Protects trust |
| Will rules change? | Compensation and tariffs | Shows policy risk |
Module Supply, Installation Quality, And Service Capacity
A mature solar market also depends on supply-chain and service capacity. Panels, inverters, mounting structures, electrical components, monitoring software, and skilled installers shape how quickly capacity can be added and how reliably systems perform after installation.
Service-quality signals worth separating
- Installation quality affects long-term generation, customer trust, warranty claims, and the reputation of distributed solar.
- Inverter availability and grid-code compliance become more important as distributed systems interact with local networks.
- Operations and maintenance capacity matters because solar assets must keep producing for many years after installation.
- A growing installer ecosystem supports jobs, but it also requires stronger training, inspection, and service standards.
- Service capacity is a market-quality indicator, not only a workforce statistic.
| Quality signal | What to inspect | Why it matters |
|---|---|---|
| Installer quality | Training and inspections | Protects customer trust |
| Component supply | Panels and inverters | Controls project timing |
| Grid compliance | Technical standards | Supports network safety |
| O&M capacity | Long-term service | Keeps output reliable |
Country And Regional Benchmarks For Market Context
Brazil’s solar scale is best understood with regional context. Latin America contains markets with different resource quality, policy rules, grid constraints, and financing conditions, so comparisons should explain market structure instead of creating rankings for their own sake.
Comparison signals worth separating
- Brazil’s advantage is the combination of national scale, distributed solar momentum, and a large utility-scale pipeline.
- Chile is useful as a comparison because high solar penetration can expose grid and curtailment issues earlier.
- Mexico is useful as a comparison because policy stability and project rules shape how quickly solar capacity turns into operating assets.
- Latin America comparisons should include grid access, regulation, demand growth, and project finance rather than installed capacity alone.
- Regional context helps explain why Brazil’s next solar stage depends on transmission, financing, and execution quality.
| Benchmark lens | What it compares | Why it matters |
|---|---|---|
| Brazil | Scale and distributed momentum | Shows market breadth |
| Chile | High solar penetration | Shows grid lessons |
| Mexico | Policy and delivery rules | Shows execution risk |
| Latin America | Pipelines and grid access | Shows regional competition |
How To Read Brazil Solar Statistics Without Losing The Market Story
A mature solar statistics report should do more than collect data points. It should show that Brazil’s solar market has entered a more complex phase, where capacity growth, project delivery, grid readiness, finance, regional adoption, and service quality all need to be read together.
Final reading rules
- Solar capacity, generation, and project pipeline are related, but they are not interchangeable.
- Distributed solar and utility-scale solar operate through different economics, owners, timelines, and constraints.
- Brazil should be read as a group of state and regional solar markets, not one uniform national market.
- Diagnostic tables should convert statistics into a practical measurement plan.
- Every major number should connect to a decision about policy, finance, operations, grid readiness, or customer adoption.
- A state or country comparison should explain market structure, not create a ranking for its own sake.
- A forecast should be treated as a scenario that depends on connection capacity, financing costs, storage, and stable rules.
This is the same logic used in the reference article: the statistic appears first, but the reader immediately sees what it means, what to compare, and which decision it supports. That prevents the section from becoming a data dump and keeps each benchmark tied to a practical market question.
Benchmark review checklist
- Start with the headline number, then ask whether it describes installed capacity, actual generation, future pipeline, or market value.
- Compare distributed solar with utility-scale solar before drawing conclusions about adoption, project delivery, or grid pressure.
- Use regional figures to explain why demand, irradiation, tariffs, land availability, and grid access create different state-level outcomes.
- Read investment and jobs beside installation quality, service capacity, and long-term operations so the economic story remains grounded.
- Treat forecasts as planning scenarios and connect them to storage, financing, connection queues, and policy stability.
- Use tables and readout boxes to translate the data into owners, actions, risks, next questions, and practical review priorities.
- Keep the reader focused on what changed in the market, what still needs to be measured, and which constraint could slow the next phase.
each statistic is introduced as a signal, then translated into a practical question for utilities, policymakers, developers, investors, installers, or large electricity users. It also mirrors the reference article approach of turning benchmarks into a short diagnostic model instead of a long list of disconnected facts.
The practical reading is simple: a number should either define the scale of the market, explain where adoption is happening, reveal a bottleneck, or support a planning decision for the next market review. If a statistic does not do one of those things, it should not lead the section. This is why the article groups Brazil solar data by capacity, distributed adoption, utility-scale delivery, generation, region, investment, grid readiness, and forecast outlook.
This structure also makes the article easier to scan and easier to update because every section has a clear practical editorial job: introduce the issue, present the benchmark, organize the signal, and explain what the reader should do with it.
| Statistic | Do not read it as | Read it with |
|---|---|---|
| Capacity | A complete market story | Generation and connection status |
| Pipeline | Guaranteed future supply | Construction and grid access |
| Investment | Promotion only | Jobs and project delivery |
| Regional ranking | Simple leaderboard | Demand, rules, and grid limits |
Brazil Solar Market Diagnostic
A polished solar benchmark should help teams decide what to inspect next. The table below keeps the analysis from becoming a stat dump by connecting each market area to a measurable signal and a useful benchmark.
| Solar area | Core signals to measure | Useful benchmark |
|---|---|---|
| Distributed solar | Rooftop capacity, users, state adoption | Distributed solar GW and connected users |
| Utility-scale solar | Operational GW, pipeline, PPAs | Centralized capacity and planned projects |
| Regional adoption | State capacity, demand, irradiation | Leading states and regional concentration |
| Grid readiness | Queues, curtailment, transmission | Pipeline pressure and infrastructure constraints |
| Investment | Annual capital and financing | Solar capital attracted |
| Jobs | Installers, O&M, construction | Solar jobs and economic contribution |
| Policy | DG rules, tariffs, connection | Regulation affecting payback and deployment |
| Forecast | Capacity outlook, storage demand | Long-term growth scenarios |
90-Day Brazil Solar Benchmark Plan
Statistics become useful when they are translated into a measurement plan. A practical solar review can be organized into a 90-day cycle instead of a vague market update.
| Timing | What to review | Output |
|---|---|---|
| Days 1-30 | Map total capacity, distributed solar, utility-scale solar, generation, state, investment, and jobs. | Clear snapshot of where growth is strongest. |
| Days 31-60 | Compare growth with grid access, regional demand, financing, policy rules, and project pipeline. | List of high-opportunity and high-risk segments. |
| Days 61-90 | Review forecasts, storage needs, curtailment risk, connection pressure, and buyer demand. | Repeatable solar market scorecard. |
Metrics Brazil Solar Leaders Should Track
A mature solar scorecard should track both growth and quality. Capacity additions matter, but they should be reviewed beside generation, grid access, investment, jobs, state-level adoption, policy changes, and project delivery.
| Metric | Why it matters |
|---|---|
| Total installed capacity | Shows overall market scale |
| Annual solar additions | Shows deployment momentum |
| Distributed solar capacity | Measures consumer and small-scale adoption |
| Utility-scale capacity | Measures large-project growth |
| Solar generation | Shows actual electricity output |
| Solar share of mix | Shows national energy importance |
| State-level capacity | Shows regional leadership |
| Project pipeline | Shows future development pressure |
| Grid connection queue | Shows deployment bottlenecks |
| Curtailment rate | Shows whether generation is wasted |
| Solar investment | Shows capital-market confidence |
| Solar jobs | Shows economic impact |
| Payback period | Shows adoption economics |
| Policy changes | Shows market risk and opportunity |
Brazil Solar Energy Market FAQ
Common questions
• How large is Brazil’s solar energy market?
Brazil has moved into national-scale solar. Operational capacity reached 64 GW, while market forecasts still point to expansion if grid access, financing, and policy conditions remain workable.
• How much solar capacity does Brazil have?
Brazil reached about 64 GW of operational solar PV capacity, including distributed solar on homes, businesses, farms, and public buildings as well as centralized utility-scale solar farms.
• What is distributed solar in Brazil?
Distributed solar refers to rooftop and smaller systems installed close to electricity users. It matters because it turns households, companies, farms, and public buildings into power producers, not only power buyers.
• What is utility-scale solar in Brazil?
Utility-scale solar refers to centralized solar farms that depend on land, project finance, grid connection, PPAs, transmission access, and long-term project execution.
• Which Brazilian states lead in solar energy?
São Paulo, Minas Gerais, Paraná, Rio Grande do Sul, Mato Grosso, Bahia, Goiás, and Northeast states all appear in the market story, but each leads for different reasons: demand, irradiation, land, grid access, or customer economics.
• How much electricity does solar generate in Brazil?
Solar PV generation reached 50.6 TWh in 2023, while distributed solar PV generation reached 29.8 TWh. That distinction matters because capacity only becomes market value when it produces usable electricity.
• What are the main challenges for Brazil’s solar market?
The main constraints are grid connection, transmission capacity, distribution upgrades, curtailment risk, financing costs, policy stability, and the ability to convert planned pipeline into operating capacity.
• What is the future outlook for Brazil solar energy?
The outlook remains positive, but future growth will depend less on awareness and more on execution: grid readiness, stable rules, practical financing, storage, and project delivery.
Final Takeaway
Brazil solar is now a major power-market segment, not a small renewable add-on. The strongest numbers show rapid capacity growth, a large distributed-solar base, expanding utility-scale development, rising solar generation, substantial investment, and meaningful job creation.
The market should be analyzed in layers. Distributed solar shows household, commercial, rural, and small-business adoption. Utility-scale solar shows developer confidence, large-project finance, land, PPAs, and transmission needs. Regional statistics show that adoption is shaped by demand, irradiation, land, financing, policy, and grid access rather than by national averages alone.
The next stage will depend on operating reality. Brazil needs stable rules, practical financing, grid connection, transmission capacity, storage, forecasting, and project delivery so that headline capacity becomes reliable electricity-market value.


