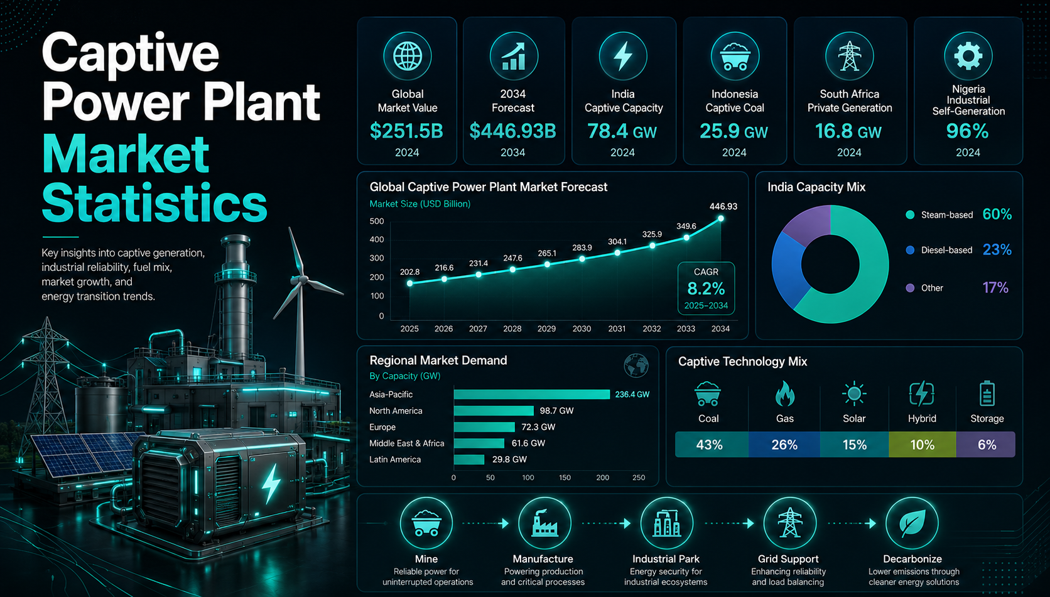
Captive power plants have moved from backup equipment to industrial energy infrastructure. Manufacturers, mines, data centers, cement plants, oil and gas assets, and industrial parks use them to protect uptime, manage tariffs, and keep production running when grid supply is weak, expensive, or exposed to disruption.
The market is large enough to need its own scorecard. Fortune Business Insights values captive power plants at USD 251.50 billion in 2025 and projects USD 446.93 billion by 2034. India has 80.93 GW of industrial captive capacity, Indonesia has 31+ GW of captive coal exposure, Nigeria relies on 8-14 GW of decentralized diesel generation, and South Africa reached 5.8 GW of private embedded solar PV in Q1 2024.
The strongest statistics below are grouped by market scale, region, country, fuel, industry, reliability, renewables, and investment risk so energy teams can see where captive power demand is forming and why.
Executive Captive Power Benchmarks
These benchmarks frame the market. They show scale, where self-generation is already embedded, and which fuel choices are shaping future risk.
The numbers that define the captive power market
Read the numbers as a market map. Global values show scale, country figures show where demand is already built, and fuel statistics show where transition pressure is rising.
- Fortune Business Insights values captive power plants at USD 251.50 billion in 2025 and projects USD 446.93 billion by 2034.
- Broader estimates point the same way: Zion Market Research moves from USD 574.05 billion in 2023 to USD 905.92 billion by 2032.
- Allied Market Research also supports the growth picture, moving from USD 494.7 billion in 2020 to USD 823.1 billion by 2030.
- India shows how embedded captive power can become, with 80.93 GW of capacity and 214,581 GWh of generation in FY 2023-24.
- Coal still carries the legacy base, representing about 59.1% of India’s captive capacity and most actual output.
- Indonesia is the transition-risk signal, with more than 31 GW of captive coal exposure across operating, under-construction, and planned projects.
- Nigeria shows the weak-grid signal, with an estimated 8-14 GW of decentralized diesel generation supporting everyday business power needs.
- South Africa and Saudi Arabia show two growth routes: 5.8 GW of private embedded solar PV in South Africa and a USD 5.1 billion Saudi captive market in 2024.
Why Captive Power Now Carries Industrial-Scale Importance
Captive power matters most when electricity is continuous, costly, and tied directly to output. A factory may delay some overhead spending, but it cannot delay the power needed for a kiln, compressor, smelter, mine conveyor, refinery unit, or data center load.
Forecasts differ because some firms track captive plants only, while others include generator sets, CHP, onsite power, or broader distributed generation. The definitions vary, but the direction is consistent: industrial users want more control over power supply.
Market-size and growth benchmarks
- Fortune Business Insights puts the captive power plant market at USD 251.50 billion in 2025, giving the sector a large industrial base.
- The same forecast moves from USD 266.28 billion in 2026 to USD 446.93 billion by 2034, showing how much value is tied to onsite power control.
- That rise equals roughly 67.8% expansion from the 2026 base, reinforcing captive power as industrial infrastructure rather than backup equipment.
- Zion Market Research uses a broader captive power generation lens and estimates USD 574.05 billion in 2023, rising to USD 905.92 billion by 2032.
- Allied Market Research takes the same growth view, projecting captive power generation from USD 494.7 billion in 2020 to USD 823.1 billion by 2030.
- Narrower estimates, including Maximize Market Research and Coherent Market Insights, still show growth because onsite power demand is spreading across industry, data centers, and commercial facilities.
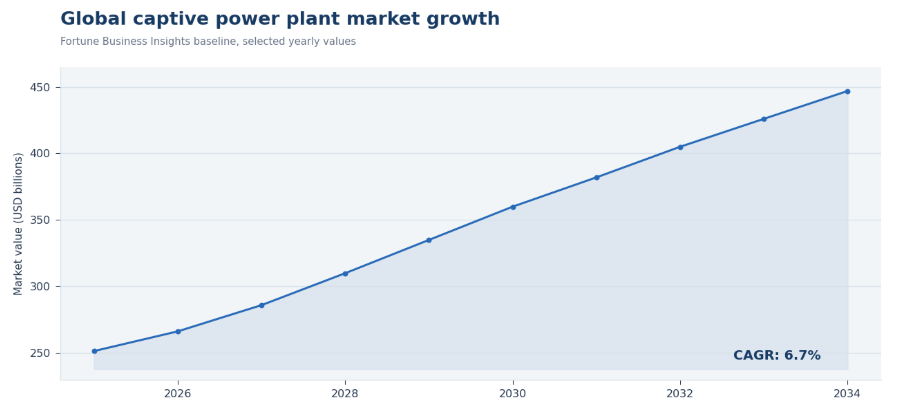
Figure 1. Captive power market growth matters most when industrial load, grid reliability, and tariff pressure are reviewed together.
Captive Power Demand Drivers: Where the Market Starts Expanding
Captive power demand usually starts where grid supply, tariff pressure, or production risk becomes too costly to ignore.
A remote mine, a high-tariff textile plant, a continuous chemical process, and a data center all need power control, but for different reasons. Separating the demand driver keeps the market analysis practical.
Demand drivers worth separating
- Grid weakness is the clearest demand signal: Nigeria’s estimated 8-14 GW of decentralized diesel capacity shows how companies build parallel power systems when grid supply is unreliable.
- Nigeria’s cited self-generation share of 96% makes the point more sharply, because only 4% comes from grid supply in that estimate.
- South Africa’s power shortages created a different response, helping private embedded solar PV reach 5.8 GW in Q1 2024.
- Those South African embedded solar systems generated about 2.3 TWh in the first three months of 2024, turning resilience into measurable power supply.
- India’s 80.93 GW captive fleet and 214,581 GWh of captive generation show how large self-generation can become inside a major industrial economy.
- Indonesia’s 31+ GW captive coal exposure shows how industrial parks and smelting loads can create dedicated power demand outside ordinary utility planning.
- Saudi Arabia adds the industrial-growth angle, with electricity demand up 3.5% in 2024 and expected to grow about 3.3% annually through 2027.
Demand drivers should be ranked before technology is selected. Voltage instability, peak tariffs, remote access, and carbon pressure each point toward a different design.
| Demand Driver | Primary Metric | Likely Owner |
|---|---|---|
| Grid unreliability | Outage hours, load-shedding, voltage instability | Operations, plant management |
| High tariffs | Tariffs, demand charges, peak pricing | Finance, procurement |
| Production continuity | Downtime, restart losses, spoilage | Manufacturing, operations |
| Remote location | Grid distance, fuel logistics | Mining, oil and gas |
| Energy security | Fuel availability and supply risk | Energy management |
| Decarbonization | Emissions intensity, renewable share | ESG, sustainability |
Fuel and Technology Mix: Coal, Gas, Diesel, Solar, and Hybrid Systems
Captive power is not switching fuels at the same pace everywhere. Coal still supports heavy baseload, diesel remains common for backup and remote sites, gas fits process-heavy facilities, and solar is growing where daytime industrial loads make payback practical.
The stronger trend is a portfolio approach that combines firm power, renewables, storage, cogeneration, and waste heat recovery.
Fuel and technology benchmarks
Fuel mix is also a risk map. Coal and diesel solve reliability quickly but raise fuel and emissions exposure. Gas, CHP, solar, storage, and hybrids require more design work but can improve long-term resilience.
- India’s fuel mix shows the legacy base clearly: coal held about 46,900 MW of captive capacity in FY 2023-24 and supplied roughly 84.1% of captive generation.
- Oil-based captive capacity was still material at about 18,300 MW, showing that liquid-fuel assets remain important for backup and flexible site needs.
- Gas-based captive capacity reached about 6,500 MW, a smaller share but a practical option where fuel supply and process heat needs support it.
- Renewable captive capacity stood near 7,500 MW in India, giving factories and industrial campuses a cleaner daytime power option.
- Indonesia had 19.3 GW of operational captive coal capacity, with another 3.6 GW under construction and 8.16 GW planned.
- Taken together, Indonesia’s operational, construction, and planned captive coal projects exceed 31 GW, making transition planning unavoidable.
- Nigeria’s 8-14 GW diesel generator range shows why diesel remains a resilience tool even when it creates fuel-cost and emissions pressure.
- South Africa’s 5.8 GW of private embedded solar PV shows how weak-grid markets can move quickly toward cleaner self-generation.
| Technology | Where It Fits | Market Implication |
|---|---|---|
| Coal captive power | Heavy baseload industries | Baseload, higher carbon risk |
| Gas captive power | Chemicals, industrial parks, manufacturing | Cleaner flexible power |
| Diesel generators | Backup and remote sites | Fast backup, high fuel cost |
| Solar captive power | Factories, warehouses, campuses | Strong daytime savings |
| Solar + storage | Weak-grid and high-tariff sites | Improves resilience, cuts diesel |
| CHP/cogeneration | Process heat industries | Raises energy efficiency |
| Waste heat recovery | Cement, steel, chemicals | Turns waste heat into power |
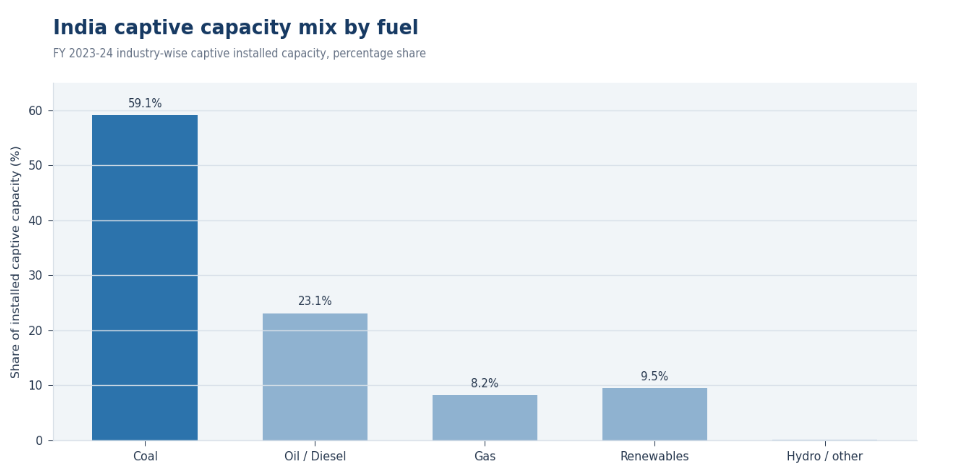
Figure 2. Captive power fuel mix is shifting toward hybrid systems as industrial users balance reliability, fuel flexibility, and emissions.
Industrial End-Use Demand: Where Captive Power Matters Most
Captive power matters most where electricity is part of production rather than overhead. Cement kilns, steel mills, chemical processes, data centers, cold storage facilities, and mines can face heavy losses from brief disruptions, so end-use context is central to market analysis.
The strongest captive power demand often appears in sectors with high load factors, high restart costs, continuous processes, remote operations, or strict uptime requirements. These industries do not buy electricity only as a commodity. They buy continuity, voltage stability, fuel availability, and predictable operating cost. That is why captive power economics should be tested against production losses, not just grid tariffs.
Industrial-use benchmarks
The same megawatt has a different value depending on the industry it serves. In a cement plant, it may protect a continuous thermal process. In a mine, it may keep extraction and processing equipment moving. In a data center, it protects uptime and customer confidence. That is why end-use context matters as much as capacity.
- India’s 214,581 GWh of captive generation in FY 2023-24 shows that self-generation is already deeply embedded in industrial operations.
- The fleet’s implied average load factor of about 30.9% suggests a mix of baseload, backup, seasonal, and process-specific generation.
- Coal captive assets ran much harder, with implied utilization near 43.9%, because heavy industry still depends on firm baseload electricity.
- Renewable captive assets had implied utilization near 15.3%, which fits solar and renewable profiles but still reduces daytime grid exposure.
- Indonesia’s 31+ GW captive coal exposure is closely tied to nickel processing, smelting, and industrial parks where continuous power is essential.
- South Africa’s 5.8 GW embedded solar base shows how industrial and commercial users respond when grid interruptions threaten production and service quality.
| Industry | Why Captive Power Matters | Useful Metric |
|---|---|---|
| Mining | Remote sites and continuous equipment use | MW per site, diesel cost, outage losses |
| Cement | High process energy demand | kWh per ton, plant load factor |
| Steel and metals | High load and process continuity | Electricity intensity, baseload demand |
| Chemicals | Continuous process and heat integration | CHP use, gas demand |
| Oil and gas | Remote operations and critical loads | Generator capacity, fuel logistics |
| Data centers | Uptime and redundancy | MW demand, backup duration |
| Manufacturing | Tariff control and outage protection | Cost per kWh, downtime cost |
| Industrial parks | Shared infrastructure and large concentrated loads | Dedicated generation capacity |
Regional Captive Power Intelligence
Regional data matters because captive power reflects local industry, grid reliability, fuel access, and policy direction. Asia-Pacific carries large industrial capacity, Africa shows weak-grid self-generation, the Middle East is tied to oil and gas and industrial cities, while Europe and North America lean more toward CHP, resilience, data centers, and lower-carbon onsite power.
Asia-Pacific
Asia-Pacific is the strongest captive power story because it combines manufacturing growth, mining, energy-intensive processing, and tariff-management needs. India shows a large diversified captive fleet; Indonesia shows a major captive coal transition challenge.
- India anchors the regional story with 80,926.3 MW of industrial captive capacity and about 214,581 GWh of captive generation in FY 2023-24.
- Coal still dominates India’s actual captive output, while about 7,500 MW of renewable captive capacity shows the cleaner-power shift already underway.
- India’s reported power shortage fell from 4.2% in 2013-14 to 0.1% in 2024-25, changing the role of captive power from basic shortage cover to cost and control strategy.
- Indonesia adds the industrial-park and smelting angle, with 19.3 GW of operating captive coal, 3.6 GW under construction, and 8.16 GW planned.
- That gives Indonesia more than 31 GW of identified captive coal exposure, making the country one of the most important transition cases in the market.
- The region’s story is therefore not only capacity growth; it is the shift from coal-heavy industrial power toward gas, renewables, storage, and hybrid systems.
North America
North America’s market is tied to resilience, gas generation, CHP, data centers, and clean onsite power. Industrial users use self-generation to manage storms, grid congestion, demand charges, and power-quality risk.
The market is less about basic grid access and more about power quality, fuel flexibility, demand management, renewable procurement, and resilience against extreme weather.
Europe
Europe’s captive power logic is shaped by energy security, industrial energy costs, carbon regulation, CHP, and competitiveness. Fossil onsite generation must be weighed against carbon pricing, permitting, and decarbonization targets.
The long-term European story is efficient, compliant, lower-carbon onsite energy through CHP, waste heat recovery, renewables, storage, and flexible industrial systems.
Middle East and Africa
Middle East and Africa have some of the clearest demand signals. In parts of Africa, self-generation fills grid gaps. In the Middle East, captive power is tied to oil and gas, petrochemicals, mining, industrial cities, desalination-linked loads, and remote sites.
- Nigeria’s estimated 8-14 GW diesel generator fleet shows how weak-grid markets create large self-generation ecosystems.
- In one cited estimate, only 4% of Nigerian energy use comes from the grid while 96% is self-generated, which explains why diesel replacement is a major opportunity.
- South Africa reached 5.8 GW of private embedded solar PV in Q1 2024 as businesses responded to load-shedding and grid risk.
- Those embedded systems generated about 2.3 TWh in the first three months of 2024, giving private generation a measurable role in supply.
- Saudi Arabia’s captive power market was valued near USD 5.1 billion in 2024, supported by petrochemicals, oil and gas, industrial cities, and remote loads.
- Saudi demand is also expanding, with electricity consumption up 3.5% in 2024 and expected growth of about 3.3% annually through 2027.
Latin America
Latin America’s market is connected to mining, remote industrial sites, distributed solar, and grid constraints. Chile and Peru show mining-driven demand, while Brazil offers distributed generation and renewable potential.
The region should be screened by country and industry because mining, agribusiness, logistics, manufacturing, and remote infrastructure all have different energy profiles.
Regional comparison should separate replacement demand from new-build demand. North America and Europe often lean toward resilience, CHP, and lower-carbon retrofits; Asia-Pacific, Africa, and parts of Latin America show more direct growth from industrial expansion and grid constraints.
| Region | Captive Power Implication |
|---|---|
| Asia-Pacific | Strongest growth base; industrial load and grid constraints |
| North America | Resilience, CHP, gas, data centers, clean onsite power |
| Europe | Energy security, CHP, carbon rules, competitiveness |
| Middle East and Africa | Mining, oil and gas, weak grids, diesel replacement |
| Latin America | Mining, distributed solar, remote power |
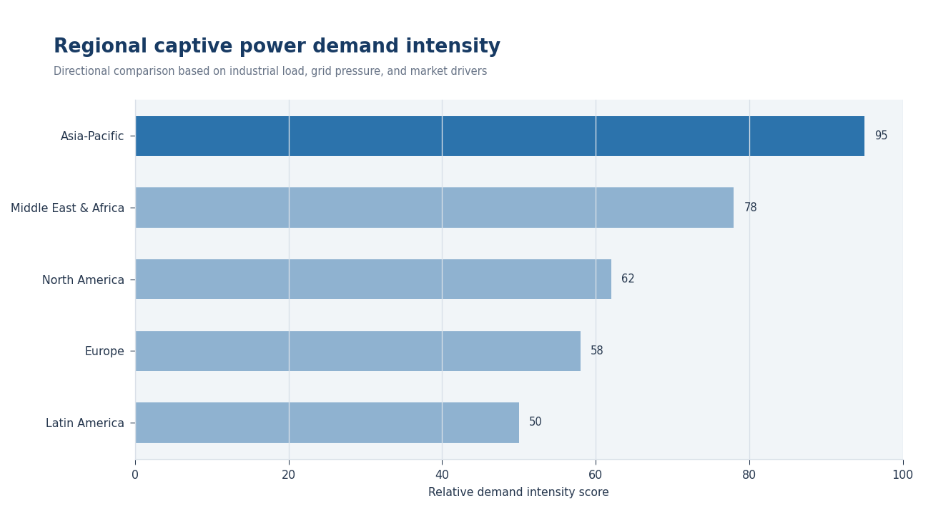
Figure 3. Regional captive power demand should be measured through industrial load, grid reliability, fuel access, and policy pressure rather than market size alone.
Country-Level Captive Power Statistics
Country data matters because captive power is local. India is shaped by industrial capacity and fuel mix, Indonesia by captive coal and nickel processing, Nigeria by diesel dependence, South Africa by embedded solar and load-shedding, and Saudi Arabia by petrochemicals and industrial energy systems.
India
India is a key captive power market because its industrial fleet is large, measurable, and diversified by fuel. The data shows how self-generation can sit beside a major utility system while still helping industry manage cost and reliability.
- India had 80,926.3 MW, or about 80.93 GW, of industrial captive power capacity in FY 2023-24.
- That captive fleet equaled about 18.3% of India’s 442 GW utility installed capacity as of March 31, 2024.
- Industrial captive plants generated 214,581 GWh in FY 2023-24, making self-generation a major source of industrial electricity.
- Coal remained the backbone, with about 46,900 MW of capacity and roughly 84.1% of captive generation.
- Oil, gas, and renewables added important flexibility, with 18,300 MW of oil capacity, 6,500 MW of gas capacity, and 7,500 MW of renewable captive capacity.
- India’s reported power shortage dropped from 4.2% in 2013-14 to 0.1% in 2024-25, so the captive story is increasingly about tariff control, reliability quality, and renewable procurement.
India’s market is mature but still changing: coal dominates actual generation, while renewables, open-access procurement, hybrids, and tariff management are gaining importance.
Indonesia
Indonesia is a major transition-risk market. Captive coal supports industrial parks, mineral processing, and nickel supply chains, but it also creates a large decarbonization challenge.
- Indonesia has 19.3 GW of operational captive coal capacity, making it one of the clearest captive-coal transition markets.
- The pipeline adds pressure: 3.6 GW is under construction and 8.16 GW is planned.
- Together, operating, construction, and planned captive coal projects exceed 31 GW.
- Earlier GEM tracking identified 132 operational captive coal-fired units totaling 15.2 GW, showing how quickly the base has grown.
- Indonesia’s transition plan estimates USD 31 billion is needed by 2030 and USD 92 billion by 2050 to decarbonize captive power.
- The scenario moves renewables from 9% of captive generation in 2024 to 34% by 2030 and more than 80% by 2050.
Indonesia shows why captive power is now a climate-finance and supply-chain issue, not only an industrial energy topic.
Nigeria
Nigeria shows the weak-grid version of captive power. Its decentralized generator fleet shows how companies build parallel power systems when grid supply is insufficient.
- Nigeria’s decentralized diesel generator capacity is estimated at 8 GW on the low end and 14 GW on the high end.
- The midpoint, about 11 GW, shows how large the self-generation base has become outside the formal grid.
- One cited estimate places self-generated energy at 96% of total use, compared with only 4% from the electricity grid.
- That makes Nigeria’s self-generated share roughly 24 times the grid-supplied share in the same estimate.
- German Energy Solutions cites N67.38 billion spent on self-generated electricity in 2019, showing the financial weight of backup power.
- The clearest opportunity is not more diesel for its own sake; it is diesel reduction through gas, solar, storage, and hybrid systems.
Nigeria’s clearest opportunity is diesel replacement. Gas-to-power, solar-diesel hybrids, storage, and industrial microgrids can reduce fuel exposure while improving reliability.
South Africa
South Africa shows how private embedded generation can grow quickly when grid reliability weakens. Its captive story is tied to load-shedding, industrial resilience, commercial solar, storage, and wheeling.
- South Africa had 5.8 GW of private-sector embedded solar PV in Q1 2024.
- That fleet generated around 2.3 TWh in the first three months of 2024, giving private systems a visible supply role.
- Tracked distributed solar PV rose from 4,456 MWp in Q4 2022 to 5,659 MWp in Q1 2023.
- The 1,203 MWp quarterly addition represented about 27.0% growth in tracked distributed PV capacity.
- South Africa’s 5.8 GW embedded PV base equaled about 12.0% of Eskom’s 48,186 MW installed generating capacity.
- The country’s energy storage market is expected to reach USD 1,461 million by 2030, which matters because storage turns embedded solar into a stronger reliability asset.
South Africa also shows why the first transition step is often practical rather than perfect: cut the most expensive or risky generation first, then add storage, wheeling, or cleaner firm capacity as the project matures.
Saudi Arabia
Saudi Arabia’s captive power market is shaped by industrial demand, oil and gas activity, petrochemicals, industrial cities, remote facilities, and cogeneration. Its story is less about weak-grid diesel dependence and more about reliable power for large industrial systems.
- Saudi Arabia’s captive power generation market was valued around USD 5.1 billion in 2024.
- With an estimated 7.18% CAGR, the market would reach about USD 7.73 billion by 2030.
- Electricity demand grew 3.5% in 2024 and is expected to rise about 3.3% annually through 2027.
- The market is strongest where petrochemicals, oil and gas, industrial cities, and remote assets need reliable onsite generation.
Saudi Arabia is best understood through industrial growth, cogeneration, gas-based power, industrial renewables, and remote power systems.
Country statistics are operating-context data. The same gas engine, solar array, storage system, or CHP project can have a different business case depending on grid charges, fuel subsidies, permitting, outage history, land, and wheeling rules.
| Country | Main Captive Power Driver | Dominant Opportunity |
|---|---|---|
| India | Industrial demand, tariff management, open access | Captive solar, hybrids |
| Indonesia | Mining, smelting, industrial parks | Coal transition, renewables |
| Nigeria | Grid unreliability and diesel dependence | Gas, solar-diesel hybrids |
| South Africa | Load-shedding and mining resilience | Solar, storage, wheeling |
| Saudi Arabia | Petrochemicals and industrial energy demand | Cogeneration, gas, renewables |
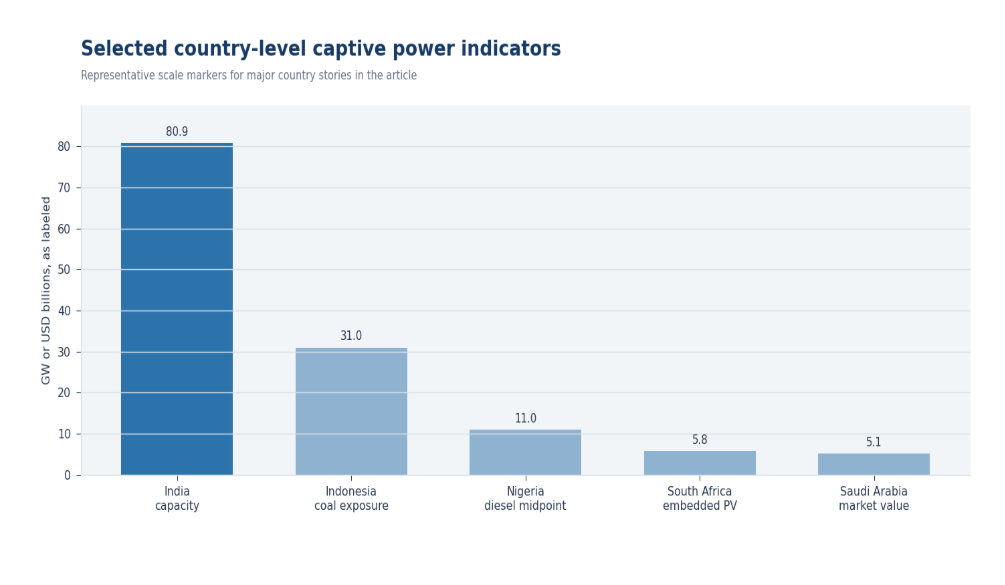
Figure 4. Country-level captive power trends show different demand drivers, from India’s tariff management to Nigeria’s diesel replacement and South Africa’s load-shedding response.
Renewable Captive Power: Solar, Storage, and Corporate Energy Strategy
Renewable captive power is becoming a major growth theme, but not only for ESG reasons. In high-tariff markets, onsite solar cuts power costs; in weak-grid markets, solar plus storage reduces diesel use; in carbon-focused markets, renewables lower Scope 2 exposure.
The constraint is execution: roof area, land, wheeling rules, battery cost, and load matching. The best projects fit the production profile rather than treating solar or storage as one-size-fits-all.
Renewable captive benchmarks
The renewable opportunity is strongest when generation matches load. Daytime factories can use solar directly; evening or critical loads need storage, hybrids, or firm backup. The market is shifting from simple renewable adoption toward integrated energy design.
- India’s renewable captive capacity reached about 7,500 MW in FY 2023-24, supplying roughly 10,080 GWh of generation.
- Renewables made up about 9.5% of India’s captive capacity but only 4.7% of generation, showing the difference between installed capacity and output profile.
- South Africa’s private embedded solar PV reached 5.8 GW in Q1 2024 and generated about 2.3 TWh in the first three months of the year.
- South Africa also added about 1,203 MWp of tracked distributed solar PV in one quarter, a 27.0% jump.
- Indonesia’s transition scenario moves renewable captive generation from 9% in 2024 to 34% by 2030.
- By 2050, the same scenario puts renewables above 80% of captive generation and cuts captive power emissions by 75% by 2030 versus baseline.
- South Africa’s storage market is expected to reach USD 1,461 million by 2030, which matters because storage helps renewables serve reliability, not only emissions goals.
| Use Case | Why It Works | Main Constraint |
|---|---|---|
| Rooftop solar | Uses existing roof space and offsets daytime load | Limited capacity |
| Ground-mounted captive solar | Supports larger industrial demand | Land and wheeling rules |
| Solar + storage | Improves reliability and diesel reduction | Battery cost and sizing |
| Wind-solar hybrid | Better generation profile | Site quality and transmission |
| Biomass captive power | Useful for agro-industrial sites | Feedstock availability |
| Waste heat recovery | Converts process heat into electricity | Industry-specific feasibility |
Reliability, Grid Risk, and Backup Power Economics
Reliability is one of the strongest captive power drivers because grid tariffs do not capture the full cost of disruption. Power failures can mean lost output, restart losses, spoilage, delayed shipments, and equipment stress.
Backup generation can look expensive on a cost-per-kWh basis but attractive when measured against avoided downtime. In weak-grid markets, the cost of not producing can be higher than the cost of self-generation.
Reliability and backup benchmarks
- Nigeria’s 8-14 GW diesel generator estimate shows how unreliable grids can turn backup power into everyday infrastructure.
- South Africa’s load-shedding can remove around 1,000 MW at lower stages and around 6,000 MW at severe stages.
- The country’s 5.8 GW embedded PV base is therefore roughly comparable to a 6,000 MW load-shedding stage.
- India’s reported power shortage fell from 4.2% in 2013-14 to 0.1% in 2024-25, reducing shortage pressure but not removing the need for industrial control.
- Saudi Arabia’s electricity demand grew 3.5% in 2024 and is expected to expand about 3.3% annually through 2027.
- South Africa’s storage market forecast of USD 1,461 million by 2030 shows why backup economics are moving beyond diesel alone.
- For factories, mines, hospitals, and data centers, the real benchmark is avoided downtime, not only power cost per kWh.
| Reliability Problem | Captive Power Response |
|---|---|
| Frequent outages | Diesel, gas, solar-storage backup |
| Voltage instability | Dedicated generation and power conditioning |
| Weak remote grids | Off-grid captive plant or microgrid |
| Peak-time grid stress | Captive peaking and demand management |
| Industrial restart losses | Continuous baseload or CHP |
| Data center uptime risk | Redundant onsite generation |
Policy, Emissions, and Investment Risks
Captive power solves real industrial problems, but it can also create long-term exposure. Coal or diesel assets may improve reliability today while increasing carbon, fuel-price, financing, and stranded-asset risk tomorrow.
Policy risk matters because captive power assets have long lives. A plant that works under today’s fuel prices and emissions rules may weaken if carbon costs rise, financing tightens, grid charges change, or renewable alternatives become cheaper.
Risk benchmarks
The risk section is not an argument against captive power. It is a reminder that the strongest projects are built with flexibility, so they can add solar, storage, efficiency upgrades, or cleaner fuel later.
- Indonesia’s more than 31 GW of captive coal exposure makes it the clearest policy and emissions-risk case in the market.
- Captive coal accounted for about 80% of Indonesia’s year-over-year coal additions, tying industrial growth directly to carbon exposure.
- The potential captive coal fleet would exceed Australia’s 22.8 GW coal fleet and come close to Germany’s 32.3 GW operating coal fleet.
- Indonesia’s transition plan estimates USD 31 billion is needed by 2030 and USD 92 billion by 2050 to decarbonize captive power.
- The scenario requires renewables to rise from 9% of captive generation in 2024 to 34% by 2030 and more than 80% by 2050.
- Nigeria’s 8-14 GW diesel generator base and India’s 84.1% coal share in captive generation show that fuel and emissions risk is not limited to one country.
Long-life assets need a transition lens. A plant built only around today’s fuel economics may look weaker if carbon costs rise, financing tightens, or customers demand lower-carbon production.
| Risk Area | Why It Matters | Best Metric to Track |
|---|---|---|
| Fuel price volatility | Changes operating cost quickly | Fuel cost per kWh |
| Carbon policy | Raises long-term fossil-generation risk | Emissions intensity |
| Grid regulation | Affects open access and wheeling economics | Charges and rule changes |
| Financing | Fossil projects may face stricter lending | Cost of capital |
| Reliability | Poor maintenance weakens plant value | Availability factor |
| Technology lock-in | Long-life assets may become uneconomic | Payback and stranded-asset risk |
Captive Power Market Diagnostic
A useful captive power scorecard identifies the real demand driver: unreliable grid supply, high tariffs, rising industrial load, weak fuel security, emissions pressure, or investment return.
| Problem Area | Core Signals to Measure | Useful Benchmark |
|---|---|---|
| Grid reliability | Outage hours, load-shedding, voltage problems | Country outage and reliability stats |
| Cost pressure | Grid tariff, diesel cost, demand charges | Captive cost per kWh |
| Industrial load | Load factor, peak demand, baseload requirement | MW demand by industry |
| Fuel security | Fuel access, logistics, price volatility | Fuel mix and price trend stats |
| Decarbonization | Emissions intensity, renewable share | Renewable captive and emissions benchmarks |
| Investment return | Payback, capex, opex, avoided outage cost | Market CAGR and ROI indicators |
90-Day Captive Power Benchmark Plan
Statistics become useful when translated into a plan. A 90-day review should compare market benchmarks with operating conditions and rank opportunities by reliability value, cost impact, fuel access, emissions exposure, and investment risk.
| Timing | What to Do | Output |
|---|---|---|
| Days 1-30 | Capture baseline data by region, country, industry, fuel type, grid reliability, tariff level, and emissions intensity | A clear map of where captive power demand is strongest |
| Days 31-60 | Compare coal, gas, diesel, solar, storage, CHP, waste heat recovery, and hybrid systems | A practical technology and cost comparison |
| Days 61-90 | Review policy, emissions, fuel-price, financing, and reliability risks before ranking opportunities | A repeatable scorecard for captive power investment decisions |
Metrics Captive Power Leaders Should Track
A mature captive power scorecard should locate the real opportunity without becoming a vanity dashboard. Installed capacity alone is not enough; teams also need utilization, reliability, fuel cost, emissions, and payback metrics.
| Metric | Why It Matters |
|---|---|
| Installed captive capacity | Shows the scale of self-generation |
| Captive share of industrial electricity | Shows how dependent industries are on own power |
| Grid outage hours | Explains reliability-driven demand |
| Grid tariff vs captive cost | Shows economic attractiveness |
| Fuel cost per kWh | Tracks operating-cost exposure |
| Plant load factor | Measures utilization and project economics |
| Availability factor | Measures reliability of captive assets |
| Renewable share | Tracks cleaner captive power adoption |
| Emissions intensity | Shows carbon-policy exposure |
| Payback period | Connects technical performance to investment decisions |
| Avoided outage cost | Captures the value of resilience |
| Storage capacity | Shows ability to firm renewables and reduce diesel dependence |
| Fuel supply security | Measures exposure to disruption and price volatility |
| Policy exposure | Tracks rule changes, grid charges, and emissions risk |
Captive Power Plant Market Statistics FAQ
Common questions
What is a captive power plant?
A captive power plant is a generation facility built mainly to supply a specific company, factory, mine, data center, industrial site, or business group. It may use coal, gas, diesel, solar, wind, biomass, storage, CHP, or hybrid systems.
Why are companies investing in captive power plants?
Companies invest in captive power to improve reliability, reduce tariff exposure, avoid production losses, serve remote loads, control fuel strategy, and meet emissions targets.
How large is the captive power plant market?
Market estimates vary by definition. Fortune Business Insights values captive power plants at USD 251.50 billion in 2025 and projects USD 446.93 billion by 2034. Zion Market Research uses a broader definition and forecasts USD 905.92 billion by 2032.
Which industries use captive power most?
Captive power is most important in high-load or high-uptime industries such as mining, cement, steel, chemicals, oil and gas, textiles, manufacturing, data centers, industrial parks, and cold storage.
Which region has the strongest captive power demand?
Asia-Pacific is one of the strongest demand regions because it combines industrial expansion, manufacturing growth, mining, and grid constraints. India had 80.93 GW of industrial captive capacity in FY 2023-24, while Indonesia has more than 31 GW of identified captive coal exposure.
Is captive power shifting toward renewables?
Yes, but unevenly. Coal, gas, and diesel remain important for baseload, backup, and remote power, while solar, storage, CHP, waste heat recovery, and hybrids are gaining share as companies reduce fuel and carbon exposure.
What are the biggest captive power investment risks?
Major risks include fuel price volatility, carbon policy, grid charges, open-access rules, technology lock-in, project financing, and maintenance performance. Coal and diesel can provide reliability but may raise long-term exposure.
How should captive power opportunity be measured?
Opportunity should be measured through industrial load, grid reliability, tariff pressure, fuel access, emissions policy, payback, avoided outage cost, emissions intensity, and fuel-price sensitivity.
Final Takeaway
Captive power plant demand is shaped by industrial load growth, grid reliability, electricity cost, fuel strategy, and decarbonization. The market is no longer only about backup power; it is about securing production, protecting margins, and managing long-term energy risk.
Country data explains the market more clearly than global averages. India shows mainstream industrial self-generation, Indonesia shows the captive coal transition challenge, Nigeria shows diesel replacement potential, South Africa shows embedded solar responding to load-shedding, and Saudi Arabia shows large industrial and cogeneration demand.
The technology story is also changing. Coal and diesel remain useful in some applications, but stronger future cases move toward gas, CHP, solar, storage, waste heat recovery, and hybrid portfolios that combine uptime, cost control, lower emissions, and long-term resilience.


