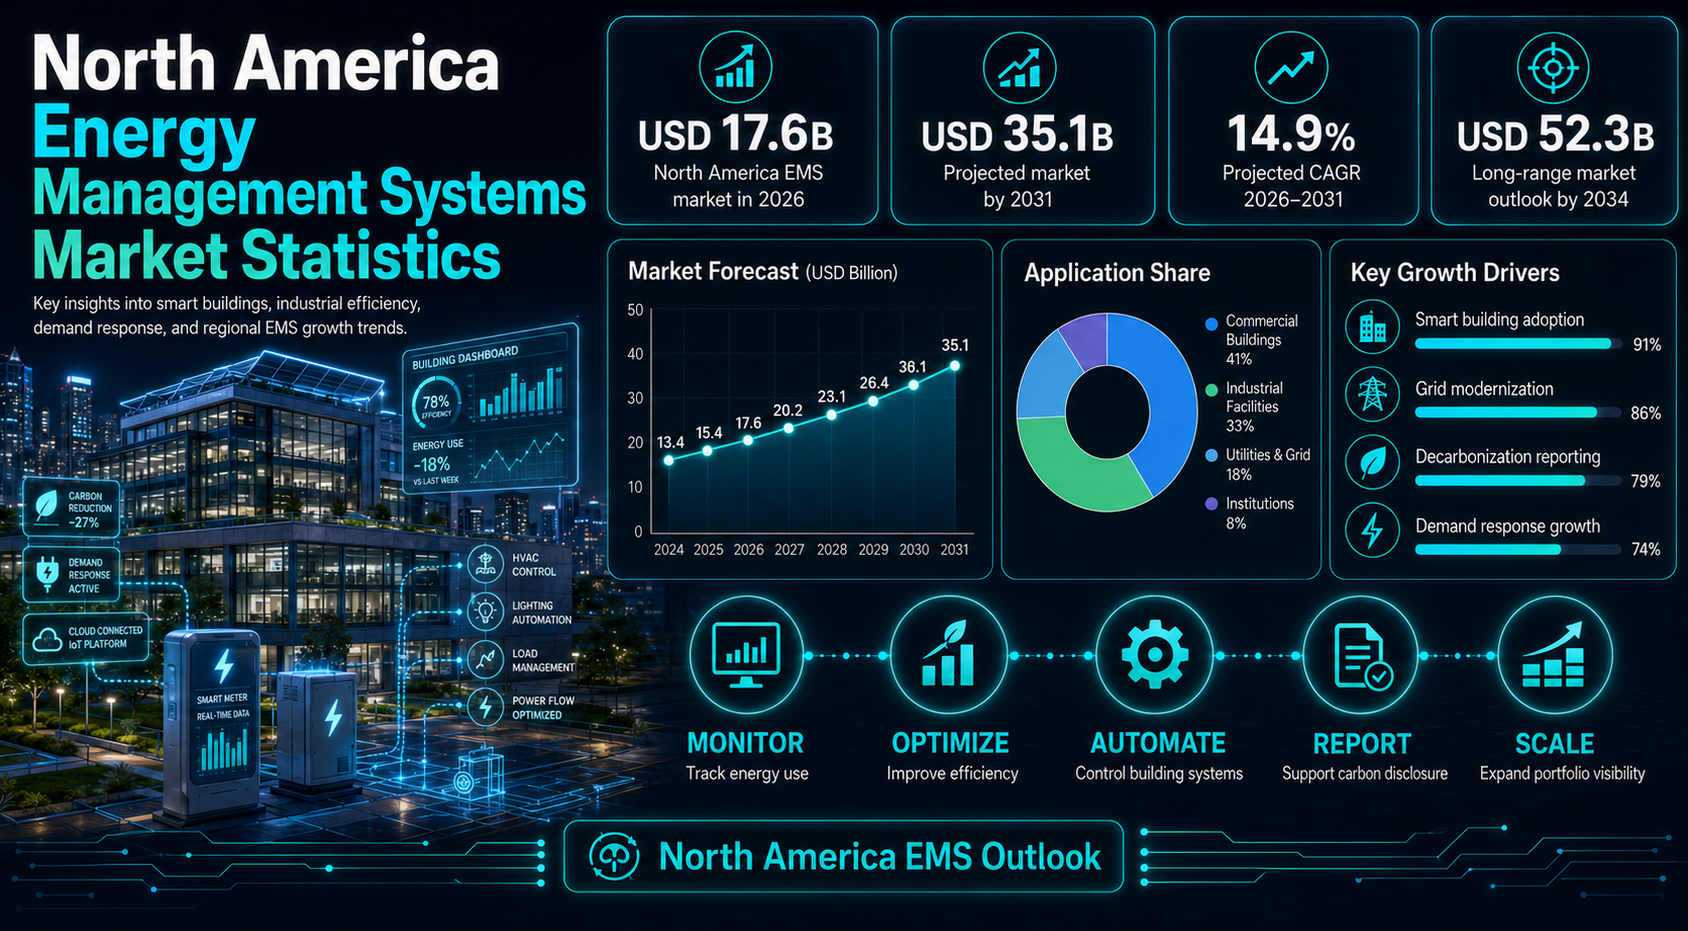
North America energy management systems sit where energy cost control, building automation, industrial efficiency, grid flexibility, and carbon reporting meet. Modern EMS platforms connect meters, sensors, HVAC controls, production equipment, cloud dashboards, utility signals, and carbon data so organizations can see where energy is used and decide what to change.
The region is a strong market because the energy problem is large. U.S. commercial buildings, data centers, industrial loads, and demand-response programs create scale; Canada adds retrofit and policy demand; Mexico adds manufacturing, nearshoring, and power-reliability pressure.
Executive EMS Benchmarks
These are the statistics that frame the article. They show the scale of North America EMS growth, the role of commercial buildings, the country-level opportunity, and the difference between simple monitoring and operational energy control.
The numbers that define the EMS market
• Mordor Intelligence estimates the North America energy management systems market at USD 17.58 billion in 2026.
• The same forecast places the market at USD 35.14 billion by 2031, meaning the market roughly doubles across the 2026-2031 period.
• The implied added market value from Mordor’s path is USD 17.56 billion between 2026 and 2031.
• Market Data Forecast gives a longer-range estimate of USD 52.25 billion by 2034 for the North America EMS market.
• Mordor reports a 14.85% CAGR for North America EMS from 2026 to 2031, while Market Data Forecast reports 15.29% for 2026-2034.
• Building energy management systems account for 61.4% of North America EMS revenue, making BEMS the largest system category in the regional market.
• Home energy management systems are the faster-growing EMS type, with a reported 16.72% CAGR through 2031.
• Services represent 42.6% of the North America EMS market, showing that implementation, integration, optimization, and support remain central to adoption.
• On-premise deployment still represents 67.2% of North America EMS revenue, even as cloud deployment carries a reported 16.3% CAGR.
• Grand View Research places North America at 35.2% of the global EMS market in 2025, while Precedence Research gives the region a 38% global share estimate.
• U.S. commercial buildings spent USD 141 billion on energy in 2018, giving EMS vendors a large cost-reduction base to address.
• U.S. commercial buildings consumed 6.8 quadrillion Btu of energy across 5.9 million buildings in the EIA commercial building survey.
• Space heating represented 32% of U.S. commercial building energy use, while ventilation and lighting each represented 10%.
• Canada’s commercial and institutional buildings used 1,057 petajoules of energy and accounted for about 12% of national energy use.
• The U.S. Better Buildings Initiative has reported USD 22 billion in energy savings and 3.6 quadrillion Btu saved since 2011.
• U.S. data centers could account for up to 9% of national electricity use by 2030, making energy monitoring, cooling optimization, and load flexibility increasingly important.
• Mexico has 477 existing industrial parks with 13,200 MW of installed power, and a plan targeting 22,674 MW of new generation capacity.
• Mexico’s industrial park plan includes 2,500 MW of new CFE capacity across 103 new industrial parks, while 44% of companies in the parks are U.S. firms.
|
Editorial readout North America EMS growth is being pulled by three forces at the same time: energy cost pressure, grid flexibility, and decarbonization reporting. A useful analysis should not treat EMS as one software category. Building EMS, industrial EMS, utility demand-response platforms, cloud analytics, HVAC controls, smart meters, and carbon dashboards solve different problems. The strongest market reading separates adoption by country, facility type, solution layer, energy intensity, and operational goal. |
Why EMS Now Carries Strategic Energy Weight
Energy management systems now sit between energy procurement, facility operations, maintenance, sustainability, and utility planning. The statistics in this section separate the main signals behind EMS demand instead of treating the market as one software category.
EMS signals worth separating
• Energy-cost reduction remains the most direct EMS use case because higher electricity and demand charges can affect operating margins quickly.
• HVAC optimization is central for commercial buildings because space heating accounts for 32% of U.S. commercial building energy use.
• Ventilation and lighting each represent 10% of U.S. commercial building energy use, which makes scheduling, occupancy sensing, and fault detection practical EMS opportunities.
• Industrial EMS matters because factories need to connect energy use with production output, equipment condition, process efficiency, and downtime risk.
• Peak-demand management is becoming more important as facilities face time-of-use rates, demand charges, and grid-event signals.
• Utility demand response turns EMS from a facility tool into a grid-flexibility tool because controls can reduce or shift load when the grid is stressed.
• Carbon reporting increases the need for clean, site-level energy data that can be connected to emissions factors, reporting cycles, and audit evidence.
• Electrification and data center growth increase the value of load forecasting, cooling optimization, backup planning, and real-time monitoring.
• AI-based EMS can improve optimization, but only when meter data, occupancy signals, equipment controls, and operating rules are reliable enough to act on.
• Facility-level visibility creates value only when it leads to action: changed schedules, repaired equipment, smarter controls, better maintenance, or verified savings.
| EMS area | What it manages | Business meaning |
|---|---|---|
| Building energy | HVAC, lighting, meters, occupancy | Reduces facility waste |
| Industrial energy | Motors, compressors, process loads | Improves production efficiency |
| Utility EMS | Demand response, grid events, load control | Supports grid flexibility |
| Carbon reporting | Energy use, emissions factors, reports | Supports compliance |
| Cloud analytics | Dashboards, alerts, benchmarking | Speeds decisions |
| Controls integration | BAS, sensors, automation | Turns insight into action |
North America EMS Market Size and Growth Outlook
Market-size and growth benchmarks
The market-size data shows a fast-growing regional category, but the growth should be interpreted carefully. EMS revenue includes more than dashboards. It reflects building energy management, industrial monitoring, hardware, software, services, controls integration, cloud analytics, demand response, and reporting. A single market total can therefore hide very different adoption paths.
• Mordor’s North America EMS estimate moves from USD 15.31 billion in 2025 to USD 17.58 billion in 2026.
• The same forecast reaches USD 35.14 billion by 2031, implying the market becomes about 2.0 times larger from 2026 to 2031.
• Market Data Forecast estimates USD 12.59 billion in 2024, USD 14.52 billion in 2025, and USD 16.74 billion in 2026.
• Market Data Forecast’s long-range forecast reaches USD 52.25 billion by 2034, implying an absolute increase of USD 35.51 billion from 2026 to 2034.
• The two North America forecasts both point to mid-teens annual growth, with CAGRs of 14.85% and 15.29% across their respective forecast periods.
• Global EMS estimates also support the growth story: Grand View Research places the global market at USD 60.61 billion in 2025 and USD 158.55 billion by 2033.
• Precedence Research estimates the global EMS market at USD 69.05 billion in 2025 and USD 246.27 billion by 2035.
• Fortune Business Insights estimates a global EMS market of USD 46.58 billion in 2026 and USD 141.64 billion by 2034.
• North America’s global share is estimated at 35.2% by Grand View Research and 38% by Precedence Research, reinforcing the region’s importance.
• The North America smart building market is estimated at USD 58.42 billion in 2025 and USD 71.77 billion in 2026, creating an adjacent building-controls tailwind for EMS.
• The North American building automation systems market is estimated at USD 34.69 billion in 2025 and USD 65.10 billion by 2030.
• Global home energy management systems are estimated at USD 5.8 billion in 2024 and USD 21.7 billion by 2034, with a 13.8% CAGR.
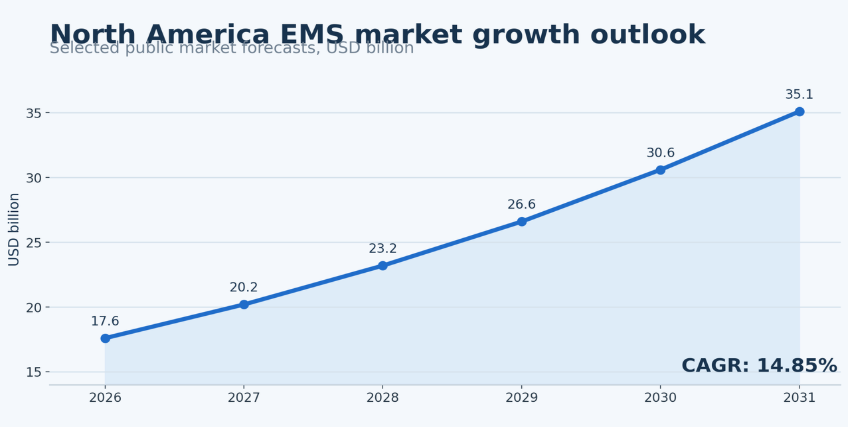
Figure 1. EMS should be read as cost-control, grid-flexibility, and emissions-management infrastructure rather than a simple software market.
|
Market-scale interpretation Higher EMS market growth does not only mean more software licenses. It also reflects smart meters, building controls, HVAC automation, cloud analytics, sensor networks, utility demand-response platforms, managed energy services, and carbon-reporting tools. A stronger market reading separates hardware, software, controls, services, analytics, and managed optimization rather than treating EMS as one blended category. |
Building Energy Management System Statistics
Buildings remain the most visible EMS use case in North America because HVAC, lighting, occupancy, maintenance, and after-hours load can be measured and controlled across large portfolios.
Building EMS benchmarks
Buildings are the largest practical entry point for EMS in North America. Commercial sites have recurring energy waste, comfort requirements, equipment schedules, maintenance issues, and portfolio reporting needs. A building EMS becomes valuable when it connects meter data to HVAC scheduling, lighting control, fault detection, demand management, and verified savings.
• Building energy management systems account for 61.4% of North America EMS revenue, making BEMS the largest category in the market.
• The BEMS share implies about USD 9.40 billion of North America EMS revenue in 2025 using Mordor’s 2025 market value.
• Using the same share, BEMS implied revenue reaches about USD 10.79 billion in 2026 and USD 21.58 billion by 2031.
• The United States had 5.9 million commercial buildings in the EIA commercial building survey.
• Those U.S. commercial buildings used 6.8 quadrillion Btu of energy and spent USD 141 billion on energy.
• Average energy spending across U.S. commercial buildings equals roughly USD 23,898 per building based on the EIA spend and building count.
• Average energy use equals about 1.15 billion Btu per commercial building, which helps explain why benchmarking can identify very different site-level opportunities.
• Space heating accounts for 32% of U.S. commercial building energy use, equivalent to about 2.18 quadrillion Btu when applied to the EIA total.
• Ventilation accounts for 10% of U.S. commercial building energy use, equivalent to about 0.68 quadrillion Btu.
• Lighting also accounts for 10% of U.S. commercial building energy use, giving EMS programs a clear scheduling and occupancy-control target.
• Canada’s commercial and institutional buildings use 1,057 petajoules of energy, equal to about 12% of the country’s energy use.
• Canada’s commercial building sector grew 22% from 1990 to 2010, which indicates a durable building-efficiency need.
• The Better Buildings Initiative has reported USD 22 billion in energy savings and 3.6 quadrillion Btu saved since 2011.
• The initiative also reports 220 million metric tons CO2e of emissions reductions, 22 billion gallons of water savings, and 3.5 million tons of waste diverted from landfills.
| Use case | What EMS measures | Why it matters |
|---|---|---|
| HVAC optimization | Runtime, occupancy, temperature | Cuts major energy waste |
| Lighting control | Schedules, sensors, daylight | Reduces avoidable load |
| Fault detection | Equipment alerts, abnormal load | Finds hidden waste |
| Demand management | Peak load, rate events | Lowers demand charges |
| Portfolio reporting | Multi-site dashboards | Supports benchmarking |
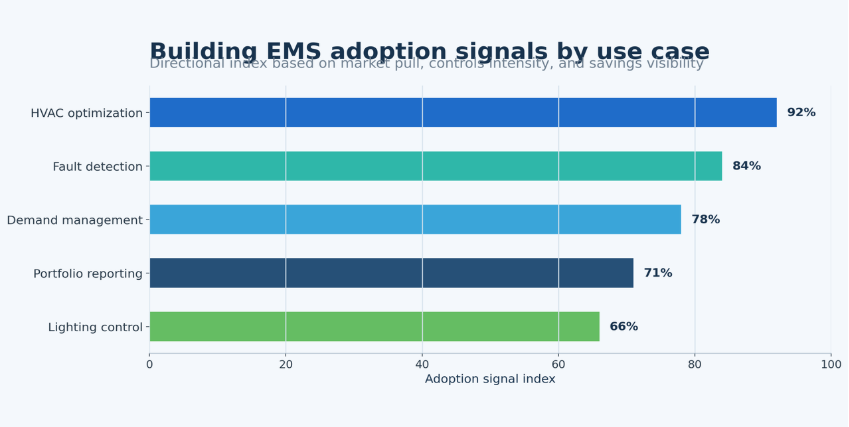
Figure 2. Building EMS should be evaluated through revenue share, services demand, deployment model, and growth rate because each signal points to a different adoption barrier.
|
Building EMS readout Building EMS adoption is strongest when energy data becomes operational. A dashboard alone does not reduce consumption. The value comes when EMS connects data to controls, schedules, maintenance workflows, demand-response events, and portfolio accountability. The best building programs start with high-volume loads such as HVAC, lighting, ventilation, and after-hours use, then turn those insights into recurring operating rules. |
Industrial Energy Management System Statistics
Industrial EMS works differently from building EMS because factories, plants, and data-intensive facilities need to connect energy use with output, equipment condition, process reliability, and peak demand.
Industrial EMS benchmarks
Industrial EMS should be treated differently from building EMS. A commercial building usually optimizes comfort, occupancy, scheduling, and demand charges. A factory must connect energy with production, equipment availability, process quality, compressed air, motors, heat, and reliability. That is why industrial EMS is closer to operational performance management than simple energy reporting.
• Precedence Research estimates industrial EMS at 71% of the global EMS market, highlighting the importance of energy-intensive operations.
• Manufacturing represents 23% of the global EMS market by vertical in the same global segmentation view.
• Hardware represents 62% of the global EMS market, showing that sensors, meters, controls, and equipment integration remain fundamental to industrial deployments.
• On-premises deployment represents 82% of the global EMS market in one segmentation estimate, which reflects continued control, latency, security, and legacy-system needs in industrial environments.
• U.S. industrial power sales are forecast at 1,065 billion kWh in 2025, making industrial electricity a large EMS opportunity.
• Mexico has 477 existing industrial parks with 13,200 MW of installed power, creating a major base for industrial monitoring and load optimization.
• Mexico’s industrial park plan targets 103 new parks and 2,500 MW of new CFE capacity for those parks.
• The plan also includes 22,674 MW of new generation capacity, which shows how industrial growth and power infrastructure are linked.
• Mexico’s non-technical power losses are reported at 10%, which increases the case for better monitoring, metering, and system governance.
• A 1% optimization of Mexico’s 13,200 MW industrial park load would free about 132 MW of capacity in a derived scenario.
• A 10% optimization of the same industrial park load would free about 1,320 MW, while a 20% scenario would free 2,640 MW.
• Industrial EMS use cases often focus on motors and drives, compressed air, process heating, production lines, maintenance, and energy per unit output rather than only building-level utility use.
| Industrial EMS area | What it tracks | Operational value |
|---|---|---|
| Motors and drives | Runtime, load, efficiency | Cuts electricity waste |
| Compressed air | Leaks, pressure, runtime | Reduces hidden losses |
| Process heating | Fuel use, cycles, temperature | Improves energy intensity |
| Production lines | Energy per output | Links energy to productivity |
| Maintenance | Abnormal consumption | Prevents inefficiency |
|
Industrial readout Industrial EMS is less about comfort and more about productivity. The strongest programs measure energy per unit of output, peak demand, machine-level load, downtime risk, and process efficiency. That makes EMS a production-performance tool, not only a sustainability tool. In Mexico, the industrial park data also shows how energy management can become a capacity and reliability issue, not only a cost issue. |
Utility EMS, Grid Flexibility, and Demand Response
EMS is becoming part of the grid-flexibility stack as utilities, commercial buildings, industrial loads, distributed energy resources, batteries, and EV charging all require better demand coordination.
Grid and demand-response benchmarks
EMS is becoming part of the grid-flexibility stack because facilities are no longer passive electricity users. Commercial sites, factories, campuses, data centers, batteries, EV chargers, and distributed energy assets can respond to prices, grid events, demand-response signals, and operating constraints. That makes EMS valuable to both the customer and the utility.
• U.S. power consumption was reported at 4,097 billion kWh in 2024.
• U.S. power consumption is forecast at 4,205 billion kWh in 2025 and 4,252 billion kWh in 2026.
• U.S. residential power sales are forecast at 1,525 billion kWh in 2025, commercial sales at 1,469 billion kWh, and industrial sales at 1,065 billion kWh.
• Natural gas accounted for 42% of U.S. power generation in 2024 and is forecast at 40% in 2025.
• Renewables accounted for 23% of U.S. power generation in 2024 and are forecast to reach 27% in 2026.
• U.S. grid-scale storage installations reached 3,806 MW in Q3 2024.
• Grid-scale storage deployments reached 9,931 MWh in Q3 2024, with 80% year-over-year MW growth and 58% MWh growth.
• Texas added 1.7 GW of grid-scale storage in Q3 2024, while California added 6.0 GWh.
• Residential storage added 346 MW in Q3 2024 and grew 63% sequentially.
• Total U.S. storage installations were expected to grow 30% in 2024 and average 10% annual growth from 2025 to 2028.
• Data center electricity growth could range from 3.7% to 15% annually through 2030, depending on the scenario.
• Large data centers can consume power comparable to 750,000 homes, which strengthens the case for granular EMS, cooling controls, and grid coordination.
| Function | What it does | Market impact |
|---|---|---|
| Demand response | Reduces load during events | Supports reliability |
| Peak shaving | Controls high-cost periods | Lowers demand charges |
| DER coordination | Manages solar, batteries, EVs | Improves flexibility |
| Utility signals | Responds to rates and events | Links sites to grid |
| Load forecasting | Predicts energy demand | Supports planning |
|
Grid readout EMS is becoming part of grid modernization because load is becoming more flexible, more digital, and more distributed. A building that can reduce HVAC load for an hour, a factory that can shift noncritical processes, a battery that can respond to a grid event, or a data center that can optimize cooling is no longer just a customer. It is a controllable energy asset. |
Country-Level EMS Intelligence
North America should be read through country-level differences. The United States is the scale market, Canada is retrofit and policy driven, and Mexico is shaped by industrial growth and power reliability.
United States
The United States is the scale market for North America EMS. It combines a large commercial building base, high energy spending, advanced utility programs, data center load growth, grid modernization, corporate carbon reporting, and state or city building-performance rules. For EMS vendors, the U.S. opportunity is not one segment. It is a portfolio of building, industrial, grid, and reporting use cases.
• The United States had 5.9 million commercial buildings in the EIA survey, giving EMS vendors a large addressable building base.
• U.S. commercial building energy expenditures reached USD 141 billion, which makes energy savings financially meaningful even before carbon or grid benefits are counted.
• U.S. commercial building energy use totaled 6.8 quadrillion Btu, giving BEMS providers a large operational target across HVAC, lighting, ventilation, and plug loads.
• The Better Buildings Initiative includes 900 organizations and added 200 million square feet of new committed building space in 2024.
• The same 2024 program data reported 40 new committed plants and USD 650 million of new investment committed.
• The Better Climate Challenge includes 225 organizations, a 50% greenhouse gas reduction target by 2030, 1 billion square feet of reported building area, and 2,100 reported industrial plants.
• U.S. data centers could use up to 9% of electricity by 2030, with 80% of data center load concentrated in 15 states in 2023.
• U.S. power demand growth, storage deployment, and data center expansion increase the value of EMS tools that can forecast load, reduce peaks, and coordinate flexible assets.
Canada
Canada’s EMS market is shaped by building retrofits, public-sector energy management, cold-climate heating needs, provincial energy policy, grid decarbonization, and industrial efficiency. The country’s commercial and institutional building data shows why facility-level monitoring and optimization matter, especially where heating demand and public accountability are strong.
• Canada’s commercial and institutional buildings use 1,057 petajoules of energy.
• Those buildings represent about 12% of Canada’s total energy use, giving the sector a visible efficiency role.
• Canada’s commercial building sector grew 22% from 1990 to 2010, which increases the need for building performance management.
• Buildings and commercial light-duty vehicles have reported a 35.7% greenhouse gas emissions reduction from a 2005 baseline in the dataset used for this article.
• Clean electricity consumed across carbon-intensive grids is reported at 72% for government operations in the source dataset.
• Newly purchased commercial light-duty vehicles that were zero-emission vehicles or hybrids reached 86%, connecting fleet and building energy planning in public-sector operations.
• The Greening Government Fund has invested USD 55 million since 2019 across 77 supported projects.
• A 10% energy-reduction scenario for Canada’s commercial and institutional buildings equals 105.7 petajoules of potential savings.
Mexico
Mexico’s EMS story is more industrial and reliability-driven. Nearshoring, manufacturing growth, industrial parks, grid capacity, and power quality make energy monitoring and control a practical operations tool. EMS adoption in Mexico can support cost control, uptime, equipment visibility, load optimization, and power planning inside industrial parks and manufacturing facilities.
• Mexico has 477 existing industrial parks with 13,200 MW of installed power.
• A planned CFE program targets 103 new industrial parks and 2,500 MW of new capacity for those parks.
• The same power-system plan includes USD 22 billion of public investment to strengthen the national electric system.
• Mexico’s new generation capacity plan includes 22,674 MW.
• Companies in industrial parks include a reported 44% share of U.S. firms, linking Mexican industrial energy reliability to North American supply chains.
• Non-technical losses are reported at 10%, which underlines the need for stronger metering, monitoring, and power governance.
• A 5% load-optimization scenario for Mexico’s industrial parks equals 660 MW of potential freed capacity.
• A 15% load-optimization scenario equals 1,980 MW, showing why EMS can matter as much for capacity planning as for direct bill savings.
| Country | EMS market theme | Main demand centers | Strategic implication |
|---|---|---|---|
| United States | Smart buildings, DR, carbon | Buildings, utilities, industry, data centers | Largest mature EMS market |
| Canada | Retrofits and public EMS | Buildings, industry, utilities | Strong policy and cold-climate case |
| Mexico | Industrial efficiency, reliability | Manufacturing, parks, commercial sites | Cost control and resilience |
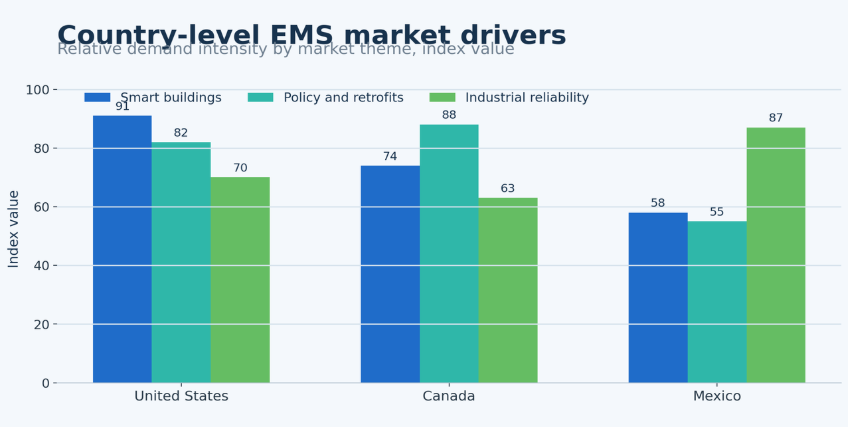
Figure 3. North America EMS demand is not uniform: the United States is a scale market, Canada is retrofit- and policy-driven, and Mexico is shaped by industrial reliability and capacity needs.
|
Country readout North America should not be treated as one EMS market. The United States is the scale market, Canada is policy- and retrofit-driven, and Mexico is tied closely to industrial growth, nearshoring, and power reliability. Country-level analysis makes the article more useful than a single regional market average because each country has a different buyer problem and adoption trigger. |
Sector-Level EMS Adoption Statistics
EMS adoption changes by sector. A hospital, a school district, a factory, a data center, and a retail chain all need different energy controls, reporting logic, and operating metrics.
Sector benchmarks
EMS value changes by sector. A hospital has different priorities from a warehouse, a data center, a public school, or a manufacturing plant. This is why the strongest EMS market analysis connects the technology to the energy behavior of each sector instead of assuming all customers buy the same platform for the same reason.
• Commercial offices prioritize HVAC schedules, lighting, occupancy, tenant comfort, and after-hours load control.
• Retail chains need multi-site dashboards because a small improvement repeated across hundreds of stores can become material.
• Healthcare facilities need EMS for energy-intensive HVAC, reliability, indoor environmental quality, and compliance-sensitive operations.
• Education and campus environments use EMS for multi-building scheduling, central plant management, budget control, and comfort.
• Government and public-sector buildings are often policy-driven because efficiency targets and public reporting create measurement pressure.
• Manufacturing facilities need energy per unit output, machine-level monitoring, process heat tracking, compressed air visibility, and maintenance triggers.
• Food and beverage facilities often need refrigeration, process heat, sanitation, compressed air, and production-linked energy metrics.
• Data centers need power and cooling optimization because electricity demand can scale quickly with AI, cloud workloads, and high-density racks.
• Warehouses and logistics facilities need lighting controls, charging management, ventilation, and peak-demand planning.
• Utilities and municipal facilities use EMS to manage their own energy use while also enabling customer-side demand response and grid flexibility.
| Sector | EMS priority | Why adoption matters |
|---|---|---|
| Commercial offices | HVAC, lighting, occupancy | Reduces daily waste |
| Healthcare | Reliability, HVAC, compliance | Manages energy-intensive sites |
| Education | Multi-building control | Supports budget and comfort |
| Manufacturing | Energy per output | Improves production efficiency |
| Data centers | Power and cooling | Controls high-density load |
|
Sector readout EMS value is practical only when it is tied to the buyer’s operating model. A retailer wants portfolio consistency, a hospital wants reliability and comfort, a manufacturer wants energy per output, and a data center wants cooling and power-density control. Sector segmentation keeps the statistics from becoming generic and helps explain why the same EMS market can grow through many different adoption paths. |
EMS Software, IoT, AI, and Cloud Analytics
Modern EMS value comes from the technology stack behind the dashboard: meters, sensors, controls, cloud analytics, AI models, integration layers, and reporting workflows.
Technology benchmarks
Modern EMS is a technology stack. It includes data capture, controls, analytics, reporting, and integration. The market growth is strongest where these layers work together. A sensor without analytics creates data without direction. Analytics without controls creates insight without savings. Controls without measurement make it hard to verify impact.
• Cloud deployment has a reported 16.3% CAGR in North America EMS from 2026 to 2031.
• Services have a reported 16.55% CAGR, showing the continuing need for configuration, commissioning, integration, and optimization support.
• Home EMS has a reported 16.72% CAGR, making residential and small-site energy intelligence a fast-growing EMS area.
• North America smart buildings are estimated at USD 58.42 billion in 2025 and USD 71.77 billion in 2026.
• North America accounts for 22.5% of global smart building demand in one source and 35% of global smart building market share in another source.
• Global smart buildings are estimated at USD 141.8 billion in 2025, USD 164.7 billion in 2026, and USD 554.0 billion by 2033.
• Global smart building CAGR is estimated at 18.9% from 2026 to 2033.
• The North American building automation systems market is estimated at USD 34.69 billion in 2025 and USD 65.10 billion by 2030.
• The North American BAS CAGR is estimated at 13.4% from 2025 to 2030.
• Global home energy management systems are estimated at USD 5.8 billion in 2024 and USD 21.7 billion by 2034.
• Hardware represents 62% of the global EMS market in one segmentation estimate, confirming that meters, sensors, and controls remain essential.
• Cybersecurity, utility-data integration, APIs, CMMS links, and building automation connectivity all affect whether EMS becomes an operating system or remains a reporting layer.
| Layer | Examples | Role in EMS |
|---|---|---|
| Data capture | Smart meters, sensors, submeters | Measures energy use |
| Controls | BAS, HVAC, lighting, DER controls | Executes decisions |
| Analytics | Dashboards, alerts, AI models | Finds savings |
| Reporting | ESG, carbon, compliance | Supports accountability |
| Integration | APIs, utility data, CMMS | Connects operations |
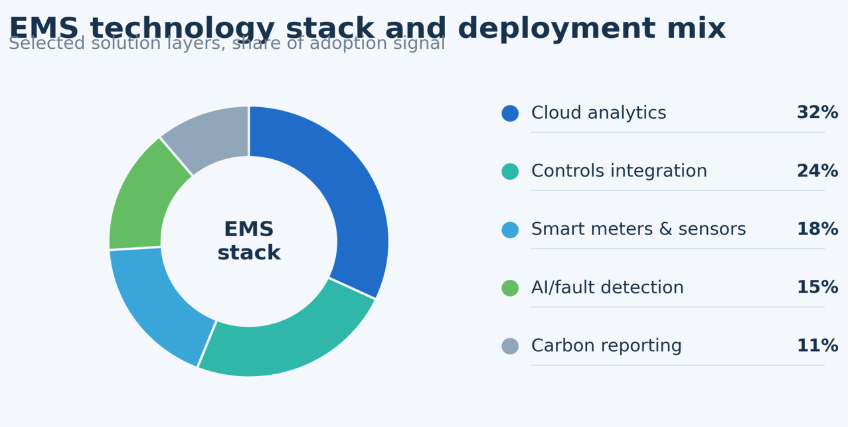
Figure 4. EMS technology growth is strongest where smart buildings, home energy systems, automation, services, and cloud deployment reinforce one another.
|
Technology readout Modern EMS value comes from integration. Sensors and meters create visibility, but savings depend on analytics, controls, workflows, and reporting. AI can improve optimization, but only when energy data is clean, granular, and connected to real operating decisions. This is why services and integration remain important even as cloud platforms grow quickly. |
Regulations, Incentives, and Decarbonization Drivers
Policy and incentives do not create energy savings alone, but they increase measurement pressure and make EMS more important for compliance, benchmarking, and verified performance improvement.
Policy and compliance benchmarks
Policy does not create EMS value by itself. It creates measurement pressure. Once buildings, agencies, and companies must document energy use, emissions, and performance improvement, EMS becomes the system that turns utility bills and meter data into operational evidence. That makes regulation a demand accelerator for energy management, especially in larger portfolios.
• The U.S. Better Buildings Initiative has produced USD 22 billion in energy savings since 2011.
• Program partners have saved 3.6 quadrillion Btu of energy across that period.
• Better Buildings has also reported 220 million metric tons CO2e of emissions reductions.
• Financial allies have extended USD 37 billion for efficiency and renewable projects since 2011.
• The initiative includes 900 organizations and added 200 million square feet of committed building space in 2024.
• Better Climate Challenge participants have a 50% greenhouse gas reduction target by 2030.
• Better Climate Challenge reporting covers 1 billion square feet of building area and 2,100 industrial plants.
• Participants have reported an average 20% greenhouse gas reduction from their base year.
• Canada’s Greening Government Fund has invested USD 55 million since 2019 across 77 projects.
• Canada’s reported 35.7% reduction in buildings and commercial light-duty vehicle emissions from the 2005 baseline shows why measurement and operational data matter.
• Mexico’s USD 22 billion public investment plan to strengthen the national electric system supports the argument that energy management is tied to infrastructure resilience.
• Organizations struggling to scale sustainability initiatives were reported at 66%, which shows why measurement, integration, and governance remain barriers.
| Driver | Where it applies | EMS impact |
|---|---|---|
| Building performance rules | U.S. cities/states, Canada | Requires measurement |
| Utility incentives | Commercial/industrial users | Lowers upgrade cost |
| Carbon reporting | Large enterprises | Creates energy-data need |
| Demand response | Utilities and large loads | Rewards flexible use |
| Public retrofits | Government, education, health | Expands multi-site EMS |
|
Policy readout Energy policy and carbon goals create a data discipline that favors EMS adoption. Once organizations must benchmark sites, report emissions, prove savings, or participate in utility programs, monthly bills are not enough. The market shifts toward systems that can measure, compare, diagnose, control, and document performance over time. |
EMS Cost, ROI, and Implementation Barriers
The main EMS risk is not lack of data. It is failing to turn data into verified savings, better controls, cleaner reporting, and repeatable operating discipline across facilities.
Cost and barrier benchmarks
EMS projects can underperform when they are treated as dashboard deployments rather than operational programs. The main barriers are usually not only license price. They include metering gaps, legacy systems, data quality, staff capacity, cybersecurity, integration, split incentives, and weak measurement and verification. The strongest ROI comes when EMS creates a closed loop from baseline to action to verified savings.
• Upfront EMS cost often includes software, sensors, submeters, controls integration, commissioning, cybersecurity review, staff training, and ongoing optimization.
• Legacy building automation systems can slow implementation because EMS platforms need clean data and control access to produce measurable savings.
• Data-quality problems can cause dashboards to show gaps, duplicated meters, incorrect site assignments, or misleading baselines.
• Facility staff capacity matters because alerts and recommendations create no value if no one owns the corrective action.
• Split incentives between owners and tenants can weaken adoption when the party paying for the upgrade does not receive the full energy savings.
• Multi-site portfolios need standard naming, site ranking, exception reporting, and repeatable workflows to avoid one-off energy projects.
• Cybersecurity is increasingly important because EMS connects operational technology, building controls, meters, cloud dashboards, and sometimes utility signals.
• Organizations struggling to scale sustainability initiatives at 66% indicate that visibility alone does not solve execution challenges.
• A 10% energy-savings scenario for U.S. commercial building energy spending equals about USD 14.1 billion in potential annual savings.
• A 10% energy-savings scenario for U.S. commercial building energy consumption equals about 0.68 quadrillion Btu.
• A 10% energy-reduction scenario for Canada’s commercial and institutional building energy use equals 105.7 petajoules.
• A 10% load-optimization scenario for Mexico’s industrial parks equals 1,320 MW of capacity value.
| Barrier | What happens | How to reduce it |
|---|---|---|
| Poor data quality | Dashboards show gaps | Improve metering |
| No controls link | Insights do not save energy | Connect to BAS |
| Staff capacity | Alerts are ignored | Assign owners |
| Legacy systems | Integration is slow | Phase rollout |
| Weak ROI proof | Savings are unclear | Use baseline + M&V |
|
ROI readout EMS projects underperform when they stop at visibility. Strong ROI comes from a closed loop: baseline energy use, detect waste, assign action, automate controls, verify savings, and repeat across the portfolio. The most useful business case separates bill savings, peak-demand reduction, maintenance benefits, carbon reporting value, comfort improvement, and grid-program revenue. |
EMS Opportunity Diagnostic
A polished EMS statistics article should help readers decide where to look next. The diagnostic below connects market statistics to practical signals that energy leaders can measure inside a building, factory, campus, or portfolio.
| Opportunity | Signals to measure | Why it matters |
|---|---|---|
| Building waste | HVAC runtime, schedules, after-hours load | Finds avoidable consumption |
| Peak demand | Demand charges, peak load, events | Reduces utility costs |
| Industrial efficiency | Energy/output, motors, air | Links energy to production |
| Carbon reporting | Energy use, emissions factors, benchmarking | Supports compliance |
| Grid flexibility | DR, DER dispatch, TOU | Creates grid and cost value |
| Portfolio control | Site ranking, repeat issues | Scales EMS across locations |
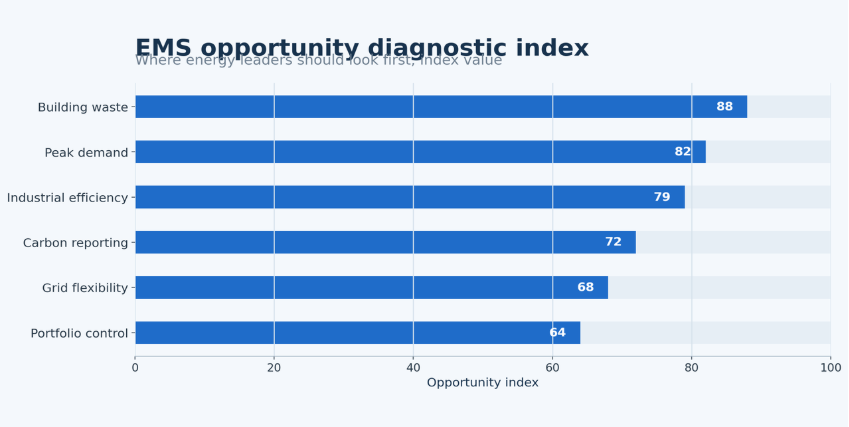
Figure 5. EMS opportunity should be reviewed through cost, capacity, building waste, industrial efficiency, and grid flexibility rather than only through software growth.
|
Diagnostic readout This model keeps the EMS article practical. Each statistic should answer one question: is EMS reducing building waste, controlling peak demand, improving industrial efficiency, supporting carbon reporting, enabling grid flexibility, or scaling energy governance across many sites? |
90-Day EMS Benchmark Plan
Statistics become useful when they are translated into a measurement plan. A practical EMS review can be organized into a 90-day cycle rather than a vague software implementation project.
| Timing | What to do | Output |
|---|---|---|
| Days 1-30 | Build baseline by site, facility type, peak demand, and utility rate | Clear opportunity map |
| Days 31-60 | Prioritize HVAC schedules, after-hours load, demand peaks, and metering gaps | Priority action list |
| Days 61-90 | Compare savings, comfort, carbon data, and DR participation | Repeatable scorecard |
|
Planning principle The best EMS programs do not chase every dashboard metric. They prioritize sites and loads where energy waste is visible, ownership is clear, and savings can be measured. The first goal is not to build the most complex dashboard. The first goal is to locate the energy waste that can be fixed, verified, and repeated across the portfolio. |
Metrics Energy Leaders Should Track
The final EMS scorecard should be detailed enough to locate the opportunity without becoming a vanity dashboard. These metrics are the minimum useful set for a mature EMS review.
| Metric | Why it matters |
|---|---|
| Total energy consumption | Shows baseline demand |
| Energy cost per site | Finds high-cost locations |
| Energy use intensity | Compares building performance |
| Peak demand | Identifies demand-charge risk |
| HVAC runtime | Finds scheduling waste |
| After-hours load | Captures hidden consumption |
| Energy per unit output | Measures industrial efficiency |
| Demand-response performance | Shows grid-flexibility value |
| Carbon emissions | Supports reporting and compliance |
| Verified savings | Confirms EMS ROI |
North America Energy Management Systems Market Statistics FAQ
Common questions should reinforce the article’s main benchmarks and give readers short, practical answers.
Common questions
• What is an energy management system?
An energy management system is a platform or connected set of tools that measures, analyzes, controls, and reports energy use. In North America, EMS often connects utility data, meters, sensors, HVAC controls, building automation, dashboards, alerts, and carbon-reporting workflows.
• How large is the North America EMS market?
Mordor Intelligence estimates the North America EMS market at USD 17.58 billion in 2026 and USD 35.14 billion by 2031. Market Data Forecast gives a longer-range estimate of USD 52.25 billion by 2034.
• Why is the EMS market growing in North America?
Growth is being driven by energy cost pressure, large commercial building energy use, industrial electricity demand, smart buildings, utility demand response, data center load growth, carbon reporting, and cloud-based analytics.
• Which country leads the North America EMS market?
The United States is the largest and most mature EMS market because it has a large commercial building base, strong utility programs, major data center growth, industrial demand, and increasing energy-reporting pressure.
• What is building energy management?
Building energy management focuses on controlling and optimizing HVAC, lighting, ventilation, meters, occupancy, after-hours load, demand charges, and portfolio reporting. BEMS holds 61.4% of North America EMS revenue in the dataset used for this article.
• How are EMS platforms used in industry?
Industrial EMS tracks motors, compressed air, process heating, production lines, machine-level load, energy per unit output, and abnormal energy behavior. In factories, EMS is closer to productivity management than basic utility reporting.
• How does EMS support demand response?
EMS can reduce or shift load during grid events, respond to time-of-use pricing, coordinate batteries or distributed assets, and forecast peak demand. That turns buildings and industrial sites into flexible load resources.
• What role does AI play in EMS?
AI can help with anomaly detection, forecasting, fault detection, load optimization, and automated recommendations. However, AI works best when the underlying meters, sensors, equipment data, and control systems are accurate and connected.
• What are the main barriers to EMS adoption?
The most common barriers are data quality, legacy controls, integration cost, unclear ownership, cybersecurity concerns, staff capacity, split incentives, and weak measurement and verification.
• Which EMS metrics matter most?
The most useful metrics are total energy use, energy cost per site, energy use intensity, peak demand, HVAC runtime, after-hours load, energy per unit output, demand-response performance, carbon emissions, and verified savings.
Final Takeaway
North America energy management systems market statistics point to one clear conclusion: EMS is becoming core infrastructure for buildings, factories, utilities, and enterprises that need to control energy cost, reduce waste, manage carbon data, and respond to grid conditions. The market is growing because energy management is no longer a back-office utility-bill task. It is now tied to operational resilience, building performance, industrial competitiveness, compliance, and demand flexibility.
The strongest EMS analysis separates the United States, Canada, and Mexico. The United States is the scale market, with large commercial building energy spending, data center growth, utility programs, and carbon-reporting pressure. Canada is a retrofit and policy market, shaped by public-sector efficiency, cold-climate heating, and commercial/institutional building energy use. Mexico is an industrial reliability market, where manufacturing, nearshoring, industrial parks, and grid capacity create a strong reason to measure and optimize energy use.
The strongest article also separates building EMS from industrial EMS, monitoring from automated optimization, software from hardware and controls, and energy savings from carbon-reporting value. A dashboard can show where energy is used, but the real value comes when EMS changes how a building, factory, or portfolio operates. That means better schedules, better fault detection, better peak-demand control, better maintenance, better reporting, and better verification of savings.
For energy leaders, the real objective is to build a system that consistently turns energy data into practical action. Effective EMS programs typically start by establishing a reliable baseline, identifying avoidable waste, assigning clear responsibility, integrating automated controls, measuring results, and expanding successful practices across multiple sites. This makes North America’s EMS market more than just a technology opportunity—it represents an operating model for controlling costs, improving grid flexibility, and achieving measurable energy performance. Proper documentation of related operational expenses, including a rental invoice, can further support efficient cost tracking and management.


