Philippines foodservice is where everyday meals, quick-service chains, mall dining, neighbourhood eateries, cafés, delivery apps, street stalls, and tourism spending meet. The market is broad because consumers use restaurants for different occasions: affordable weekday meals, family dining, office lunches, coffee breaks, celebrations, late-night snacks, and convenient delivery orders.
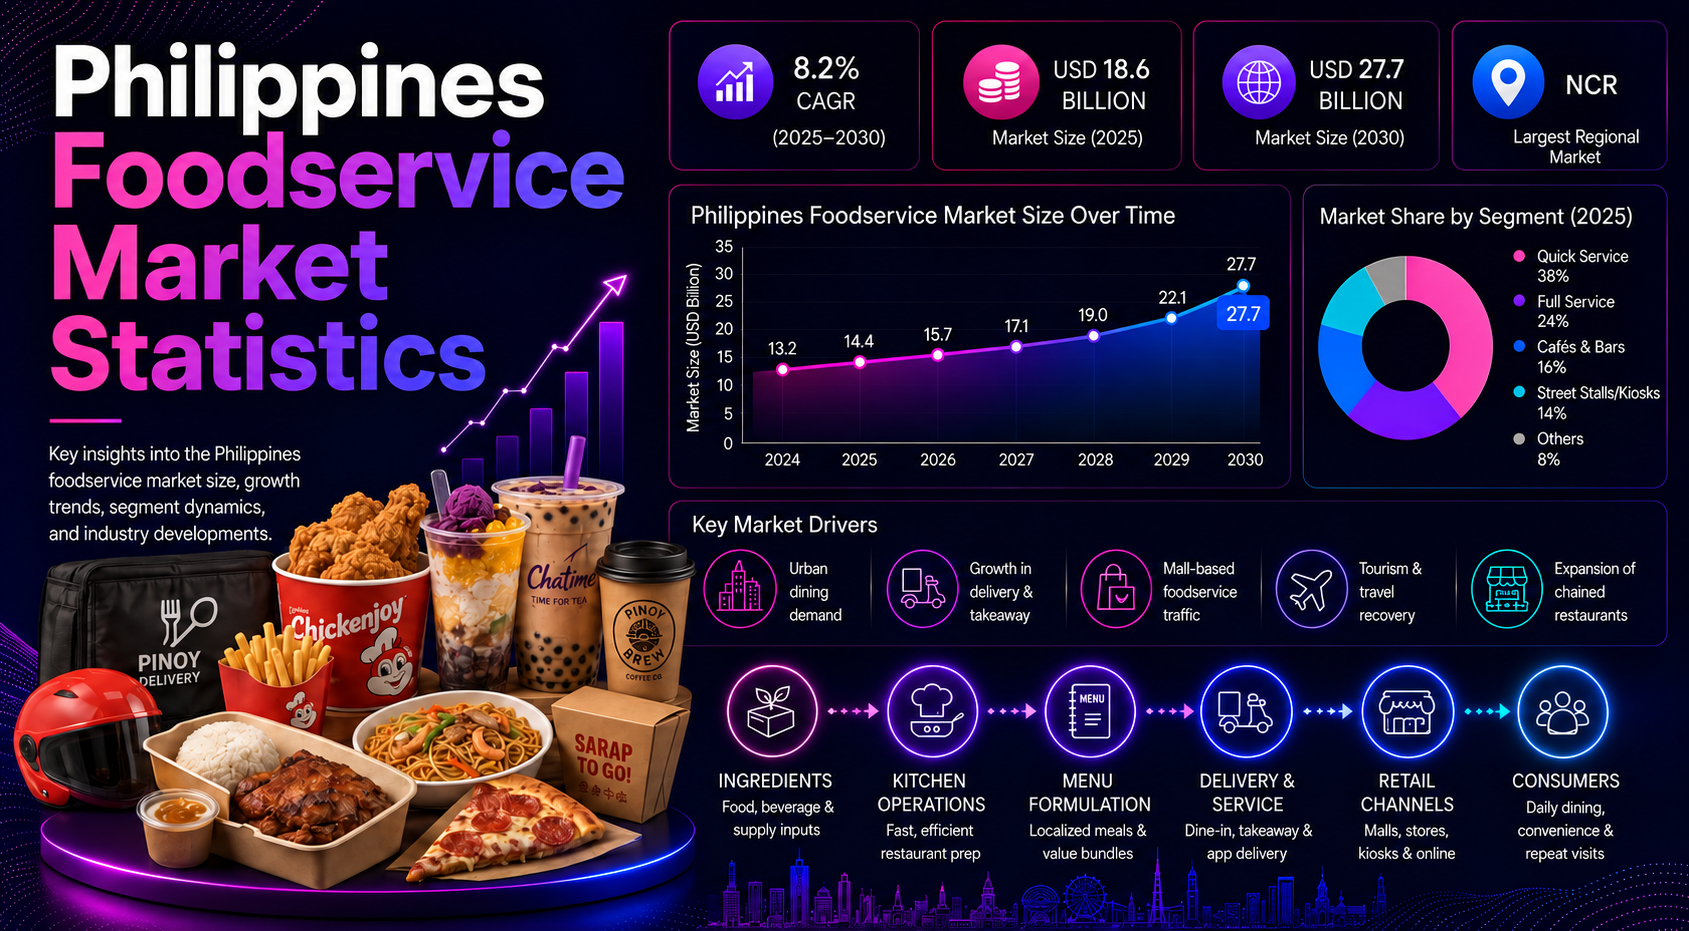
The strongest numbers show a market that has moved well beyond recovery. The Philippines foodservice market was estimated at USD 18.41 billion in 2025 and is expected to rise to USD 21.04 billion in 2026 before reaching USD 40.98 billion by 2031. Quick-service restaurants accounted for 57.28% of foodservice revenue in 2025, independent operators held 74.42% of outlets, and delivery is forecast to grow at a 15.78% CAGR through 2031.
Demand is best read by format, channel, location, region, brand structure, tourism exposure, and cost pressure. NCR remains the densest establishment base, CALABARZON and Central Luzon add scale outside Metro Manila, and digital ordering keeps changing how restaurants compete for repeat meals.
Executive Philippines Foodservice Benchmarks
These statistics frame the market. They show the size of the category, the formats that carry demand, the channels changing ordering behavior, and the regional base behind outlet growth.
The numbers that define the Philippines foodservice market
- The Philippines foodservice market was estimated at USD 18.41 billion in 2025, giving operators a large base-year opportunity across restaurants, cafés, kiosks, delivery, and travel-linked venues.
- Market value is expected to reach USD 21.04 billion in 2026 and USD 40.98 billion by 2031, showing that growth is expected to continue well past the immediate recovery phase.
- Total foodservice is forecast to expand at a 14.27% CAGR from 2026 to 2031, which places the Philippines among the faster-growing foodservice markets in Southeast Asia.
- Quick-service restaurants led with 57.28% of foodservice revenue in 2025, making speed, value meals, delivery readiness, and brand familiarity central to the market.
- Independent operators held 74.42% of outlets in 2025, showing that the country remains highly local even as chains and franchise systems expand.
- Chained concepts are forecast to grow at a 14.18% CAGR through 2031, so franchise systems, store rollout, and brand operations will shape formal market growth.
- Dine-in maintained a 52.64% service share in 2025, proving that restaurants still rely on physical traffic even as digital orders become more important.
- Delivery is forecast to grow at a 15.78% CAGR through 2031, which makes kitchen throughput, platform economics, and packaging cost part of the revenue story.
- Standalone stores captured 41.63% of spend in 2025, while retail and mall-based locations remain important because shopping, entertainment, and dining are closely linked.
- Lodging-based venues are projected to grow at a 14.90% CAGR through 2031 as visitor spending and hotel activity return to stronger levels.
- NCR led with 9,338 accommodation and food service establishments in 2022, equal to 30.3% of the selected establishment base tracked in the workbook.
- CALABARZON ranked second with 4,604 establishments in 2022, while Central Luzon followed with 3,286 establishments, giving the market a strong Luzon concentration.
- Online ordering rose from USD 829.5 million in 2019 to USD 1,937.5 million in 2023, showing that app-based demand kept a larger role even after dining rooms reopened.
- Inbound tourism generated 6,484,060 total arrivals and PHP 694 billion in receipts in 2025, supporting restaurants in hotels, airports, resorts, tourist districts, and leisure locations.
- Jollibee Foods Corp recorded a 30.7% value share in 2023, while McDonald’s Corp recorded 10.3%, highlighting a market where a local champion competes at scale with global brands.
Brand strength matters because foodservice is a trust market as much as a convenience market. Familiar brands can turn new locations, delivery listings, and family bundles into repeat purchases faster than unknown operators. Independent restaurants still compete strongly, but they often win through local taste, neighborhood access, price flexibility, and loyal regular customers.
Editorial readout
The headline numbers point to six forces behind Philippines foodservice demand: quick-service scale, independent operator depth, delivery growth, mall and standalone traffic, tourism recovery, and regional concentration around NCR, CALABARZON, and Central Luzon. A practical market view separates demand by format, channel, location, brand, and region rather than treating foodservice as one national number.
Why Foodservice Matters in the Philippines Economy
Foodservice matters because it connects household spending, urban mobility, employment, retail traffic, tourism, and agriculture-linked supply chains. A meal bought at a quick-service counter or ordered through a delivery app affects restaurant labor, packaging, poultry and beverage demand, kitchen capacity, platform fees, and mall footfall.
The category also reflects Filipino dining habits. Consumers move between branded chains and local eateries depending on price, time, convenience, cravings, location, and family needs. That gives the market a mixed structure: modern chains scale quickly, but independent restaurants and stalls stay central because they remain close to neighborhoods, workplaces, schools, terminals, and local food cultures.
Foodservice also works as a local business system. A single restaurant sale can involve rice, chicken, seafood, bakery inputs, packaging, delivery riders, mall leases, utility costs, and frontline labor. That is why foodservice statistics should be read with both sales and operating pressure in mind: higher traffic helps operators, but profitability still depends on menu pricing, rent, platform fees, staffing, and supply reliability.
- Accommodation and food service activity had a dense establishment base in 2022, with NCR, CALABARZON, and Central Luzon together accounting for a large share of tracked establishments.
- NCR alone accounted for 30.3% of establishments in 2022, linking foodservice demand to Metro Manila offices, malls, transport flows, tourism, and delivery density.
- CALABARZON held a 14.9% establishment share and also accounted for 14.7% of national GDP in 2024, which supports suburban dining and regional outlet expansion.
- Central Luzon represented 10.6% of establishments in 2022, with road corridors, logistics, malls, and Clark-related travel supporting foodservice activity.
- Tourism added 6,484,060 inbound arrivals in 2025, giving lodging, leisure, and travel foodservice a stronger demand base than domestic household spending alone.
| Economic signal | Foodservice implication |
|---|---|
| Urban mobility | Supports quick meals, takeaway, coffee, and delivery around offices, malls, terminals, and schools. |
| Employment and establishments | Shows why foodservice is both a consumer market and a local jobs engine. |
| Tourism and travel | Raises demand for hotel restaurants, cafés, airports, resorts, and destination dining. |
| Regional GDP concentration | Explains why outlet expansion starts in NCR and surrounding Luzon growth corridors. |
| Household convenience | Keeps QSRs, food courts, delivery, and affordable independent eateries relevant. |
Philippines Foodservice Market Size and Forecast
The market-size data shows a strong forward path. The Mordor benchmark gives the Philippines foodservice market a 2025 value of USD 18.41 billion and a 2031 forecast of USD 40.98 billion. That implies more than a simple rebound. It suggests sustained expansion across branded QSRs, independent restaurants, delivery, cafés, travel venues, and retail-linked dining.
The practical readout is that operators should separate traffic growth from ticket growth. A higher market value can come from more visits, higher menu prices, larger family orders, premium beverages, delivery fees, or a wider chain footprint. Those sources do not carry the same margin profile, so the healthiest growth is the one that raises repeat visits without making the menu feel unaffordable.
- The market is expected to rise from USD 18.41 billion in 2025 to USD 21.04 billion in 2026, giving the near-term forecast a strong step-up before the longer 2031 target.
- By 2031, the market is forecast to reach USD 40.98 billion, which would more than double the 2025 market value if the forecast path holds.
- The 14.27% CAGR forecast from 2026 to 2031 points to a market where chain expansion, delivery, lodging, and cloud kitchens can all contribute to growth.
- Consumer foodservice by type moved from USD 7,030.2 million in 2020 to USD 12,466.9 million in 2023, showing a major recovery from the pandemic low.
- The same AAFC/Euromonitor series forecasts consumer foodservice sales of USD 17,043.7 million by 2027, equal to an 8.1% CAGR for 2023–2027.
- Chained consumer foodservice is forecast to rise from USD 8,697.9 million in 2023 to USD 11,586.2 million in 2027, while independent foodservice is forecast to grow from USD 3,768.9 million to USD 5,457.5 million.
That mix makes the forecast useful for more than sales planning. A brand opening stores in the Philippines needs to read value growth against outlet density, meal occasion, channel cost, and consumer affordability. A high-growth forecast can support expansion, but the stronger opportunity is usually where traffic, delivery density, mall access, and menu pricing all move in the same direction.
| Market signal | What it shows | Why it matters |
|---|---|---|
| USD 18.41 billion in 2025 | Current scale of national demand | Gives the market a strong base for chain, independent, and delivery strategies. |
| USD 40.98 billion by 2031 | Long-range expansion potential | Shows why operators are still investing in store rollout and digital capacity. |
| 14.27% CAGR | Forecast speed of growth | Highlights a faster-growth market relative to many mature foodservice economies. |
| 57.28% QSR revenue share | Format concentration | Shows why speed, value, and branded meals carry large sales weight. |
| 74.42% independent outlet share | Outlet fragmentation | Keeps local operators and neighborhood demand central to the market. |
Market-size interpretation
The market should not be read only through one value. A useful interpretation combines foodservice sales, QSR revenue share, independent outlet share, ordering channel growth, lodging recovery, and regional establishment concentration. Growth comes from more than restaurant openings; it also comes from ordering behavior, menu pricing, delivery adoption, tourism recovery, and mall traffic.
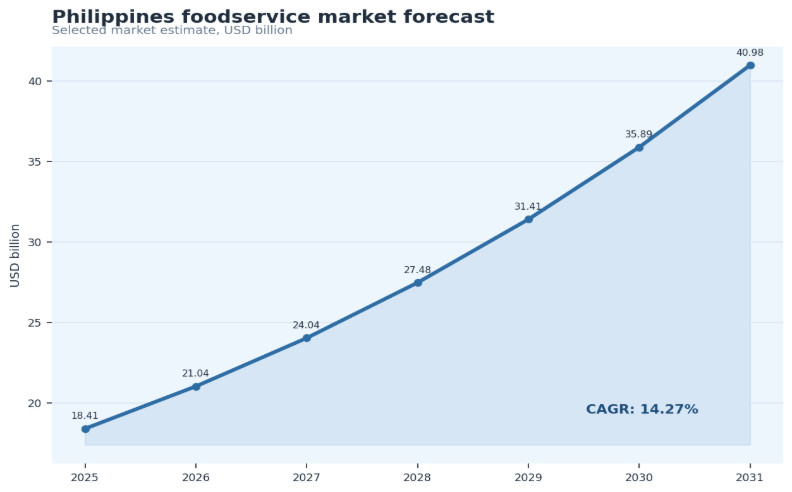
Figure 1. Philippines foodservice growth should be read alongside urban dining, delivery adoption, tourism recovery, and chained restaurant expansion because category value is rising through several channels at once.
Quick-Service, Full-Service, Cafés, Bars, and Street Food Statistics
Restaurant format is the clearest way to understand where demand is concentrated. Quick-service restaurants provide the strongest scale because they combine speed, value, brand trust, delivery, and repeat meal occasions. Full-service restaurants remain important for family meals, celebrations, tourist dining, and casual group occasions. Cafés and bars add a different growth layer through beverages, social visits, work-friendly environments, and young urban consumers.
Quick-service restaurant statistics
- Limited-service restaurants recorded USD 7,043.7 million in sales in 2023, making the format the largest named foodservice category in the AAFC/Euromonitor data.
- Chained limited-service restaurants generated USD 6,921.7 million in 2023, showing how strongly branded QSRs dominate the limited-service format.
- Limited-service restaurants posted a 3.1% CAGR for 2019–2023 despite the pandemic drop, while chained limited-service posted a 3.4% CAGR over the same period.
- Quick-service restaurants held 57.28% of foodservice revenue in 2025, which makes QSR pricing, value meals, delivery integration, and store throughput central market variables.
Full-service restaurant statistics
- Full-service restaurants recorded USD 2,065.3 million in 2023 and are forecast to reach USD 2,928.5 million in 2027.
- Full-service restaurants are forecast at a 9.1% CAGR for 2023–2027, reflecting recovery in dine-in, family meals, tourism, and mall-based casual dining.
- Independent full-service restaurants generated USD 1,245.4 million in 2023 and are forecast to reach USD 1,798.8 million in 2027, which keeps local operators important in this format.
- Chained full-service restaurants are forecast to rise from USD 819.9 million in 2023 to USD 1,129.7 million in 2027, showing room for more formalized casual dining concepts.
Cafés, bars, street stalls, and kiosks
- Cafés/bars recorded USD 1,586.1 million in 2023 and are forecast to reach USD 2,464.1 million by 2027, equal to an 11.6% CAGR.
- Chained cafés/bars generated USD 439.0 million in 2023, while independent cafés/bars generated USD 1,147.1 million, showing that local coffee shops and beverage outlets remain highly relevant.
- Street stalls/kiosks recorded USD 1,771.8 million in 2023 and are forecast to reach USD 2,607.9 million by 2027, which keeps affordable, high-frequency dining central to the market.
- Independent street stalls/kiosks generated USD 1,190.6 million in 2023, compared with USD 581.2 million for chained street stalls/kiosks, showing why this category remains more local than formal QSR.
| Foodservice type | Main demand driver | Market implication |
|---|---|---|
| Quick-service restaurants | Speed, value, delivery, brand familiarity | Strongest format for chain expansion and repeat meal demand. |
| Full-service restaurants | Family dining, casual occasions, malls, tourism | Important for social dining, celebrations, and tourist spending. |
| Cafés and bars | Coffee culture, beverages, workspace, social visits | Supports premium beverage-led growth in urban areas. |
| Street stalls and kiosks | Affordability, convenience, high frequency | Keeps independent and local foodservice deeply relevant. |
| Food courts and self-service | Mall traffic and format variety | Links dining demand to retail and entertainment locations. |
Restaurant type interpretation
Quick-service restaurants give the market scale, but not the full story. Full-service, cafés, bars, kiosks, and street stalls explain the Filipino habit of mixing branded meals with local, affordable, and occasion-based dining. The market grows because these formats solve different needs rather than replacing one another.
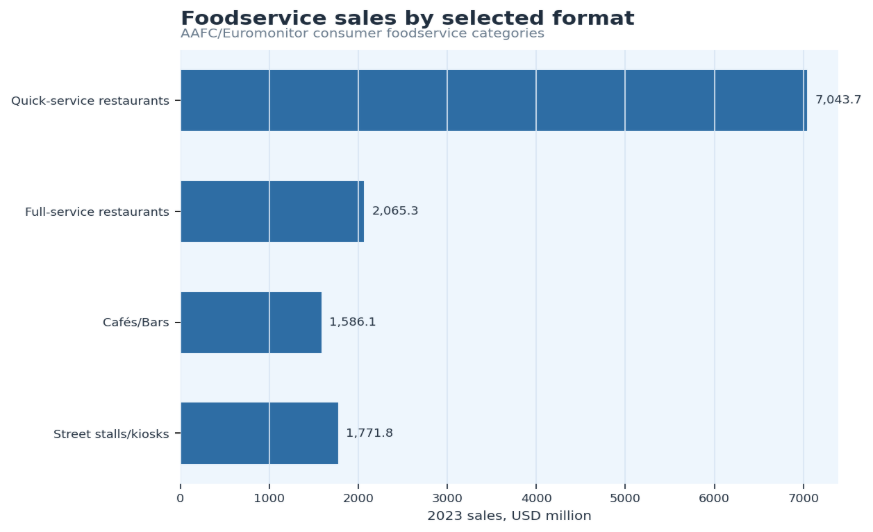
Figure 2. Selected format data shows why QSRs carry the largest sales base, while full-service restaurants, cafés/bars, and street stalls add value through different eating occasions.
Chained and Independent Foodservice Statistics
The Philippines foodservice market has a split structure. It has one of the strongest local chain champions in the region, but it also has a deep independent operator base. That makes the market attractive to franchise systems and large brands, while also keeping competition highly local and price-sensitive.
- Independent operators held 74.42% of outlets in 2025, showing that most foodservice locations are still local, small-format, or independently controlled.
- Chained concepts are forecast to grow at a 14.18% CAGR through 2031, which points to ongoing store rollout and brand formalization.
- Chained consumer foodservice recorded USD 8,697.9 million in 2023 and is forecast to reach USD 11,586.2 million in 2027.
- Independent consumer foodservice recorded USD 3,768.9 million in 2023 and is forecast to reach USD 5,457.5 million in 2027.
- Independent consumer foodservice is forecast to grow at a 9.7% CAGR for 2023–2027, faster than the 7.4% CAGR forecast for chained consumer foodservice in the AAFC/Euromonitor series.
- The strong independent growth forecast matters because many Filipino dining occasions still happen through neighborhood eateries, stalls, local cafés, and regional restaurants.
| Operator type | What to compare | Why it matters |
|---|---|---|
| Chained foodservice | Outlet growth, brand share, delivery integration | scalable expansion and the strength of franchise systems. |
| Independent restaurants | Outlet count, regional demand, price sensitivity | everyday local dining depth and neighborhood competition. |
| Franchise systems | Store openings, formats, regional rollout | how brands expand beyond NCR into provinces and malls. |
| Local eateries and stalls | Frequency, affordability, access | Explains why small operators remain important despite chain growth. |
Food Delivery and Digital Ordering Statistics
Delivery and digital ordering changed the Philippines foodservice market because they separated restaurant demand from the dining room. For operators, this adds sales reach but also creates new margin questions: commissions, packaging, discounts, rider coverage, kitchen capacity, and order accuracy now sit beside classic restaurant metrics such as foot traffic and table turns.
- Consumer foodservice online ordering rose from USD 829.5 million in 2019 to USD 1,937.5 million in 2023, posting a 23.6% CAGR over that period.
- Delivery online ordering increased from USD 827.3 million in 2019 to USD 1,893.5 million in 2023, posting a 23.0% CAGR.
- Online ordering is forecast to rise from USD 1,937.5 million in 2023 to USD 2,778.6 million in 2027, a 9.4% CAGR.
- Offline ordering still represented USD 10,570.5 million in 2023, meaning physical and non-app transactions remain the larger sales base.
- Offline ordering is forecast to reach USD 14,388.4 million by 2027, so digital growth does not remove the need for dine-in, takeaway counters, call-in ordering, and traditional service.
- Delivery is forecast at a 15.78% CAGR through 2031 in the Mordor data, which makes last-mile economics especially important for QSRs, cloud kitchens, and urban restaurants.
- Cloud kitchens are forecast to expand at a 24.85% CAGR through 2031, suggesting that kitchen-only formats may capture demand where delivery density is high.
The digital channel also changes the way restaurants think about menu design. Items that travel well, hold temperature, fit family bundles, and keep packaging costs controlled can perform differently from dishes designed mainly for dine-in service. That is why delivery statistics should be reviewed with kitchen capacity, preparation time, platform promotions, and repeat-order behavior rather than treated as a simple add-on sales channel.
| Channel decision | What to measure | Why it matters |
|---|---|---|
| Dine-in | Traffic, table turns, check size, mall footfall | Shows whether physical restaurant demand is recovering and profitable. |
| Delivery | Order volume, platform fees, repeat orders, packaging cost | Adds reach but can pressure margins. |
| Takeaway | Speed, queue management, packaging, meal bundles | Supports commuters, families, and value-driven occasions. |
| Drive-through | Throughput, peak-hour sales, convenience | Helps QSRs capture car-based demand where locations support it. |
| App ordering | Promotions, visibility, ratings, retention | Changes customer acquisition and repeat purchase behavior. |
Delivery interpretation
Delivery adds access, but it is not automatically better revenue. The useful question is whether delivery orders remain profitable after platform commissions, discounting, packaging, kitchen capacity, and refund risk. Restaurants that treat delivery as a separate channel can compare it against dine-in, takeaway, and drive-through instead of blending all sales into one number.
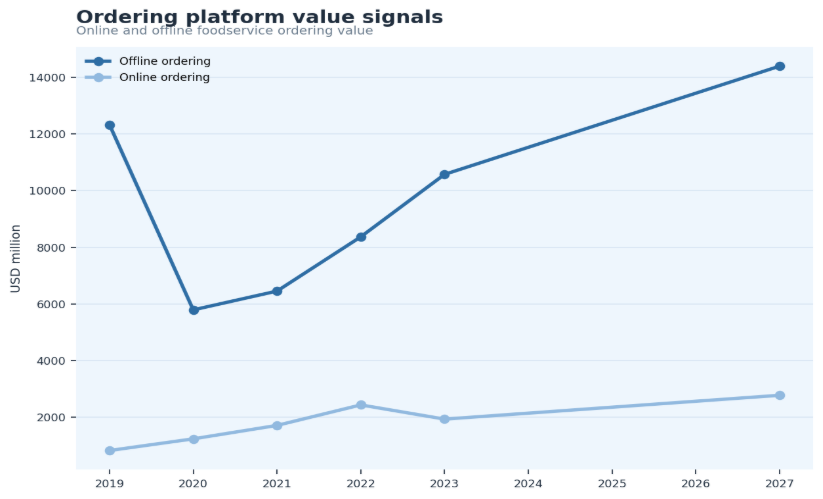
Figure 3. Ordering channel data matters because restaurants now compete across dine-in, takeaway, delivery, drive-through, and app-based transactions rather than one customer journey.
Standalone, Retail, Leisure, Lodging, and Travel Foodservice Statistics
Location type matters in the Philippines because dining demand is tied to malls, offices, transport routes, hotels, tourist zones, schools, and neighborhood foot traffic. A restaurant inside a mall has a different sales rhythm from a standalone QSR, a kiosk near a terminal, or a hotel restaurant in a tourist destination.
- Standalone stores captured 41.63% of spend in 2025, making independent streetside and standalone branded locations a key market base.
- Consumer foodservice through standalone locations recorded USD 5,452.4 million in 2023 after recovering from USD 2,831.7 million in 2020.
- Retail-linked foodservice recorded USD 5,012.1 million in 2023, reflecting the importance of malls, food courts, shopping centers, and retail-based dining.
- Travel foodservice recorded USD 991.9 million in 2023, which was still below 2019 but showed a meaningful recovery from the 2020 low.
- Lodging-based foodservice recorded USD 379.0 million in 2023, and the Mordor forecast expects lodging-based venues to grow at a 14.90% CAGR through 2031.
- Leisure-linked foodservice recorded USD 631.4 million in 2023, tying foodservice demand to recreation, entertainment, events, and family trips.
| Location type | Foodservice implication |
|---|---|
| Standalone outlets | Capture neighborhood, commuter, and independent dining demand. |
| Retail and mall locations | Link restaurant sales to shopping, entertainment, cinema, and food court traffic. |
| Leisure locations | Benefit from recreation, events, attractions, and family outings. |
| Lodging locations | Depend on tourism, business travel, hotel occupancy, and breakfast/dining outlets. |
| Travel locations | Benefit from airports, transport terminals, road corridors, and domestic mobility. |
Regional Philippines Foodservice Market Intelligence
Regional data is one of the highest-value parts of the market story. National averages can hide where establishments, employment, malls, tourists, offices, and delivery demand actually concentrate. The Philippines foodservice market has a strong Luzon base, but Visayas and Mindanao markets create important regional growth paths.
National Capital Region
- NCR led with 9,338 accommodation and food service establishments in 2022, equal to 30.3% of establishments tracked in the regional data.
- Metro Manila combines offices, malls, universities, tourism, transport hubs, premium cafés, QSR density, and high delivery app coverage.
- NCR is the most important market for early adoption of new formats because cloud kitchens, coffee chains, app-based delivery, and premium dining can reach dense demand pockets.
CALABARZON and Central Luzon
- CALABARZON ranked second with 4,604 establishments in 2022, equal to a 14.9% establishment share.
- CALABARZON accounted for 14.7% of national GDP in 2024 and contributed 0.8 percentage point to national GDP growth, supporting foodservice demand outside Metro Manila.
- Central Luzon followed with 3,286 establishments in 2022, equal to a 10.6% share, and benefits from road corridors, malls, logistics, Clark, and domestic travel.
- Pampanga and surrounding Central Luzon markets add a strong food culture, commuter movement, and regional dining base that can support both independent operators and chains.
Visayas and Mindanao markets
- Central Visayas is anchored by Cebu, where tourism, business activity, hotels, cafés, bars, and restaurants support a strong regional foodservice base.
- Western Visayas benefits from Iloilo, Bacolod, Boracay, and domestic tourism, which keeps leisure, standalone, café, and regional restaurant demand active.
- Davao Region gives national chains and independent operators a key Mindanao growth base, with Davao City supporting malls, cafés, QSRs, and local restaurants.
- Northern Mindanao, SOCCSKSARGEN, Zamboanga Peninsula, and BARMM remain more local and independent, but urban centers create long-term room for formal chain entry.
Regional expansion works best when the format fits the local demand base. A Metro Manila café model may not translate directly into a provincial commuter corridor, and a mall QSR may need different pricing from a tourist-zone casual dining outlet. The regional statistics therefore point to a practical strategy: match store format, menu, and channel mix to the economic role of each region.
| Region | Foodservice market implication |
|---|---|
| NCR | Largest urban foodservice base with dense chains, cafés, malls, offices, tourism, and delivery. |
| CALABARZON | Strong suburban and commuter demand supported by GDP scale and retail development. |
| Central Luzon | Growth from road corridors, malls, Clark, logistics, and regional food culture. |
| Central Visayas | Cebu and tourism flows support restaurants, cafés, bars, and lodging-based venues. |
| Western Visayas | Iloilo, Bacolod, and Boracay support regional dining and leisure demand. |
| Davao/Mindanao | Expanding urban foodservice base with QSR and independent operator growth. |
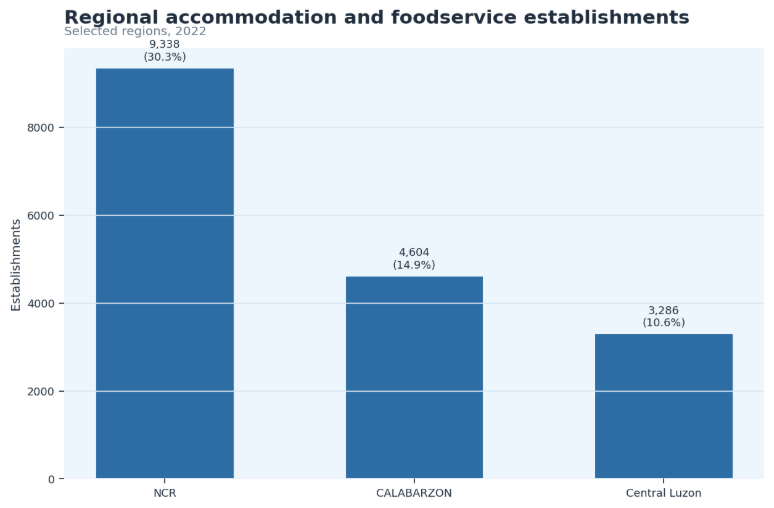
Figure 4. Regional foodservice demand should be measured by establishment concentration, employment, mall activity, delivery adoption, tourism exposure, and urban population density.
Philippines Foodservice in Southeast Asia Context
Country comparison helps position the Philippines within Southeast Asia. The Philippines is smaller than Indonesia in foodservice value, but its growth profile, local chain strength, delivery demand, and mall-centered dining culture make it a distinct market. Vietnam and Malaysia provide useful comparisons because all three markets combine urbanization, local cuisine, rising incomes, delivery adoption, and chain expansion.
This comparison also helps prevent a narrow view of the Philippines. Indonesia shows how population size can support scale, Thailand shows how tourism can lift restaurant demand, Vietnam shows how fast urban eating-out habits can change, Malaysia offers a mall-and-chain comparison, and Singapore shows what mature delivery and premium dining can look like at higher spending levels.
- Indonesia foodservice was estimated at USD 62.40 billion in 2025 and is forecast to reach USD 128.76 billion by 2031, making it a much larger regional market by value.
- Indonesia is forecast at a 12.84% CAGR for 2026–2031, which is strong but below the Philippines forecast CAGR of 14.27%.
- Vietnam foodservice was valued at USD 24.77 billion in 2025 and is forecast to reach USD 45.21 billion by 2031, supported by urban dining and café growth.
- Vietnam is forecast to grow at a 10.55% CAGR during 2026–2031, giving the Philippines a faster forecast growth rate in the market-size dataset.
- Malaysia foodservice was valued at USD 14.75 billion in 2025 and is forecast to reach USD 30.74 billion by 2031, with a 13.05% CAGR.
- The Philippines sits between Malaysia and Vietnam by 2025 market value, but its 2031 forecast of USD 40.98 billion narrows the gap with Vietnam.
| Country | Foodservice market signal | Why it matters for the Philippines |
|---|---|---|
| Indonesia | Largest comparator in the workbook at USD 62.40 billion in 2025 | Shows the regional opportunity ceiling created by population scale. |
| Vietnam | USD 24.77 billion in 2025 and USD 45.21 billion by 2031 | Useful comparison for urban foodservice and café growth. |
| Malaysia | USD 14.75 billion in 2025 and 13.05% CAGR to 2031 | Comparable for mall, chain, and urban dining structure. |
| Philippines | USD 18.41 billion in 2025 and 14.27% CAGR to 2031 | Combines local brand scale with fast forecast growth. |
Philippines Foodservice Company and Brand Statistics
Brand data matters because the Philippines is not a market where only international chains define foodservice modernization. Jollibee Foods Corp gives the country a strong local champion, while McDonald’s, Starbucks, Shakey’s, Max’s, convenience-store operators, and many local brands compete across price points and occasions.
- Jollibee Foods Corp recorded a 30.7% value share in 2023, up from 23.1% in 2019, strengthening its position after the pandemic period.
- Jollibee Foods Corp posted a 7.4% CAGR for 2019–2023 in company share value, reflecting stronger relative position in consumer foodservice.
- McDonald’s Corp recorded a 10.3% value share in 2023, compared with 8.1% in 2019, keeping it the strongest global QSR competitor in the dataset.
- McDonald’s Corp posted a 6.2% CAGR for 2019–2023, showing continued competitive strength even against the local leader.
- Seven & I Holdings recorded a 3.6% value share in 2023, reflecting the role of convenience retail and ready-to-eat foodservice formats.
- Starbucks Corp recorded a 2.3% value share in 2023, while cafés and bars overall are forecast to grow at an 11.6% CAGR for 2023–2027.
- Shakey’s Pizza Asia Ventures and Max’s Group remain important casual dining players because they serve family, group, and celebration occasions rather than only quick meals.
- Limited-service company share data shows why branded QSR is highly concentrated: Jollibee Foods Corp and McDonald’s Corp together account for a large share of formal limited-service value.
| Brand/operator group | Market role | Growth signal |
|---|---|---|
| Jollibee Foods Corporation | Largest local foodservice group | QSR scale, local taste, delivery, and multi-brand reach. |
| McDonald’s Philippines | Major international QSR competitor | Drive-through, delivery, promotions, and store expansion. |
| Starbucks and café chains | Premium beverage-led growth | Urban coffee culture and higher-value visits. |
| Max’s and Shakey’s | Casual dining and family occasions | Mall and group dining demand. |
| Convenience-store foodservice | Quick meals and snacks | Retail-linked frequency and impulse meals. |
Brand interpretation
The Philippines market is unusual because a local champion competes at scale with global chains. That makes local menu adaptation, family value bundles, delivery integration, franchise strategy, and regional rollout more important than simply importing global restaurant formats.
Tourism and Travel Foodservice Statistics
Tourism adds another layer to foodservice demand. Visitor arrivals and receipts support hotels, cafés, casual dining, airport foodservice, resort restaurants, local destinations, bars, and tourism-heavy districts. The effect is strongest in places such as Metro Manila, Cebu, Boracay, Bohol, Palawan, Clark, and major domestic travel corridors.
- International visitor arrivals reached 5,940,975 in 2025, giving travel and leisure foodservice a stronger customer base than in the earlier recovery period.
- Returning overseas Filipinos added 543,085 arrivals in 2025, increasing demand from travelers who may spend on restaurants, cafés, family dining, and celebrations.
- Total inbound arrivals reached 6,484,060 in 2025, combining international visitors and returning overseas Filipinos.
- Inbound visitor spending generated an estimated PHP 694 billion in 2025, supporting lodging, leisure, travel, and tourist-zone foodservice demand.
- Lodging-based venues are projected to grow at a 14.90% CAGR through 2031, making hotel foodservice, breakfast outlets, bars, and resort dining important forecast categories.
- Travel foodservice recorded USD 991.9 million in 2023, while lodging foodservice recorded USD 379.0 million, showing that tourism-linked channels had recovered but still had room for further expansion.
| Tourism signal | Foodservice implication |
|---|---|
| International arrivals | Support hotels, cafés, casual dining, airport foodservice, and tourist-zone restaurants. |
| Returning overseas Filipinos | Add family dining, celebrations, and shopping-linked restaurant demand. |
| Tourism receipts | Show spending power available to leisure, lodging, and travel foodservice. |
| Hotel and lodging activity | Supports breakfast, bars, banquet dining, and resort restaurants. |
| Domestic travel corridors | Support roadside, mall, transport, and destination foodservice. |
Consumer Behaviour and Menu Trends in Philippines Foodservice
The foodservice market is value-conscious, but it is not only price-driven. Consumers also respond to speed, familiar flavours, rice meals, chicken, burgers, noodles, pizza, milk tea, coffee, desserts, family bundles, delivery promotions, and the trust built by local and global brands. That mix explains why QSRs, independent eateries, cafés, and casual dining can all grow at the same time.
- Value meals remain important because the market includes many frequent, low- to mid-ticket purchases around work, school, commuting, and family routines.
- Family bundles and group meals fit Filipino dining habits because restaurants often serve shared occasions rather than single-person transactions only.
- Chicken, rice meals, burgers, noodles, pizza, desserts, and beverages continue to anchor branded and independent menus because they match familiar occasions and price points.
- Cafés/bars are forecast at an 11.6% CAGR for 2023–2027, showing how coffee, milk tea, beverages, snacks, and social visits add growth beyond meals alone.
- Delivery promotions can raise trial and repeat orders, but voucher dependency can weaken margins if restaurants do not track net order profitability.
- Cashless and app-based behavior supports delivery and loyalty programs, but offline ordering remains much larger by value, with USD 10,570.5 million in 2023.
- Health-conscious and premium menu items can grow in urban areas, but affordability and comfort food remain central because the market serves a broad income base.
Menu trend interpretation
Filipino foodservice demand is value-conscious but not one-dimensional. Consumers choose restaurants for convenience, familiarity, family sharing, delivery access, mall location, cravings, coffee occasions, and promotions. The strongest menus balance affordability with brand trust and repeatable flavor rather than chasing only premium positioning.
Philippines Foodservice Market Risks and Constraints
Growth does not remove pressure. Foodservice operators face inflation, rent, labor, platform fees, supply-chain costs, tourism volatility, and intense competition. These risks matter because restaurant sales can rise while margins weaken. For suppliers, the same pattern affects demand planning. Poultry, rice, sauces, beverage concentrates, packaging, kitchen equipment, and frozen products all move with restaurant traffic, but the strongest opportunities come when suppliers understand which formats are adding outlets and which channels are creating repeat orders.
- Food inflation can force menu-price increases, which can reduce frequency among value-conscious customers if wages and household budgets do not keep pace.
- Mall and high-street rent can pressure outlet economics, especially for casual dining, cafés, and locations dependent on peak-hour traffic.
- Labor cost and staff availability affect service consistency, kitchen speed, food safety, and customer experience.
- Platform fees and promotions can make delivery sales less profitable than dine-in if restaurants do not track net margin by channel.
- Tourism volatility affects lodging, leisure, travel, and destination foodservice because arrivals and receipts can shift with global travel, weather, and mobility conditions.
- Independent operators can be squeezed by ingredient costs, rent, and branded competition while still serving much of the everyday market.
- Cloud kitchens may grow quickly, but their success depends on order density, menu suitability, delivery radius, platform visibility, and repeat demand.
| Risk area | What to track | Why it matters |
|---|---|---|
| Food inflation | Ingredient and menu price changes | Affects margins and consumer frequency. |
| Rent and location cost | Mall, high street, terminal, and tourist-zone occupancy costs | Shapes outlet profitability. |
| Delivery economics | Platform commissions, discounts, packaging, refunds | Can reduce margin despite higher sales. |
| Labor cost | Staffing, training, productivity, service time | Affects service consistency and kitchen throughput. |
| Tourism volatility | Arrivals, hotel occupancy, receipts | Affects leisure, lodging, and travel foodservice. |
Philippines Foodservice Market Diagnostic
A practical foodservice review should connect each statistic to an operating question. The market is not only about how many restaurants exist or how fast sales grow. The more useful approach asks which formats are growing, which channels are profitable, which regions hold the outlet base, which brands are scaling, and which costs can weaken margins.
| Problem area | Core signals to measure | Useful benchmark |
|---|---|---|
| Market growth | Market value, CAGR, segment growth | USD 18.41 billion in 2025 and 14.27% CAGR to 2031. |
| Restaurant format | QSR, full-service, cafés/bars, kiosks | QSR held 57.28% of revenue in 2025. |
| Channel shift | Dine-in, takeaway, delivery, online ordering | Online ordering posted a 23.6% CAGR for 2019–2023. |
| Regional demand | NCR, CALABARZON, Central Luzon, Visayas, Mindanao | NCR held 30.3% of establishments in 2022. |
| Brand competition | Local chains, global chains, independents | Jollibee Foods Corp held 30.7% value share in 2023. |
| Tourism exposure | Arrivals, receipts, lodging and travel sales | Total inbound arrivals reached 6,484,060 in 2025. |
| Cost pressure | Inflation, rent, labor, platform fees | Margin risk can rise even when sales improve. |
90-Day Philippines Foodservice Market Review Plan
Statistics become useful when they are translated into a review cycle. Operators, suppliers, investors, and landlords can use a 90-day view to identify the best formats, locations, channels, and cost risks before committing to outlet rollout or category expansion.
| Timing | What to do | Output |
|---|---|---|
| Days 1-30 | Review market value, segment mix, regional establishments, and ordering channel data. | Baseline foodservice demand map. |
| Days 31-60 | Compare QSR, full-service, cafés, kiosks, delivery, and brand share. | Format and channel opportunity map. |
| Days 61-90 | Review tourism, food inflation, labor, rent, platform fees, and supply-chain exposure. | Practical market scorecard. |
Planning principle
The best foodservice analysis does not chase every restaurant statistic. It compares market value, format mix, ordering channel, regional demand, brand structure, tourism exposure, and cost pressure, then prioritizes the numbers that explain profitable outlet growth.
Metrics Philippines Foodservice Leaders Should Track
A useful scorecard should be specific enough to identify the source of growth or pressure. A blended sales number can hide whether a restaurant is winning through dine-in traffic, delivery discounts, menu price increases, tourism recovery, or regional expansion.
| Metric | Why it matters |
|---|---|
| Total foodservice market value | national category scale. |
| CAGR | growth pace and forecast momentum. |
| QSR sales and share | chain-led demand and value-meal strength. |
| Full-service sales | casual and family dining recovery. |
| Café/bar sales | beverage-led urban growth. |
| Delivery sales | digital channel demand and platform exposure. |
| Chained vs independent share | competitive structure and outlet fragmentation. |
| Regional establishment count | where outlet density is concentrated. |
| Tourism arrivals and receipts | travel-linked demand. |
| Food inflation and platform fees | margin pressure behind sales growth. |
Philippines Foodservice Market Statistics FAQ
Common questions
How big is the Philippines foodservice market?
The Philippines foodservice market was estimated at USD 18.41 billion in 2025, is expected to reach USD 21.04 billion in 2026, and is forecast to reach USD 40.98 billion by 2031.
What is the forecast CAGR for Philippines foodservice?
The market is forecast to grow at a 14.27% CAGR from 2026 to 2031, supported by QSR growth, delivery, lodging recovery, cloud kitchens, and broader dining demand.
Which foodservice format is strongest in the Philippines?
Quick-service restaurants are one of the strongest formats. They led with 57.28% of foodservice revenue in 2025 and benefit from value meals, delivery readiness, brand familiarity, and high-frequency visits.
How important are independent operators?
Independent operators are highly important because they held 74.42% of outlets in 2025. Local restaurants, stalls, kiosks, and cafés keep the market fragmented and deeply tied to neighborhood demand.
How important is food delivery in the Philippines?
Delivery is increasingly important, especially in urban markets. Delivery is forecast to grow at a 15.78% CAGR through 2031, while online ordering grew from USD 829.5 million in 2019 to USD 1,937.5 million in 2023.
Which regions matter most for foodservice?
NCR is the densest foodservice base, with 9,338 establishments and a 30.3% share in 2022. CALABARZON and Central Luzon follow with 4,604 and 3,286 establishments, respectively.
Why is Jollibee important?
Jollibee Foods Corp is important because it recorded a 30.7% value share in 2023, making it the leading local foodservice group and a major force in QSR, delivery, and multi-brand operations.
How does tourism affect foodservice?
Tourism supports hotels, travel venues, cafés, casual dining, destination restaurants, and airport foodservice. In 2025, total inbound arrivals reached 6,484,060 and tourism receipts reached PHP 694 billion.
What risks affect the market?
Key risks include food inflation, rent, labor costs, platform commissions, discount dependency, supply-chain pressure, tourism volatility, and competition between local chains, global brands, and independent operators.
What metrics should companies track?
Companies should track market value, CAGR, QSR sales, full-service sales, café/bar growth, delivery sales, chained versus independent share, regional establishments, tourism arrivals, food inflation, and platform fees.
Final Takeaway
Philippines foodservice demand is built on a mix of everyday affordability, branded quick-service restaurants, independent dining, mall culture, delivery apps, cafés, tourism, and local flavor preferences. The numbers show a market with strong forecast growth, but also a structure that remains highly local and regionally concentrated.
The market should be read by format, channel, location type, region, brand structure, and cost pressure rather than one national value. Quick-service restaurants explain much of the revenue scale, independent operators explain outlet depth, delivery explains channel change, tourism explains lodging and leisure demand, and NCR explains why urban density matters.
For operators, suppliers, investors, and retailers, the practical goal is to identify where sales growth is profitable. That means tracking QSR expansion, independent outlet strength, delivery economics, regional establishment concentration, tourism recovery, brand share, rent, labor, food inflation, and platform fees together. The strongest foodservice strategies will match format, menu, channel, and location to the eating occasions that Filipino consumers repeat most often.
The strongest operators will not treat delivery, tourism, and regional expansion as separate stories. In practice, the same brand may need a mall format in NCR, a drive-through format in CALABARZON, a tourist-zone format in Cebu or Boracay, and an app-first offer in dense urban districts. That makes disciplined market tracking more useful than broad national averages.