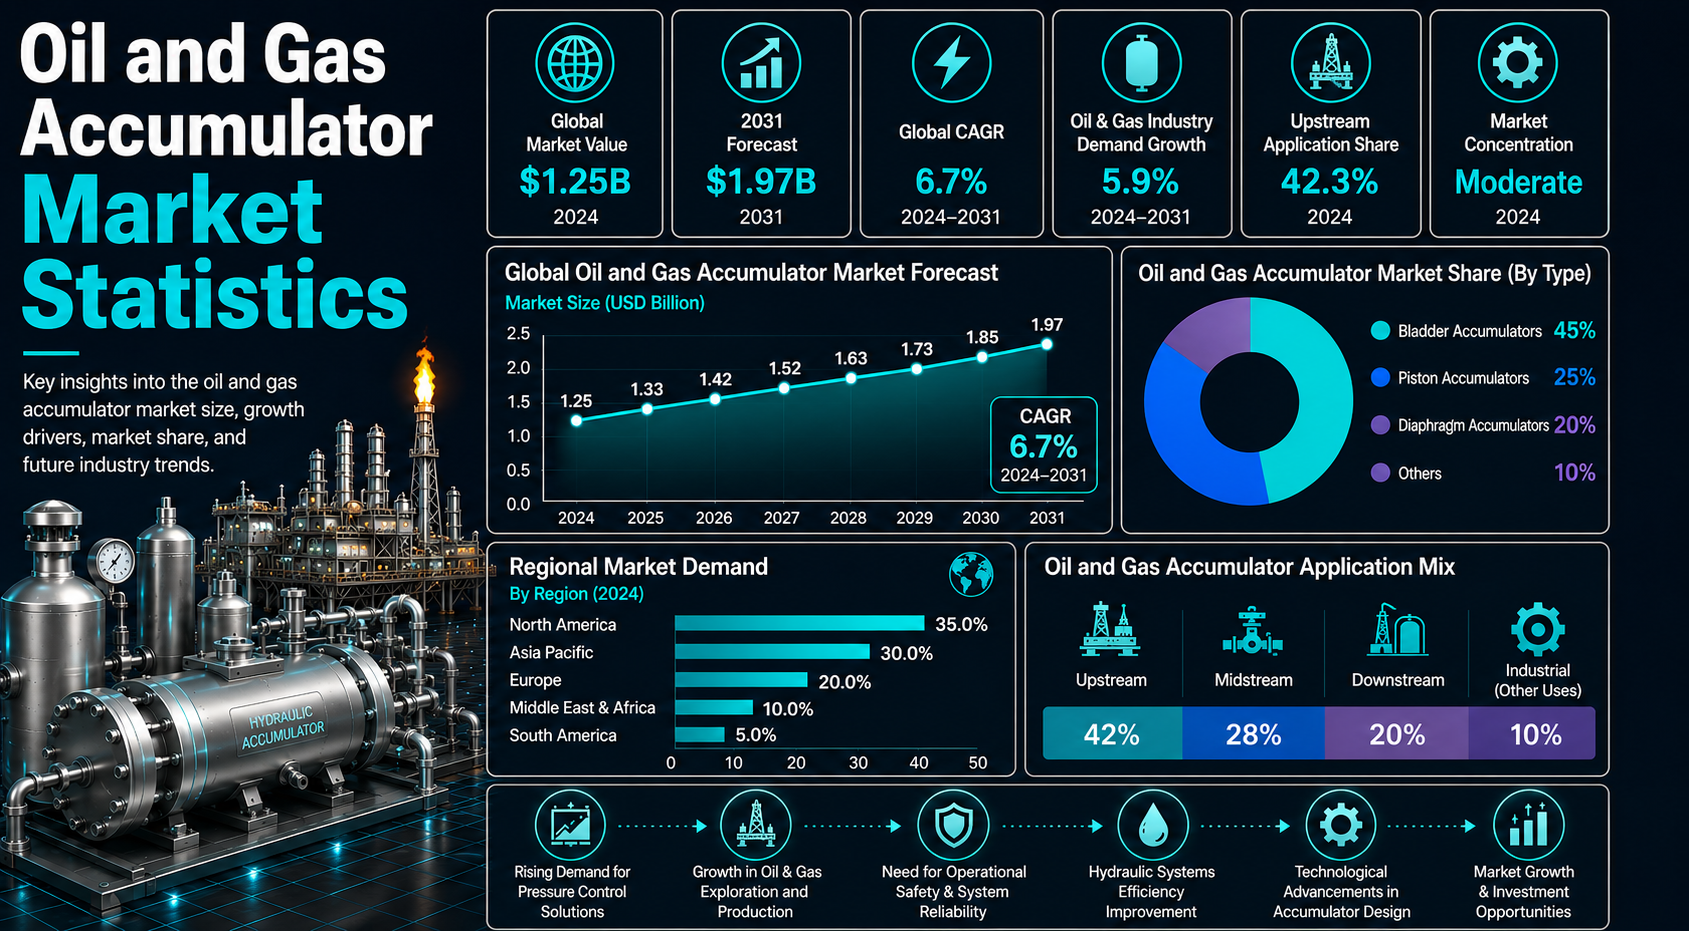
Oil and gas accumulators are small compared with rigs, subsea trees, blowout preventers, and production platforms, but they sit inside some of the most important hydraulic control systems in upstream operations. They store pressurized hydraulic energy so a system can respond quickly when pressure, safety, or control reliability matters. That makes the market closely tied to drilling, well control, offshore activity, subsea production, brownfield maintenance, and replacement cycles.
The numbers show a steady, safety-critical market rather than a high-volume commodity equipment story. Straits Research places the oil and gas accumulator market at USD 583.53 million in 2024, rising to USD 612.18 million in 2025 and USD 898.29 million by 2033. Other sources vary because they use different market boundaries, but most point to mid-single-digit growth supported by blowout preventer control, offshore reliability, high-pressure operations, and production-system maintenance.
The article is organized for scanning: short explanations introduce each issue, benchmark statistics show the market signal, and compact tables or readout boxes explain what the numbers mean for operators, suppliers, EPCs, service teams, and market analysts.
Executive Oil and Gas Accumulator Benchmarks
The numbers that define the accumulator market
• Straits Research values the oil and gas accumulator market at USD 583.53 million in 2024.
• The same forecast path reaches USD 612.18 million in 2025.
• Straits forecasts the market at USD 898.29 million by 2033.
• The Straits forecast path implies a 4.91% CAGR.
• Mordor Intelligence places the market at USD 629.47 million in 2025.
• Mordor forecasts USD 826.09 million by 2031.
• Fortune Business Insights forecasts oil and gas accumulators at USD 1.09 billion by 2034.
• Allied Market Research forecasts USD 814.4 million by 2030.
• TechSci Research uses a wider scope and projects USD 2.25 billion by 2031.
• BOP control is the most critical oilfield accumulator application.
• Bladder accumulators remain the leading type in many oilfield hydraulic systems.
• Westwood counted 360 backups and 137 floating rigs globally in June 2026.
• U.S. oil rigs stood at 442, while gas rigs stood at 114 in the referenced Baker Hughes/Reuters week.
• IEA expects global oil demand to reach around 105.5 mb/d by the end of the decade.
|
Editorial readout Oil and gas accumulators form a steady safety and reliability market. Demand does not come only from new drilling; it also comes from BOP maintenance, offshore reliability, subsea control systems, production assets, and replacement cycles. |
Why Oil and Gas Accumulators Matter in Energy Operations
The practical value of an accumulator is that it gives a hydraulic system stored energy at the moment the system needs it. In a routine industrial setting, that may smooth pulsation, support pressure stability, or protect equipment from shock. In oil and gas, the same function can become much more important because the operating environment may involve high pressure, flammable fluids, remote assets, and limited access.
BOP control is the clearest example. A well-control system cannot depend only on normal pump operation when fast response is required. Accumulator bottles provide the reserve hydraulic power needed to close or operate critical functions when the system is under stress. That makes maintenance quality, nitrogen pre-charge discipline, inspection records, and pressure integrity part of the market story.
Subsea and offshore systems add another layer. If a component fails onshore, service access may be difficult but manageable. If a control-system component fails offshore or subsea, intervention can require vessels, specialized crews, shutdown planning, and longer downtime. This raises the value of proven accumulator design, redundant capacity, remote monitoring, and reliable spares.
Production assets also create recurring demand. Wellhead systems, Christmas trees, valves, and process hydraulics often remain in service for long periods, and operators may replace accumulators during inspection windows, reliability campaigns, or control-system upgrades. This installed-base pattern supports a steadier demand floor than new projects alone.
Operating roles worth separating
• Accumulators store hydraulic energy for rapid response.
• BOP systems rely on accumulator bottles for emergency well-control functions.
• Subsea systems need hydraulic backup because access and intervention are difficult.
• Drilling rigs use accumulators in mud pumps, control units, and pressure-control systems.
• Production assets use accumulators in wellhead equipment, valves, and process systems.
• Offshore installations typically require higher redundancy and stricter reliability.
• Replacement cycles can support demand even when new drilling slows.
• High-pressure systems require more careful certification, inspection, and maintenance planning.
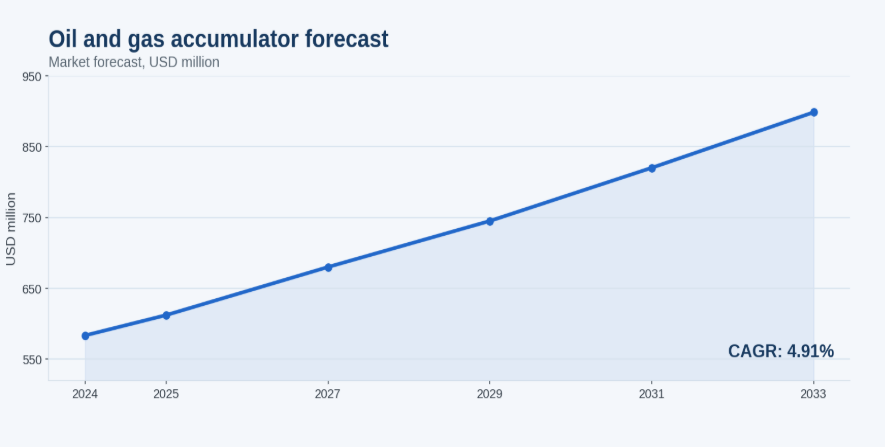
Figure 1. Accumulator growth should be read with drilling activity, BOP demand, offshore projects, and replacement cycles.
|
Market context readout The accumulator market is best understood as a reliability and safety market. A drilling slowdown can affect new equipment demand, but BOP maintenance, offshore safety, subsea control reliability, and brownfield replacement can keep demand active. |
Global Oil and Gas Accumulator Market Size and Forecast
Market-size and forecast benchmarks
Market-size comparisons are useful only when the market boundary is clear. Straits, Mordor, Allied, Fortune, TechSci, and broader datasets do not always count the same product scope, customer base, or use case.
The clearest view pairs one forecast graph with a compact source-comparison table. The graph shows direction, while the table explains why reported values differ by scope rather than forcing every forecast into one number.
Forecast benchmarks
• Straits Research reports USD 583.53 million in 2024.
• Straits Research reports USD 612.18 million in 2025.
• Straits Research forecasts USD 898.29 million by 2033.
• Mordor Intelligence reports USD 629.47 million in 2025.
• Mordor forecasts USD 826.09 million by 2031.
• Allied Market Research forecasts USD 814.4 million by 2030.
• Fortune Business Insights forecasts USD 1.09 billion by 2034.
• TechSci Research projects USD 2.25 billion by 2031 under a broader scope.
• Market Research Future projects a broader oil accumulator market at USD 2.99 billion by 2035.
| Source | Base Year | Base Value | Forecast Year | Forecast Value | CAGR |
|---|---|---|---|---|---|
| Straits Research | 2024 | USD 583.53M | 2033 | USD 898.29M | 4.91% |
| Mordor Intelligence | 2025 | USD 629.47M | 2031 | USD 826.09M | 4.62% |
| Allied Market Research | 2020 | Derived baseline | 2030 | USD 814.4M | 5.3% |
| Fortune Business Insights | 2026 | USD 703.54M | 2034 | USD 1.09B | 5.72% |
| TechSci Research | 2025 | USD 1.69B | 2031 | USD 2.25B | 4.89% |
|
Forecast readout Forecast values vary because definitions vary. The consistent signal is steady growth, not explosive expansion, with safety-critical systems and replacement demand supporting the market. |
Accumulator Type Statistics
Bladder, piston, and diaphragm benchmarks
Bladder, piston, and diaphragm accumulators can appear simple in a market table, but buyers usually select them through operating requirements. The decision starts with pressure, volume, flow response, system duty, fluid compatibility, available footprint, and maintenance access. A unit used in a BOP control package carries a different risk profile from a smaller unit used to smooth pressure in an auxiliary hydraulic circuit.
Bladder accumulators often gain share because they are responsive, familiar to field teams, and practical across many hydraulic-storage applications. Their market role is strongest where fast response and service familiarity matter. Piston units become more attractive when larger fluid volume, higher pressure, or specific operating cycles are required. Diaphragm units are more useful where compact size and smaller hydraulic volumes fit the application.
Type statistics matter because each accumulator design supports a different pressure, volume, response, and maintenance profile.
Bladder units are common because they are responsive and familiar to field teams. Piston units fit larger-volume or high-pressure duties, while diaphragm units serve compact systems.
Type benchmarks
• Bladder accumulators are the largest type segment in many oilfield reports.
• Bladder units are widely used because they offer fast response and practical hydraulic storage.
• Piston accumulators remain important in high-pressure and larger-volume applications.
• Diaphragm accumulators are useful in compact and lower-volume systems.
• Bladder accumulator revenue is modeled at roughly 42% of the 2025 market.
• Piston accumulator revenue is modeled at roughly 29% of the 2025 market.
• Diaphragm accumulator revenue is modeled at roughly 16% of the 2025 market.
• Other accumulator types are modeled at roughly 13% of the 2025 market.
| Type | Market Role | Why it matters |
|---|---|---|
| Bladder accumulator | Largest common oilfield type | Fast response storage |
| Piston accumulator | High-pressure and high-volume role | Larger fluid volumes |
| Diaphragm accumulator | Compact hydraulic systems | Compact response needs |
| Other types | Specialized use cases | Niche/severe service |
|
Type readout Accumulator type selection is not only a price decision. Oilfield buyers compare pressure, volume, response speed, maintenance access, fluid compatibility, certification, and system redundancy. |
Application Statistics: BOP, Drilling, Subsea, and Production Controls
Where accumulator demand appears in oilfield systems
Application statistics are the best way to separate high-value demand from high-volume demand. BOP control can represent a smaller number of highly critical systems, while general hydraulic support can represent a wider set of lower-spec uses. Subsea control and offshore applications may not always produce the highest unit count, but they can carry greater specification burden because reliability, access, testing, and redundancy are more important.
BOP-related demand is also linked to compliance and operational readiness. Operators and drilling contractors cannot treat BOP control capacity as a discretionary feature. Accumulators must be ready to deliver stored hydraulic energy when needed, and the system must pass inspection and testing standards. This creates demand for replacement bottles, bladder kits, charging equipment, valves, gauges, documentation, and approved service work.
Drilling hydraulics and mud pump support create a different demand profile. These systems are tied more closely to rig utilization, drilling intensity, and field activity. When activity rises, short-cycle orders can improve. When drilling slows, the strongest demand usually shifts toward maintenance, rebuilds, and replacement components on the active fleet.
Production and wellhead applications create longer-life demand. These systems may not receive as much attention as BOP control, but they support field uptime and valve operation across producing assets. In mature basins, replacement and reliability programs can keep this demand active even when new drilling is muted.
BOP control remains the clearest signal because the application is not optional; it sits inside well-control planning and emergency response.
Application benchmarks
• Blowout preventer control is the most important safety-critical application.
• BOP applications were cited as the largest revenue generator in Allied market analysis.
• BOP control is modeled at roughly 38% of the 2025 market.
• Mud pumps and drilling hydraulics are modeled at roughly 18%.
• Subsea production control is modeled at roughly 16%.
• Wellhead and Christmas tree systems are modeled at roughly 12%.
• Pipeline and process hydraulics are modeled at roughly 9%.
• Other oilfield uses are modeled at roughly 7%.
• Offshore and deepwater BOP systems often require higher redundancy.
• Subsea controls increase accumulator importance because response and access are more complex.
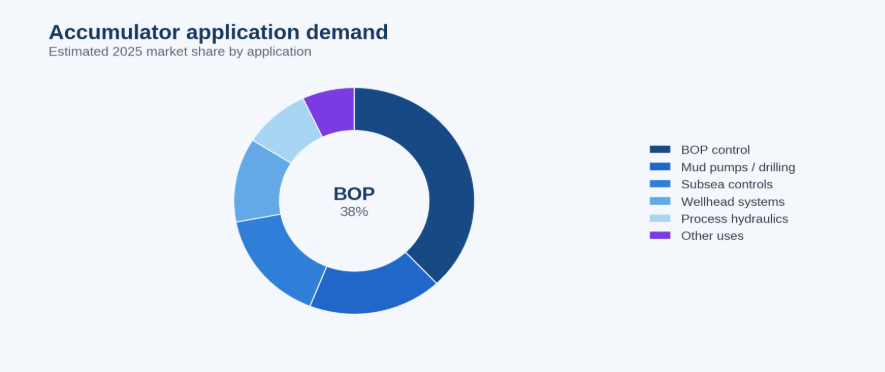
Figure 2. BOP control remains the clearest safety-critical application signal for accumulator demand.
| Application | Market Meaning | Demand Signal |
|---|---|---|
| BOP control | Safety-critical well control | Drilling/regulation link |
| Mud pumps/drilling hydraulics | Rig equipment support | Tracks drilling intensity |
| Subsea controls | Offshore production reliability | Higher spec needs |
| Wellhead systems | Production and safety control | Replacement demand |
| Process hydraulics | Midstream and production equipment | Pressure control |
|
Application readout BOP systems make accumulator demand more resilient than a basic drilling-equipment market. Well-control equipment must meet safety, pressure, and redundancy expectations even when activity changes. |
Pressure Class and High-Spec Equipment Statistics
Pressure and specification benchmarks
Pressure class is one of the clearest ways to understand why accumulator revenue can rise faster than simple unit demand. A low-pressure support accumulator and an ultra-high-pressure unit may both perform the basic function of storing hydraulic energy, but the engineering, testing, materials, inspection burden, and failure consequences are not the same.
Medium-pressure units often support a broad installed base, which makes them important for volume and replacement planning. High-pressure units are more closely tied to drilling control, pressure-control systems, and severe-service equipment. Ultra-high-pressure units sit in the most demanding part of the market, where certification, documentation, and system design can raise order value.
Pressure class also affects service strategy. Higher-pressure systems usually need stricter inspection discipline, better maintenance records, controlled pre-charge practices, and more careful spare-part planning. A supplier with approved documentation and field support may have an advantage over a supplier with only standard inventory.
For analysts, the key is to connect pressure class to application. High-pressure and ultra-high-pressure shares matter most when they overlap with BOP control, subsea systems, offshore wells, high-pressure reservoirs, and severe-service production equipment. That overlap is where the market becomes more specification-led.
High-pressure BOP, deepwater, and severe-service systems are judged by response reliability, certification, and failure consequence, not only by purchase price.
Pressure benchmarks
• Low-pressure accumulators are modeled at 18% of market demand.
• Medium-pressure units are modeled at 34% of market demand.
• High-pressure units are modeled at 31% of market demand.
• Ultra-high-pressure units are modeled at 17% of market demand.
• Higher-pressure applications often require stronger certification and maintenance discipline.
• Offshore and subsea systems increase pressure-class complexity.
• BOP applications often require rapid-response hydraulic energy availability.
• Replacement demand can be strongest where high-pressure systems face inspection and certification cycles.
| Pressure Class | Market Role | Why it matters |
|---|---|---|
| Low pressure | Support and auxiliary systems | Lower technical burden |
| Medium pressure | Common hydraulic systems | Broad installed base |
| High pressure | Drilling and control systems | Strong reliability requirements |
| Ultra-high pressure | Severe-service applications | Higher certification needs |
|
Pressure readout Pressure class changes the buyer’s risk profile. High-pressure accumulators are evaluated by reliability, response, certification, maintenance history, and failure consequences, not only by unit price. |
Onshore vs Offshore Accumulator Demand
Onshore and offshore demand benchmarks
Onshore and offshore demand should be compared by buying cycle, not only by share. Onshore drilling can move quickly when commodity prices, operator budgets, and rig schedules change. This makes onshore accumulator demand more sensitive to near-term activity, especially for BOP control, rig hydraulics, and replacement parts tied to active drilling programs.
Offshore demand usually develops more slowly, but it can be more valuable per system. Offshore rigs, platforms, FPSOs, and subsea projects often require more documentation, more redundancy, tighter qualification, and stronger support planning. A project delay can shift orders, but once equipment is installed, maintenance and replacement needs can continue for years.
The offshore story is also a service story. Service visits, spare-part logistics, and downtime exposure can be expensive, so operators may prefer proven designs and approved suppliers. In deepwater and subsea settings, access constraints increase the value of reliability and may support premium pricing for properly specified systems.
The useful market conclusion is balanced. Onshore demand often creates volume and faster order signals. Offshore demand often creates higher-specification equipment and stronger lifecycle service value. A supplier strategy should track both rather than treating one as automatically superior.
Deployment benchmarks
• Onshore drilling and production are modeled at 56% of market demand.
• Offshore drilling and production are modeled at 44% of market demand.
• Westwood counted 360 jackup rigs globally on 1 June 2026.
• Westwood counted 137 floating rigs globally on the same date.
• Total offshore rig count in that snapshot was 497 rigs.
• Offshore systems typically require more redundancy and higher specification.
• Subsea control systems increase accumulator demand per project.
• Onshore shale activity can support recurring demand through short-cycle drilling.
| Deployment Area | Demand Role | Implication |
|---|---|---|
| Onshore drilling | Volume and short-cycle activity | BOP and rig hydraulic demand |
| Onshore production | Installed-base maintenance | Replacement and valve-control demand |
| Jackup rigs | Shelf offshore drilling | Higher service value |
| Floating rigs | Deepwater drilling | High-spec BOP demand |
| Subsea production | Long-life offshore assets | Redundancy and access |
|
Deployment readout Onshore activity drives volume, but offshore activity can drive higher-value accumulator demand. Deepwater, subsea, and high-pressure environments often require more redundancy and stricter reliability. |
Regional Oil and Gas Accumulator Market Statistics
Regional demand signals worth separating
North America is the most activity-sensitive region because U.S. shale and Canadian field activity can change quickly with operator budgets. It also has a large installed base of rigs, production assets, service companies, and pressure-control equipment. That mix supports both short-cycle orders and recurring replacement work.
Asia-Pacific is more mixed. China and India contribute production, refining, gas, and broader hydraulic demand, while Australia, Malaysia, and Indonesia add offshore and gas-linked applications. This makes the region less dependent on one single demand signal. Analysts should compare upstream activity, offshore projects, gas infrastructure, and local hydraulic supplier capacity.
Europe is more mature and replacement-oriented, especially around North Sea activity. Norway and the United Kingdom may not behave like fast-growth drilling regions, but offshore reliability, inspection cycles, brownfield work, and certification-heavy maintenance can keep accumulator demand relevant. In this type of market, service density can matter as much as new project count.
The Middle East and Africa are shaped by large producing countries, national oil companies, offshore gas projects, and long-life fields. Demand can be tied to production scale, well-control requirements, and modernization programs. Latin America is more selective, with Brazil and Guyana standing out because deepwater and FPSO activity can increase high-spec accumulator demand.
North America
• North America is modeled at 29% of the 2025 market.
• The region’s 2025 estimate is about USD 177.53 million.
• U.S. oil rigs stood at 442 in the referenced Baker Hughes/Reuters week.
• U.S. gas rigs stood at 114 in the same week.
• NOV reported 613 U.S. active rigs in its 2025 census.
• NOV reported 1,059 available U.S. rigs.
• U.S. rig utilization was reported at 58%.
• Shale drilling, BOP replacement, and production maintenance shape regional demand.
Asia-Pacific
• Asia-Pacific is modeled at 24% of the 2025 market.
• The region’s 2025 estimate is about USD 146.92 million.
• China, India, Indonesia, Malaysia, and Australia are key demand countries.
• Australia and Malaysia have strong offshore exposure.
• China and India add production, refining, and industrial demand context.
• APAC demand also benefits from broader hydraulic accumulator growth.
Europe, Middle East and Africa, and Latin America
• Europe is modeled at 16% of the 2025 market.
• Europe’s 2025 estimate is about USD 97.95 million.
• Middle East and Africa is modeled at 22% of the 2025 market.
• Middle East and Africa’s 2025 estimate is about USD 134.68 million.
• Latin America is modeled at 9% of the 2025 market.
• Latin America’s 2025 estimate is about USD 55.10 million.
• Brazil and Guyana support offshore and deepwater demand.
• Norway and the United Kingdom support North Sea replacement demand.
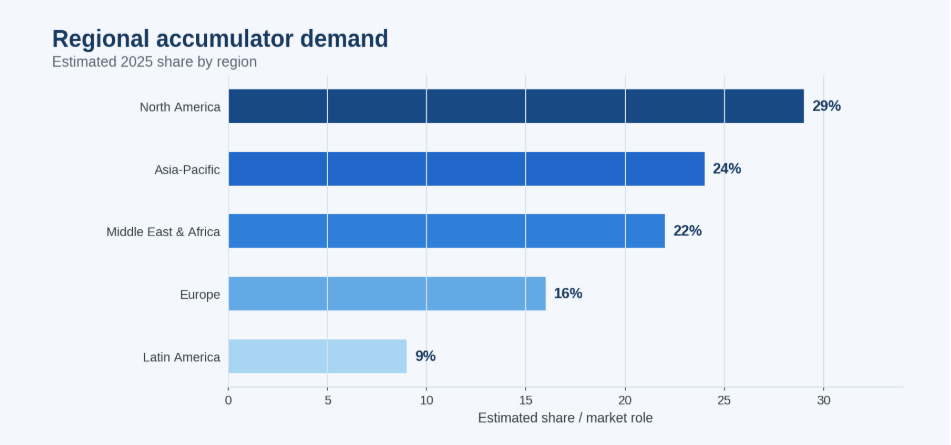
Figure 3. Regional demand differs by rig activity, production scale, offshore exposure, and replacement cycles.
| Region | Market Role | Main signal |
|---|---|---|
| North America | Shale, rig activity, replacement | BOP control and drilling hydraulics |
| Asia-Pacific | Production growth and offshore activity | China, India, Australia, Indonesia, Malaysia |
| Europe | Mature offshore and replacement | North Sea maintenance and high-spec systems |
| Middle East & Africa | Production scale and long-life fields | Large producers and offshore gas projects |
| Latin America | Deepwater and selective onshore growth | Brazil, Guyana, Mexico, Argentina |
|
Regional readout North America is activity-sensitive, Europe is replacement-heavy, the Middle East is production-scale driven, Asia-Pacific is mixed, and Latin America is shaped by Brazil/Guyana deepwater and Argentina shale potential. |
Country-Level Oil and Gas Accumulator Market Statistics
Country-level demand signals
Country-level analysis should not rank markets by production alone. A large producer with limited new drilling, limited offshore activity, or weak replacement spending may be less attractive than a smaller country with high-spec offshore projects and strong service requirements. The strongest opportunity appears when production scale, rig activity, BOP demand, offshore exposure, and replacement cycles overlap.
The United States scores strongly because rig activity, shale operations, production scale, BOP replacement, and service infrastructure overlap. Brazil scores strongly for a different reason: deepwater and FPSO activity create higher-spec systems where reliability and certification matter. Norway is important because mature offshore assets keep maintenance, replacement, and approved service demand active.
Qatar, Saudi Arabia, and the UAE are important because gas, oil production, and national infrastructure programs create long-cycle demand. Guyana is smaller but strategically important because rapid offshore growth can create concentrated demand through FPSO-led development. Australia combines offshore gas exposure with production-control needs.
A practical country score should therefore include oil production, gas production, rig count, offshore rig presence, FPSO/subsea exposure, BOP fleet activity, local service coverage, and regulatory expectations. That score is more useful than a simple ranking of GDP or production barrels.
Country-level benchmarks
• The United States carries the strongest modeled opportunity score because oil, gas, rig activity, and BOP demand overlap.
• Brazil is important because offshore and deepwater activity increases high-spec accumulator demand.
• Norway remains important because North Sea assets require replacement, certification, and reliability support.
• Qatar is a gas-driven market with strong production and LNG infrastructure links.
• Saudi Arabia supports demand through large-scale oil production and long-life fields.
• Australia has strong offshore gas exposure and production-control demand.
• The UAE combines offshore and onshore production with modernization needs.
• China combines production scale with a broad hydraulic equipment base.
• Guyana is an emerging high-spec market because offshore production is expanding quickly.
• Nigeria, Egypt, Algeria, Indonesia, Malaysia, Mexico, and Argentina add regional depth.
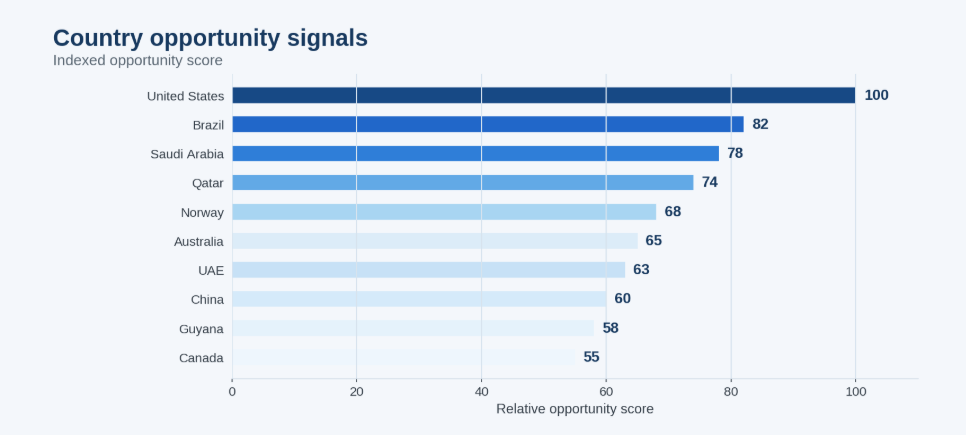
Figure 4. Country opportunity rises where production scale, offshore exposure, and BOP needs overlap.
| Country | Main signal | Market Meaning |
|---|---|---|
| United States | Rig activity and shale drilling | Strong BOP and drilling hydraulic demand |
| Canada | Oil sands and gas production | Production and maintenance demand |
| Brazil | Offshore deepwater activity | Higher-spec subsea and BOP demand |
| Guyana | Fast-growing offshore basin | Emerging high-spec demand |
| Saudi Arabia | Large oil production | Long-life production and control systems |
| UAE | Offshore and onshore production | Modernization |
| Qatar | Gas and LNG activity | Gas-processing and offshore demand |
| Norway | North Sea offshore systems | Replacement reliability |
| China | Large production and industrial base | Broad hydraulic equipment demand |
| Australia | Offshore gas projects | Subsea controls |
|
Country-level readout Country analysis should not rely on production alone. Accumulator demand is stronger when production scale overlaps with drilling activity, offshore exposure, high-pressure systems, BOP control, and replacement cycles. |
Market Drivers Behind Oil and Gas Accumulator Demand
Demand drivers worth separating
Accumulator demand starts with activity, but it does not end there. Rig count signals near-term drilling demand, while the installed fleet continues to create maintenance, testing, and replacement work even when new drilling slows.
Production scale also matters because producing fields rely on hydraulic controls, valves, safety systems, and replacement parts. Mature assets can be especially active when pressure management, water handling, and downtime reduction become more important.
Safety rules give the market a non-discretionary core. BOP control systems, pressure-control packages, and offshore systems must remain tested, documented, and ready, which helps stabilize demand during weaker capex periods.
Service readiness completes the demand picture. Buyers need nitrogen charging, inspection support, compatible spares, pressure documentation, and local response as much as they need the accumulator itself.
Driver benchmarks
• Rig activity remains a leading signal for drilling-related accumulator demand.
• Baker Hughes treats rig count as a business barometer for drilling and supplier activity.
• Offshore rigs matter because deepwater and subsea wells often need higher specification systems.
• IEA expects oil demand to rise by 2.5 mb/d between 2024 and 2030.
• Oil demand is expected to reach about 105.5 mb/d by the end of the decade.
• Global oil supply is expected to rise by 3.0 mb/d in 2025 and 2.4 mb/d in 2026.
• EIA expects global oil demand to rebound to 105.6 million b/d in 2027.
• Brownfield maintenance supports demand even when new drilling slows.
• Safety and well-control rules make BOP accumulator systems less discretionary.
| Driver | Why it matters | Demand Impact |
|---|---|---|
| Rig activity | Supports drilling-equipment demand | BOP/control demand |
| Offshore projects | Higher specification and redundancy | Higher-value demand |
| Oil and gas production | Keeps production systems active | Maintenance/replacement |
| Safety regulation | Requires reliable well-control systems | Required demand |
| Brownfield upgrades | Aging installed base needs maintenance | Replacement and service demand |
|
Driver readout Rig counts explain near-term drilling demand, while offshore safety, production reliability, and replacement cycles explain why the market does not disappear during slower drilling periods. |
Competitive Landscape and Supplier Statistics
Competitive factors worth separating
Supplier competition is shaped by trust more than catalog size. Buyers in safety-critical oilfield systems want equipment that is proven, documentable, pressure-rated, compatible with the hydraulic system, and supportable in the field. A lower-cost unit may be unattractive if it lacks certification, spares, inspection support, or maintenance history.
Approved-vendor status is especially valuable in the industry. Operators, EPC firms, drilling contractors, and service providers often favor suppliers that have already been qualified for their specific systems and requirements. Once a supplier is approved for BOP, subsea, or high-pressure control applications, it can continue to benefit from replacement, maintenance, and service opportunities because compatibility, technical records, and documentation become established parts of the operating standard. Maintaining clear financial records, including an itemized bill, can further support transparency throughout these ongoing supplier relationships.
Service network strength is another differentiator. Offshore, remote, and high-pressure operations can require quick access to spare bladders, seals, valves, gauges, charging kits, and technical support. Distributors with strong local coverage can win replacement demand even when original equipment manufacturers control high-spec project awards.
For content and market planning, the competitive section should therefore connect brands with capability categories: pressure rating, certification, system integration, elastomer performance, field service, replacement availability, and severe-service experience.
Supplier themes
• Parker Hannifin is relevant to hydraulic accumulator and motion-control markets.
• Eaton is relevant to hydraulic systems and industrial fluid power.
• Bosch Rexroth is relevant to hydraulic engineering and controls.
• HYDAC is relevant to accumulator technology and hydraulic accessories.
• Freudenberg and NOK are relevant to sealing and elastomer performance.
• Roth Hydraulics, Nippon Accumulator, Technetics Group, and Tobul Accumulator support the broader supplier landscape.
• Oilfield buyers compare certification, service availability, pressure class, and reliability history.
• Remote offshore operations increase the value of spares, service networks, and proven designs.
| Competitive Factor | Why it matters |
|---|---|
| Pressure rating | Determines fit for drilling and high-pressure systems |
| Certification | Supports acceptance |
| Service network | Remote support |
| Custom engineering | Needed for subsea, BOP, and severe-service applications |
| Replacement availability | Reduces downtime |
| Reliability record | Safety-critical |
|
Competitive readout Vendors compete less on generic capacity and more on pressure rating, certification, reliability, service response, replacement availability, and support for safety-critical systems. |
Risks and Bottlenecks
Risk signals worth separating
The main risk is cyclicality, but it should be divided into short-cycle and long-cycle exposure. Short-cycle exposure comes from rig activity, shale budgets, drilling contractor utilization, and quick replacement orders. Long-cycle exposure comes from offshore FIDs, subsea projects, FPSO timing, gas developments, and national oil company programs.
A second risk is replacement deferral. During downturns, some buyers may extend maintenance intervals or delay non-urgent replacements. That can reduce near-term orders, but it can also increase reliability risk. Safety-critical systems are less likely to be deferred indefinitely because inspection, testing, and compliance requirements create a practical limit.
Supply-chain bottlenecks can also affect the market. Pressure vessels, elastomers, valves, gauges, specialty materials, and certification paperwork can all influence lead time. In offshore and remote basins, the issue is not only whether a part exists but whether it can be delivered, installed, and documented inside the maintenance window.
Energy transition pressure is a longer-term risk, but it does not remove near-term accumulator demand. Existing oil and gas assets still need safe operation, and many gas, LNG, offshore, and brownfield systems will remain in service for years. The more immediate question is which projects proceed, which assets are maintained, and where service revenue remains accessible.
The most useful risk framework separates newbuild demand from replacement demand. Newbuild demand follows projects; replacement demand follows installed-base condition, inspections, reliability programs, and regulation.
Safety-critical demand is less discretionary. BOP systems must remain certified, production systems must maintain uptime, and offshore assets must manage reliability risk.
Risk analysis should acknowledge cyclicality. Oil prices, operator budgets, rig activity, and project delays can all change order timing.
The market is cyclical, but well-control systems, offshore maintenance, production controls, and replacement needs can stabilize demand.
Risk benchmarks
• Oil price volatility can delay drilling and offshore investment.
• Rig count declines can reduce short-cycle demand.
• Offshore project delays can shift high-spec accumulator purchases.
• Subsea systems require longer qualification cycles.
• Buyers may extend replacement cycles during downturns.
• Supply-chain delays can affect pressure vessel and sealing components.
• Certification and inspection requirements can lengthen procurement.
• Electrification can change long-term hydraulic demand in selected systems.
• Energy transition pressure can affect upstream capex.
• Safety-critical systems remain more resilient than discretionary equipment.
| Risk | What It Affects | Market Response |
|---|---|---|
| Oil price volatility | New drilling orders | Replacement/service focus |
| Rig count decline | Short-cycle equipment demand | Installed-base focus |
| Offshore delays | High-spec accumulator orders | Track FIDs/projects |
| Certification complexity | Procurement timing | Approved vendors |
| Supply-chain constraints | Delivery and replacement | Inventory/service planning |
|
Risk interpretation The market is cyclical, but BOP reliability, offshore maintenance, production control, and replacement demand help stabilize the category compared with purely expansion-driven oilfield equipment. |
Oil and Gas Accumulator Opportunity Diagnostic
Opportunity signals worth separating
The diagnostic table should be used as a commercial filter. A high-opportunity market should show measurable activity, reachable buyers, installed equipment, safety-critical applications, and local service needs. Without those signals, a headline market size can look attractive while the real sales opportunity remains difficult to access.
For BOP control, the strongest signals are rig activity, BOP fleet age, inspection cycles, drilling contractor spending, and regulatory expectations. For offshore and subsea demand, the strongest signals are jackup and floater deployment, FPSO awards, subsea tiebacks, and project maintenance schedules. For brownfield replacement, the strongest signals are asset age, downtime risk, service intervals, and historical failure patterns.
The diagnostic also helps separate equipment demand from service demand. Equipment demand follows new systems and replacement units. Service demand follows testing, pre-charge checks, bladder replacement, recertification, repair, and spare-part planning. The strongest suppliers usually build both sides of the opportunity.
his approach is closer to how operators buy. They need accumulators because a rig, BOP stack, subsea package, wellhead system, or process unit requires reliable hydraulic energy storage.
A high-opportunity market should combine measurable activity, reachable customers, serviceable installed systems, and a certification environment where qualified suppliers can compete.
Opportunity analysis should focus on overlap: production scale, active drilling, offshore complexity, high-pressure systems, and BOP reliability needs.
| Opportunity Area | Signals to measure | Why it matters |
|---|---|---|
| BOP control | Rig activity, BOP stack demand, regulation | Strongest safety-critical use case |
| Offshore/subsea | Jackup and floating rig count, FID, project pipeline | Higher-spec accumulator demand |
| Brownfield replacement | Installed base, inspection cycles, downtime risk | Supports recurring demand |
| High-pressure systems | Reservoir pressure, drilling complexity | Higher certification and reliability needs |
| Regional activity | Country production, rig count, offshore exposure | Shows where demand is concentrated |
| Vendor service network | Response time, spares, certifications | Reduces operational risk |
|
Opportunity readout The best accumulator opportunities appear where safety-critical equipment, offshore exposure, high-pressure systems, active drilling, and replacement cycles overlap. |
90-Day Oil and Gas Accumulator Market Research Plan
Planning sequence
The first month should produce a clean baseline. That means separating narrow oil and gas accumulator data from broader hydraulic accumulator data, then mapping type, application, pressure class, region, and country. The goal is not to collect every possible number; it is to prevent mixed definitions from creating misleading conclusions.
The second month should move from market size to activity signals. Rig counts, offshore rig deployment, FIDs, BOP demand, production scale, and country-level replacement needs should be compared side by side. This step turns a static forecast into a practical opportunity list.
The third month should test commercial access. A market may look attractive, but if suppliers lack certification, service coverage, approved-vendor status, or spare-part access, the opportunity may be difficult to convert. This is where the plan becomes useful for suppliers, distributors, and analysts.
| Timing | What to Do | Output |
|---|---|---|
| Days 1-30 | Build baseline by market source, type, application, pressure class, and region | Demand map |
| Days 31-60 | Compare country activity, rig counts, offshore exposure, BOP demand, and production scale | Country list |
| Days 61-90 | Review supplier coverage, certification, replacement cycles, project pipeline, and risk indicators | Market scorecard |
|
Planning principle The strongest accumulator analysis does not rely on one market CAGR. It compares forecasts with rig activity, BOP demand, offshore exposure, pressure class, country production, replacement cycles, and supplier readiness. |
Metrics Oil and Gas Accumulator Analysts Should Track
Scorecard metrics worth tracking
The metric list works best as a scorecard, not a reporting checklist. Market size and CAGR show direction, while rig count, offshore exposure, BOP share, pressure class, country production, and supplier coverage show where practical demand is likely to appear.
The strongest view pairs demand signals with reliability signals. One side shows where rigs, projects, and production assets are active; the other shows where operators must inspect, recharge, repair, certify, or replace accumulator systems.
| Metric | Why it matters |
|---|---|
| Global market size | Shows market scale |
| CAGR by source | Compares forecast assumptions |
| Rig count | Tracks drilling demand |
| Offshore rig count | Signals higher-spec demand |
| BOP application share | Shows safety-led demand |
| Type split | Separates bladder, piston, diaphragm demand |
| Pressure class | Certification needs |
| Country oil output | Indicates production-system demand |
| Country gas output | Indicates gas and offshore demand |
| Replacement cycles | Supports maintenance demand |
| Project FIDs | Signals future offshore/subsea orders |
| Supplier coverage | Shows market access |
|
Scorecard readout A useful scorecard connects headline growth to operating reality. Market values show direction, but rig activity, pressure class, BOP exposure, replacement timing, and supplier coverage show where demand can become reachable, recurring, and commercially practical. |
How Buyers Should Read Accumulator Statistics
The most useful market reading separates ambition from operating need. Forecasts show direction; field activity, BOP criticality, pressure class, certification, offshore exposure, and replacement timing show where demand becomes practical.
• A high rig count supports short-cycle BOP and drilling hydraulic demand.
• Offshore rig activity usually increases specification and redundancy requirements.
• High-pressure wells make accumulator reliability and certification more important.
• Brownfield assets create replacement demand even when new drilling slows.
• Supplier service coverage matters more in offshore and remote basins.
• Country-level demand is strongest where production scale, drilling activity, and offshore exposure overlap.
For suppliers, the strongest opportunities are markets where operators cannot easily defer maintenance: BOP systems, subsea controls, high-pressure wells, offshore assets, and brownfield fields.
For buyers, the main question is reliability. A critical accumulator must work when needed, support the required pressure and volume, and remain serviceable across inspection and replacement cycles.
The practical reading separates source forecasts, product type, application, and field activity so headline growth connects to real operating demand.
Oil and Gas Accumulator Market Statistics FAQ
Common questions
• What is the oil and gas accumulator market?
It is the market for hydraulic energy-storage equipment used in drilling, BOP control, subsea systems, production controls, wellhead equipment, and process hydraulics. Demand is tied to safety, pressure response, uptime, inspection cycles, and replacement needs.
• How large is the oil and gas accumulator market?
Straits Research values the market at USD 583.53 million in 2024 and USD 612.18 million in 2025, with a forecast of USD 898.29 million by 2033. Other forecasts vary because they use different product and end-use boundaries.
• How fast is the market growing?
The Straits Research forecast path implies a 4.91% CAGR. Other sources also point to mid-single-digit growth, which fits a steady safety-critical equipment category rather than a high-volume commodity market.
• Which accumulator type is most important?
Bladder accumulators are commonly treated as the leading oilfield type because they provide fast response, practical hydraulic storage, and broad maintenance familiarity. Piston and diaphragm units remain important where pressure, volume, footprint, or application profile differs.
• Why are accumulators important in BOP systems?
BOP systems need stored hydraulic energy for rapid well-control response. That makes accumulator reliability, pressure integrity, certification, inspection history, and replacement planning safety-critical rather than optional.
• Which applications drive demand?
BOP control is the clearest safety-critical application. Drilling hydraulics, mud pumps, subsea production controls, wellhead systems, and process hydraulics add demand through rig activity, production reliability, offshore redundancy, and brownfield maintenance.
• Which region is strongest for accumulator demand?
North America is modeled as the largest regional market because shale drilling, rig activity, BOP replacement, and production maintenance overlap. Europe is more replacement-heavy, the Middle East is production-scale driven, and Latin America has deepwater upside through Brazil and Guyana.
• How does offshore activity affect the market?
Offshore and deepwater work usually raises specification value because equipment must support redundancy, high-pressure service, difficult access, and strict reliability requirements. Offshore demand may be slower-cycle than onshore demand, but it can be higher value per system.
• Which countries matter most?
The United States, Canada, Brazil, Guyana, Saudi Arabia, UAE, Qatar, Norway, China, and Australia are important because production scale, drilling activity, offshore exposure, gas infrastructure, or replacement cycles support accumulator demand.
• What metrics should analysts track?
Useful metrics include market size, CAGR by source, rig count, offshore rig count, BOP application share, type split, pressure class, country oil and gas production, replacement cycles, project FIDs, supplier certification, and service coverage.
Practical demand is strongest where drilling activity, BOP reliability, offshore exposure, high-pressure systems, certification needs, and replacement cycles overlap.
Final Takeaway
Oil and gas accumulator statistics point to a steady, safety-critical market shaped by drilling activity, BOP reliability, offshore exposure, pressure-control requirements, and production-system maintenance. The market is not simply a volume equipment category; it supports systems where hydraulic response, redundancy, certification, and uptime matter.
For analysts and suppliers, the strongest reading compares forecasts with field activity signals. Rig count, BOP demand, offshore deployment, country production, pressure class, and replacement cycles explain more than a single CAGR.
For operators and vendors, the best opportunities appear where drilling activity, high-pressure operations, offshore complexity, subsea systems, and brownfield replacement needs overlap. That is where accumulators move from hydraulic components to safety-critical market infrastructure.


