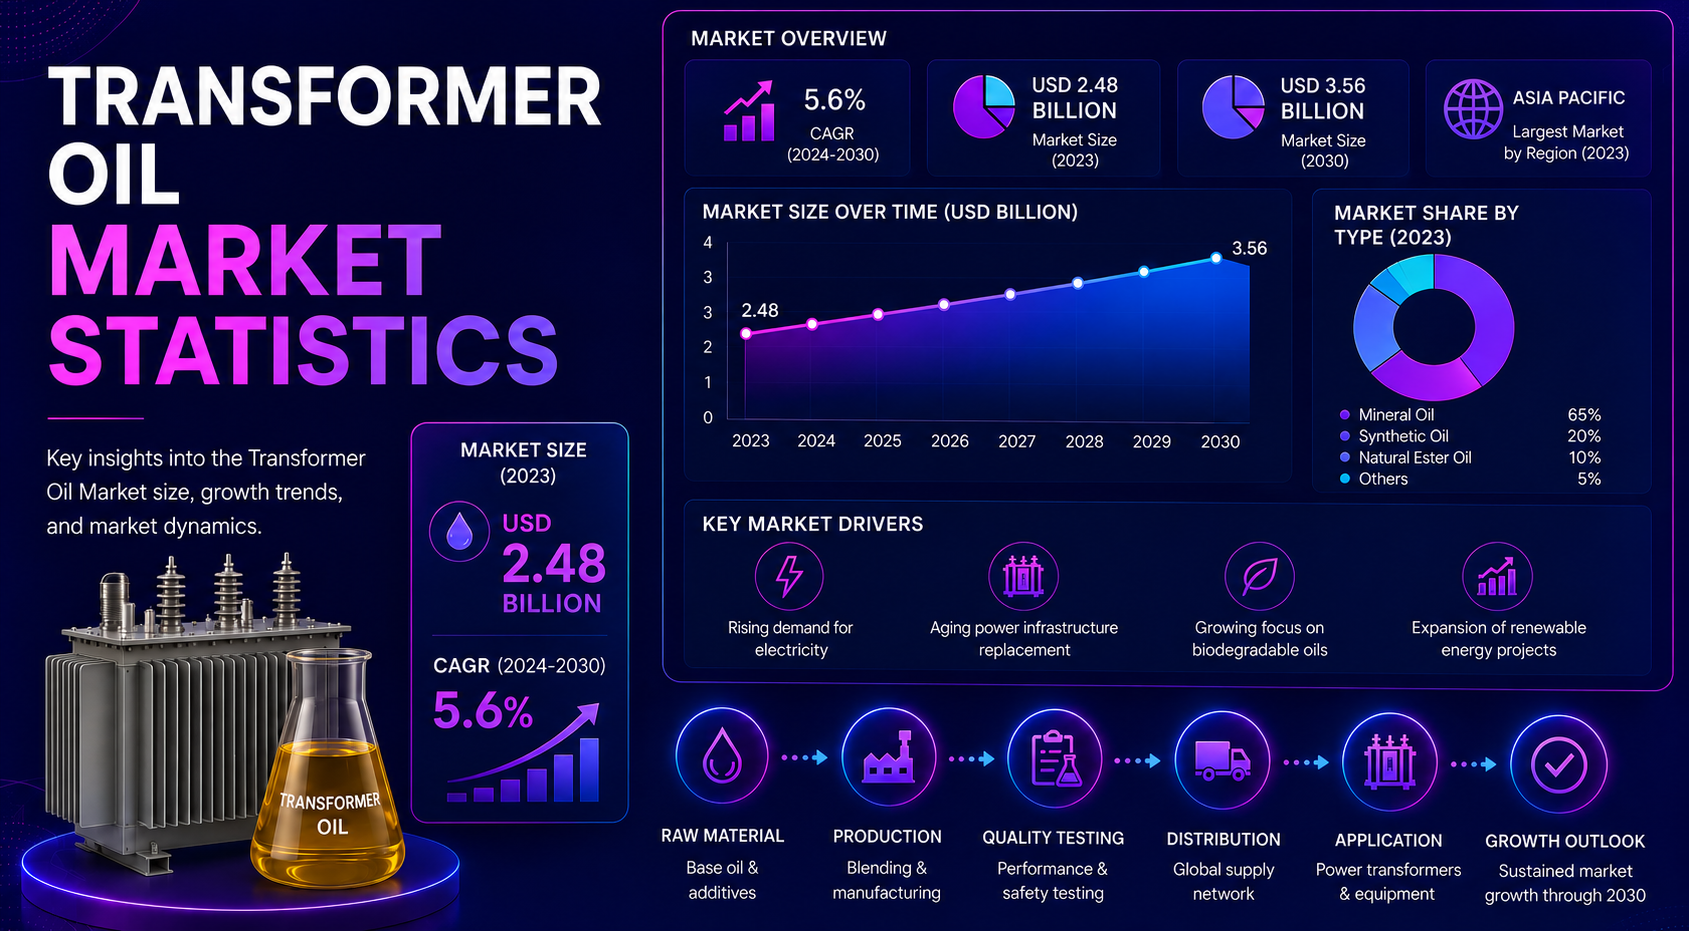
Transformer oil is where power-grid reliability, transformer life, cooling performance, fire safety, and infrastructure investment meet. The fluid is not only used to cool transformers; it also supports insulation, reduces heat stress, protects internal components, and helps utilities extend the operating life of expensive grid assets.
The strongest statistics show why transformer oil deserves its own market scorecard. Global demand is being shaped by grid expansion, aging transformer replacement, renewable-energy integration, industrial electrification, and the shift toward safer and more sustainable insulating fluids. Mineral oil remains the volume backbone of the market, while silicone-based and bio-based transformer oils are gaining attention in applications where fire safety, environmental protection, and high-temperature performance matter.
Executive Transformer Oil Benchmarks
They show the market scale, the demand geography, the product-type split, the grid investment backdrop, and the transformer supply pressure that can change oil procurement behavior.
The numbers that define the transformer oil market
- Fortune Business Insights places the global transformer oil market at USD 3.57 billion in 2025 and publishes a 2026 value of USD 3.79 billion.
- The same forecast points to USD 6.23 billion by 2034, implying a roughly 6.4% compound annual growth path from 2025 to 2034.
- Global Market Insights estimates that the market exceeded USD 2.9 billion in 2023 and could reach USD 5.2 billion by 2032.
- MarketsandMarkets uses a narrower forecast base, moving from USD 2.0 billion in 2023 to about USD 3.0 billion by 2030 at a 5.9% CAGR.
- Asia-Pacific transformer oil revenue is tracked at about USD 1.2 billion in 2023 and is forecast near USD 2.2 billion by 2032 in the GMI Asia-Pacific series.
- Marketdata Forecast places Asia-Pacific at USD 1.34 billion in 2025 and above USD 2.20 billion by 2033.
- Europe transformer oil value is estimated near USD 0.70 billion in 2025 and about USD 1.07 billion by 2033 in the Marketdata Forecast Europe series.
- The U.S. transformer oil market is estimated at USD 0.44 billion in 2025 and is forecast to pass USD 1.06 billion by 2035 in the SNS Insider series.
- Silicone-based transformer oil is estimated at USD 0.6792 billion in 2025 and is forecast above USD 1.36 billion by 2035.
- Bio-based transformer oil is estimated at USD 0.1678 billion in 2025 and is forecast above USD 0.3523 billion by 2035.
- Distribution transformers represent 54.6% of the silicone-based transformer oil opportunity in the FMI silicone series.
- North America is assigned a 31% revenue share of the bio-based transformer oil market by 2035 in the Research Nester bio-based series.
- Global electricity demand grew by 4.4% in 2024 and is expected to grow by 3.0% in 2025, keeping grid equipment demand elevated.
- Large power transformer procurement lead times can reach 4 years, while cable and large-transformer lead times are around 2 times their 2021 level.
- U.S. generator step-up transformer demand increased 274% from 2019 to 2025, while substation power transformer demand increased 116% over the same period.
- U.S. transformer prices rose about 80% over five years, a signal that utilities may extend asset life, increase oil testing, and plan maintenance more carefully.
| Benchmark area | What it shows | Article use |
|---|---|---|
| Global market value | Overall demand scale | Opening market-size framing |
| Asia-Pacific value | Regional demand concentration | Regional intelligence |
| U.S. market value | Replacement and reliability pressure | Country-level signals |
| Silicone oil value | Fire-safe fluid opportunity | Product segmentation |
| Bio-based oil value | Sustainability opportunity | Sustainability section |
| Transformer lead time | Procurement pressure | Supply-chain risk section |
Editorial readout
The headline data points to five demand engines: grid expansion, transformer replacement, renewable-energy interconnection, industrial electrification, and safer fluid selection. A useful transformer oil market analysis should separate growth by oil type, transformer type, application, region, country, and infrastructure driver.
Why Transformer Oil Now Carries Grid-Scale Importance
Transformer oil demand becomes more important when electricity systems are expanding, transformers are aging, and utilities are connecting more renewable and industrial loads. The oil is a small part of the total transformer cost, but it performs a large reliability role because it affects insulation, cooling, oxidation control, testing routines, and maintenance timing.
Market-scale and grid-demand benchmarks
- Global electricity demand growth reached 4.4% in 2024, which was strong enough to reinforce long-term demand for transformers and related insulating fluids.
- The average annual global electricity demand growth forecast is 3.6% for 2026–2030, keeping the power equipment pipeline active beyond a single-year cycle.
- Global energy investment is estimated at USD 3.3 trillion in 2025, with clean energy investment at USD 2.2 trillion.
- Solar power investment is tracked at USD 450 billion in 2025, creating continued need for step-up transformers and grid-connection equipment.
- Battery storage investment is tracked at USD 66 billion in 2025, adding another source of electrical infrastructure and transformer demand.
- Annual grid investment is estimated at about USD 400 billion per year, which is a key long-term support for transformer oil first-fill, refill, and maintenance demand.
- China accounts for roughly 33% of global clean energy investment, making it a central country-level demand signal for grid equipment and insulating fluids.
- U.S. power consumption is forecast at 4,195 billion kWh in 2025 and 4,271 billion kWh in 2026.
- U.S. power consumption is forecast to rise further to 4,397 billion kWh by 2027, supporting additional transformer and distribution-system utilization.
- U.S. commercial electricity consumption is forecast at 1,547 billion kWh in 2026, while residential consumption is forecast at 1,512 billion kWh and industrial consumption at 1,066 billion kWh.
- U.S. renewables are expected to account for 24% of power generation in 2025 and 27% by 2027, increasing the need for grid integration infrastructure.
- U.S. coal share is expected to fall from 17% in 2025 to 15% by 2027, showing that the grid mix is shifting while total electricity demand continues to rise.
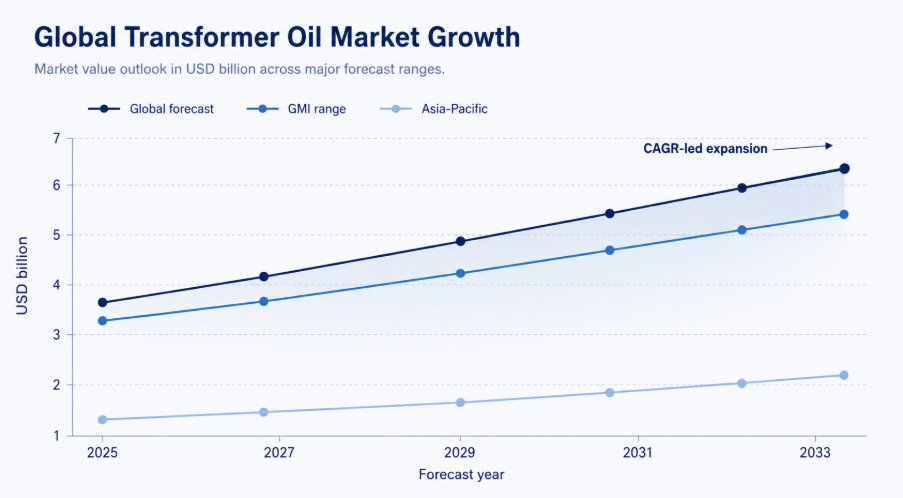
Figure 1. Transformer oil market growth should be reviewed alongside grid investment because fluid demand rises when transformer manufacturing, replacement, and maintenance cycles expand.
Market-scale interpretation
A transformer oil forecast is more useful when it is read beside grid investment and electricity-demand data. A market can grow through new transformer installations, replacement cycles, oil testing, reclamation, and refilling, so demand should be measured by infrastructure activity rather than by oil price alone.
Global Transformer Oil Market Size and Forecast
Market estimates vary because providers define the transformer oil universe differently. Some forecasts focus primarily on mineral-based insulating oils, while others include silicone fluids, natural esters, synthetic esters, bio-based alternatives, and service-related demand. The useful reading is not a single isolated number; the useful reading is the direction, the forecast spread, and the drivers behind it.
Forecast comparison benchmarks
- Fortune Business Insights uses a 2025 base of USD 3.57 billion and a 2034 forecast of USD 6.23 billion.
- Fortune’s 2026 value is published at USD 3.79 billion, creating a near-term marker for the market’s path.
- Global Market Insights places the 2023 market above USD 2.9 billion and estimates USD 5.2 billion by 2032.
- MarketsandMarkets places the 2023 market at USD 2.0 billion and expects about USD 3.0 billion by 2030.
- Intel Market Research places the 2025 market at USD 2.73 billion and expects USD 3.76 billion by 2032.
- The Fortune series implies a higher 2034 endpoint because it uses a broader 2025 value and a longer forecast period.
- The MarketsandMarkets series is useful as a conservative benchmark because it moves from USD 2.0 billion in 2023 to USD 3.0 billion by 2030.
- The Global Market Insights series is useful for a mid-to-high market path because it moves from more than USD 2.9 billion in 2023 to USD 5.2 billion by 2032.
- The forecast range shows that the market’s expected growth is steady even when source methodologies differ.
- The 2030–2035 period matters because grid modernization, renewable integration, and high-voltage transformer demand do not stop at the end of a single forecast window.
| Forecast source | Base year/value | Forecast year/value | CAGR or article reading |
|---|---|---|---|
| Fortune Business Insights | 2025: USD 3.57 billion | 2034: USD 6.23 billion | Higher long-range global path; useful headline benchmark |
| Global Market Insights | 2023: above USD 2.9 billion | 2032: USD 5.2 billion | Mid-to-high growth path tied to grid and power demand |
| MarketsandMarkets | 2023: USD 2.0 billion | 2030: USD 3.0 billion | Conservative forecast useful for comparison |
| Intel Market Research | 2025: USD 2.73 billion | 2032: USD 3.76 billion | Moderate path for market-size triangulation |
Market-size interpretation
The article should acknowledge that forecast values vary, but it should not let that weaken the story. Every major forecast points to positive growth. The common growth logic is grid investment, transformer replacement, renewable power connection, rising electricity demand, and growing interest in alternative insulating fluids.
Where Transformer Oil Demand Is Being Created
Transformer oil demand follows transformer demand. When utilities build substations, replace aging grid assets, connect renewables, expand distribution systems, or protect industrial power assets, they also create demand for first-fill oil, replacement oil, oil testing, regeneration, and long-term maintenance services.
Demand-driver statistics worth separating
- Grid investment of about USD 400 billion per year creates a broad base for transformer installations and maintenance demand.
- Clean energy investment of USD 2.2 trillion creates transformer demand through renewable generation, transmission upgrades, and storage interconnections.
- Solar investment of USD 450 billion is important because utility-scale solar projects commonly require step-up transformers and substation connections.
- Battery storage investment of USD 66 billion adds grid equipment demand through inverters, substations, transformers, and interconnection systems.
- The 3.6% average annual electricity-demand forecast for 2026–2030 supports continued stress on transmission and distribution assets.
- U.S. commercial power consumption of 1,547 billion kWh in 2026 is a useful indicator for data centers, offices, retail, and service-sector load.
- U.S. industrial power consumption of 1,066 billion kWh in 2026 supports demand for industrial transformers and oil maintenance programs.
- A rise in U.S. renewable share from 24% in 2025 to 27% in 2027 reinforces the need for grid integration and transformer equipment.
- Generator step-up transformer demand in the United States rose 274% from 2019 to 2025, making renewable and generation-connection transformers a major signal.
- Substation power transformer demand in the United States rose 116% from 2019 to 2025, showing demand pressure inside the grid itself.
- Large transformer lead times of up to 4 years can encourage utilities to extend the life of existing transformers through oil testing, filtration, reclamation, and better monitoring.
- Transformer prices rising 80% over five years can also make oil maintenance more valuable because replacement assets are expensive and slow to procure.
| Demand signal | How it creates oil demand | Likely market impact |
|---|---|---|
| Grid expansion | New substations and power transformers require first-fill insulating fluid | Higher first-fill oil volume |
| Aging transformer fleet | Existing assets require testing, regeneration, and refill | More service and maintenance demand |
| Renewable integration | Solar, wind, and storage projects require grid-connection transformers | More project-linked oil demand |
| Industrial electrification | Factories, data centers, mining, and transport systems need reliable power assets | Higher reliability-led oil demand |
| Transformer shortages | Utilities may operate existing units longer | More oil testing and life-extension demand |
Demand-driver interpretation
The most useful demand view separates new-build demand from installed-base demand. New transformers create first-fill oil requirements. Older transformers create maintenance, testing, regeneration, and replacement-fluid demand. Both are important, but they belong to different buyer behaviors and procurement cycles.
Mineral Oil: Still the Volume Backbone
Mineral oil remains the standard transformer insulating fluid because it is cost-effective, familiar to utilities, broadly available, and supported by a long installed base of power and distribution transformers. Its position is strongest where procurement teams need a proven fluid at scale, especially across conventional transmission and distribution systems.
Mineral oil market signals
- Mineral oil remains the dominant transformer oil type in most conventional transformer fleets because it offers cost efficiency and established operating experience.
- The global transformer oil forecast of USD 3.57 billion in 2025 includes a large mineral-oil base because mineral fluids still support most high-volume utility applications.
- The Asia-Pacific transformer oil market value of USD 1.34 billion in 2025 is heavily tied to high-volume mineral-oil demand in distribution and power transformers.
- The APAC GMI series projects Asia-Pacific transformer oil revenue near USD 2.2 billion by 2032, leaving mineral oil as the largest volume contributor even as alternative fluids gain share.
- Europe’s USD 0.70 billion transformer oil value in 2025 includes mineral-oil demand from installed assets, replacement cycles, and grid modernization projects.
- The U.S. transformer oil value of USD 0.44 billion in 2025 reflects both first-fill demand and installed-base maintenance, where mineral oil remains common.
- Mineral oil is especially relevant for distribution transformers because the unit count is large and procurement often prioritizes cost, availability, and standardization.
- Mineral oil demand is also supported by oil testing, drying, filtration, and reclamation programs for transformers that remain in service for decades.
- The main limitation of mineral oil is not performance familiarity; it is environmental spill risk and lower fire-safety performance compared with ester or silicone fluids in sensitive locations.
- The market should therefore describe mineral oil as the volume backbone, not as the entire growth story.
| Mineral oil strength | Market meaning | Limitation to track |
|---|---|---|
| Low cost | Supports high-volume procurement for utility fleets | May face pressure in sensitive sites |
| Availability | Helps standardize transformer maintenance and refilling | Supply cost can still move with petroleum markets |
| Familiar performance | Utilities understand testing and operating behavior | Environmental and fire-safety requirements can shift decisions |
| Installed base | Creates refill, filtration, and reclamation demand | Older fleets may need more monitoring |
Mineral oil interpretation
Mineral oil should be presented as the market foundation. It is the category most closely tied to scale, installed-base service, and standard utility procurement. The article can then explain that silicone and bio-based fluids are not replacing all mineral oil; they are growing where safety, environmental protection, and operating conditions justify a higher-value fluid.
Silicone Oil: Fire Safety and High-Temperature Use Cases
Silicone-based transformer oil occupies a smaller but important part of the market. It is most relevant where fire safety, high-temperature stability, indoor installation, dense urban infrastructure, or sensitive operating environments matter more than the lowest upfront fluid cost.
Silicone oil benchmarks
- Silicone-based transformer oil is estimated at USD 0.6792 billion in 2025.
- The silicone-based transformer oil market is forecast at USD 0.7281 billion in 2026 and USD 0.7805 billion in 2027.
- By 2030, silicone-based transformer oil is projected near USD 0.9616 billion.
- By 2035, the silicone-based transformer oil market is projected above USD 1.36 billion.
- Distribution transformers represent 54.6% of the silicone-based transformer oil opportunity in the FMI silicone series.
- China’s silicone-based transformer oil CAGR is tracked at 9.7% for 2025–2035, making it one of the fastest country-level growth signals.
- India’s silicone-based transformer oil CAGR is tracked at 9.0% for 2025–2035, reflecting grid expansion and safety-focused applications.
- Germany’s silicone-based transformer oil CAGR is tracked at 8.3% for 2025–2035.
- The United Kingdom’s silicone-based transformer oil CAGR is tracked at 6.8% for 2025–2035.
- The United States silicone-based transformer oil CAGR is tracked at 6.1% for 2025–2035.
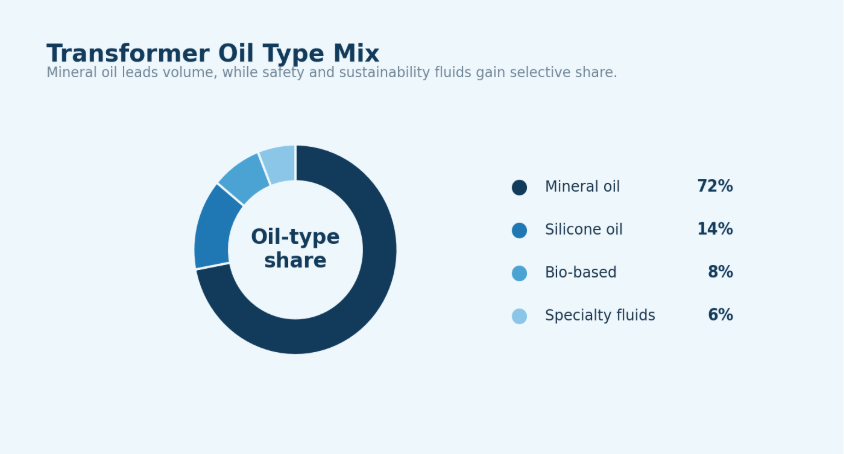
Figure 2. Mineral oil remains the volume leader, while silicone and bio-based transformer oils grow in specialized applications where fire safety, environmental protection, and thermal performance matter.
Silicone oil interpretation
Silicone oil growth should be framed around use-case quality, not only market size. It is most valuable where fire risk, heat stress, indoor siting, dense infrastructure, or reliability requirements increase the value of higher-performance insulating fluid.
Bio-Based Transformer Oil: Sustainability and Fire-Safe Growth
Bio-based transformer oil and natural ester fluids are gaining attention because they support environmental protection, biodegradability, fire safety, and utility sustainability goals. Their market share is smaller than mineral oil, but their strategic value is higher in environmentally sensitive projects, renewable-energy sites, indoor transformers, and utilities with stronger sustainability procurement rules.
Bio-based and natural ester benchmarks
- Bio-based transformer oil is estimated at USD 0.1678 billion in 2025.
- The bio-based transformer oil market is forecast at USD 0.1807 billion in 2026 and USD 0.1946 billion in 2027.
- By 2030, bio-based transformer oil is projected at about USD 0.2431 billion.
- By 2035, the bio-based transformer oil market is forecast near USD 0.3523 billion.
- Research Nester publishes a 2026 bio-based transformer oil value of USD 0.1794 billion.
- North America is expected to hold a 31% revenue share of bio-based transformer oil by 2035.
- Bio-based fluids benefit from environmental positioning because they are marketed around lower spill risk, renewable feedstocks, and biodegradability.
- Natural ester fluids are also discussed in the market because they can offer fire-safety advantages compared with conventional mineral oils.
- Bio-based oil demand is most likely to grow in utilities, renewable projects, sensitive locations, and installations where environmental risk is a procurement factor.
- Bio-based oil is best understood as a high-growth niche with strategic relevance rather than as the immediate volume leader.
| Oil type | Core market role | Best article angle |
|---|---|---|
| Mineral oil | Largest volume base for conventional transformers | Scale, cost, availability, and installed-base maintenance |
| Silicone oil | Specialized fire-safe and high-temperature fluid | Urban, indoor, safety-sensitive, and high-reliability applications |
| Bio-based / natural ester | Environmental and sustainability-led alternative | Biodegradability, spill risk, fire safety, and renewable projects |
| Reclaimed / regenerated oil | Lifecycle and service-market component | Cost control, circularity, and asset-life extension |
Product-type interpretation
The product story is not a simple replacement story. Mineral oil remains the volume backbone. Silicone oil grows in safety and heat-sensitive applications. Bio-based and natural ester fluids grow where environmental protection, biodegradability, fire safety, and sustainability rules matter.
Transformer Type and Application Statistics
Transformer oil consumption is shaped by transformer size, voltage class, application, operating temperature, service location, and maintenance strategy. Power transformers and distribution transformers create different oil-demand patterns: power transformers use more oil per unit, while distribution transformers create demand through high unit counts.
Application-level demand signals
- Power transformer demand is tied to transmission expansion, renewable interconnection, substations, industrial power systems, and high-voltage infrastructure.
- Distribution transformer demand is tied to urban distribution networks, rural electrification, industrial parks, housing growth, and local reliability upgrades.
- The 54.6% distribution-transformer share in silicone-based transformer oil highlights how safety-oriented fluids can also matter in smaller transformer categories.
- Generator step-up transformer demand increasing 274% in the United States from 2019 to 2025 shows how generation interconnection can quickly raise transformer and oil needs.
- Substation transformer demand increasing 116% in the United States over the same period shows that the grid core also creates demand, not only generation projects.
- Commercial electricity consumption of 1,547 billion kWh in the United States in 2026 is a useful proxy for data centers and commercial power infrastructure.
- Industrial electricity consumption of 1,066 billion kWh in the United States in 2026 supports industrial transformer maintenance and reliability programs.
- Residential electricity consumption of 1,512 billion kWh in the United States in 2026 supports demand across distribution networks and neighborhood transformer fleets.
- Renewable generation share moving from 24% to 27% in the United States between 2025 and 2027 creates additional interconnection and distribution-planning requirements.
- The best application analysis should separate high-oil-volume power transformers from high-unit-count distribution transformers and reliability-critical industrial transformers.
| Application | Oil demand pattern | Best article angle |
|---|---|---|
| Power transformers | High oil volume per unit | Transmission expansion, substations, grid reliability |
| Distribution transformers | Large unit count and broad installed base | Electrification, urban networks, replacement demand |
| Generator step-up transformers | Project-linked demand from generation assets | Renewables and power plant interconnection |
| Industrial transformers | Reliability-driven oil monitoring and maintenance | Downtime prevention and asset life |
| Renewable project transformers | New-build demand tied to solar, wind, and storage | Grid connection and energy transition |
Regional Transformer Oil Intelligence
Regional transformer oil statistics are especially important because transformer demand depends on electricity consumption, grid age, renewable-energy buildout, industrial growth, utility spending, and transformer manufacturing capacity. Global averages can hide large differences between Asia-Pacific expansion, North American replacement pressure, European environmental priorities, Middle East infrastructure growth, and Latin American project-led demand.
Asia-Pacific
- Asia-Pacific transformer oil value is estimated at USD 1.2 billion in 2023 in the GMI Asia-Pacific series.
- The same series places Asia-Pacific at USD 1.373 billion in 2025 and USD 1.9228 billion by 2030.
- Asia-Pacific transformer oil value is forecast near USD 2.2 billion by 2032 in the GMI Asia-Pacific series.
- MarketDataForecast places Asia-Pacific at USD 1.34 billion in 2025 and USD 2.2059 billion by 2033.
- China’s silicone-based transformer oil CAGR is tracked at 9.7% for 2025–2035.
- India’s silicone-based transformer oil CAGR is tracked at 9.0% for 2025–2035.
- China accounts for roughly 33% of global clean energy investment, giving the country a large indirect signal for transformer, substation, and insulating-fluid demand.
- Asia-Pacific demand is supported by grid expansion, manufacturing growth, industrial electrification, urban distribution networks, and renewable-energy additions.
- Japan and South Korea add a reliability and advanced-grid angle, where performance, quality, and safety standards can influence oil choices.
- Southeast Asian markets such as Indonesia, Vietnam, Thailand, Malaysia, and the Philippines add a distribution-network and electricity-access growth story.
North America
- The U.S. transformer oil market is estimated at USD 0.44 billion in 2025.
- The U.S. market is forecast at USD 0.6829 billion in 2030 and USD 1.06 billion by 2035.
- U.S. generator step-up transformer demand increased 274% from 2019 to 2025.
- U.S. substation power transformer demand increased 116% from 2019 to 2025.
- U.S. transformer prices rose about 80% over five years, strengthening the business case for transformer maintenance and oil testing.
- High-capacity transformer queue length in the United States can reach 4 years.
- Hitachi Energy announced more than USD 1 billion in U.S. investment connected to transformer and grid equipment expansion.
- Siemens North Carolina manufacturing spending is tracked at USD 421 million, showing the manufacturing response to grid equipment demand.
- Canada contributes grid modernization, hydro-linked transmission, and resource-sector power demand.
- Mexico contributes industrial and nearshoring-related power demand, especially where manufacturing sites require reliable distribution infrastructure.
Europe
- Europe transformer oil value is estimated at USD 0.66 billion in 2024 and USD 0.6964 billion in 2025.
- The Europe series rises to USD 0.9106 billion in 2030 and USD 1.0695 billion by 2033.
- Germany’s silicone-based transformer oil CAGR is tracked at 8.3% for 2025–2035.
- The United Kingdom’s silicone-based transformer oil CAGR is tracked at 6.8% for 2025–2035.
- European demand is shaped by grid modernization, offshore wind integration, interconnectors, electrification, and environmental procurement standards.
- Germany, the United Kingdom, France, Italy, Spain, the Netherlands, and Poland are useful country clusters because they combine industrial load, grid upgrades, and renewable integration.
- Europe is one of the most important regions for the sustainability angle because fire-safe and environmentally responsible fluids can gain more attention in regulated or sensitive locations.
- Aging distribution and transmission assets support maintenance, oil testing, replacement-fluid demand, and transformer refurbishment activity.
Middle East and Africa
- Middle East and Africa demand is shaped by utility expansion, industrial power systems, oil and gas infrastructure, urban development, and electrification programs.
- Saudi Arabia and the UAE are important because mega-projects, industrial zones, and utility expansion require transformers and insulating fluids.
- Qatar adds demand from industrial infrastructure, LNG-related facilities, and high-reliability power networks.
- South Africa adds a reliability and grid-stability story because transformer maintenance and replacement can become urgent when network stress is high.
- Egypt and Nigeria add electricity-access and grid expansion angles, where distribution transformers and substations can create long-term oil demand.
- The region should be described as infrastructure-led rather than purely replacement-led.
Latin America
- Latin America demand is project-led, with transformer oil consumption tied to transmission upgrades, renewable projects, industrial power, mining, and distribution improvements.
- Brazil is the regional anchor because of hydropower, renewable expansion, industrial demand, and large transmission-network requirements.
- Mexico adds manufacturing and nearshoring demand that can require new substations, distribution assets, and industrial transformers.
- Chile adds a renewable-energy and mining-power story, especially where solar, copper, and transmission projects require reliable transformers.
- Argentina, Colombia, and Peru add distribution, industrial, and regional grid-modernization opportunities.
- Latin America should be measured by project pipelines and utility investment rather than by one broad regional market number.
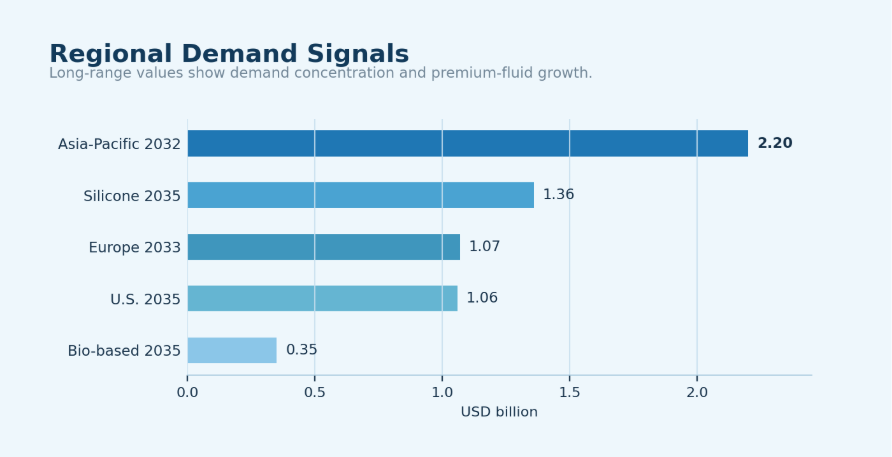
Figure 3. Regional transformer oil demand should be measured by grid expansion, renewable interconnection, industrial electrification, and replacement cycles rather than global market value alone.
| Application | Oil demand pattern | Best article angle |
|---|---|---|
| Power transformers | High oil volume per unit | Transmission expansion, substations, grid reliability |
| Distribution transformers | Large unit count and broad installed base | Electrification, urban networks, replacement demand |
| Generator step-up transformers | Project-linked demand from generation assets | Renewables and power plant interconnection |
| Industrial transformers | Reliability-driven oil monitoring and maintenance | Downtime prevention and asset life |
| Renewable project transformers | New-build demand tied to solar, wind, and storage | Grid connection and energy transition |
Regional interpretation
Asia-Pacific carries the strongest expansion story, while North America carries the strongest shortage and replacement story. Europe carries the strongest sustainability and modernization story. Middle East and Africa are infrastructure-led, and Latin America is best understood through project pipelines, renewables, mining, and transmission upgrades.
Country-Level Transformer Oil Demand Signals
Country-level statistics are useful because transformer oil demand is often created by national grid plans, utility procurement, renewable-energy targets, industrial expansion, and transformer manufacturing capacity. A country with strong electricity demand or renewable investment can become important even when its transformer oil market value is not separately published.
Country signals to use in the article
- China is the most important Asia-Pacific demand anchor because it combines grid expansion, transformer manufacturing, renewable additions, and a high 9.7% silicone-based transformer oil CAGR signal.
- India is a high-growth country signal because its 9.0% silicone-based transformer oil CAGR combines with distribution expansion, renewable energy, and industrial electrification.
- The United States is the clearest shortage-led market because generator step-up transformer demand rose 274%, substation transformer demand rose 116%, and transformer prices rose 80% over five years.
- Germany is a high-value European signal because its 8.3% silicone-based transformer oil CAGR sits beside grid modernization and renewable integration.
- The United Kingdom has a 6.8% silicone-based transformer oil CAGR signal and a strong grid modernization and offshore-wind connection story.
- France contributes transmission reliability, nuclear-linked infrastructure, industrial power demand, and grid maintenance needs.
- Japan contributes high-reliability transformer maintenance demand, urban grid density, and advanced equipment quality requirements.
- South Korea contributes industrial and electronics-sector demand, where power reliability and equipment performance matter.
- Brazil is the strongest Latin American anchor because hydropower, renewables, transmission upgrades, and industrial demand all require transformer assets.
- Mexico is important for nearshoring and manufacturing-led electricity demand, especially in industrial zones.
- Saudi Arabia is important for utility expansion, mega-project power systems, oil and gas infrastructure, and high-temperature operating conditions.
- The UAE is important for urban infrastructure, data-center growth, energy transition projects, and high-reliability power systems.
| Country group | Demand signal | Oil opportunity | Article use |
|---|---|---|---|
| China & India | Grid growth, renewables, distribution | Mineral oil scale; ester/silicone | APAC growth anchor |
| U.S., Canada, Mexico | Aging grids, shortages, data centers | Mineral oil plus premium fluids | North America replacement |
| Germany, U.K., France | Grid upgrades, offshore wind, rules | Ester and fire-safe fluids | Europe sustainability |
| Japan & South Korea | Dense grids, reliability, manufacturing | Premium mineral, silicone, ester | High-reliability Asia |
| Brazil, Chile, Mexico | Renewables, transmission, hydropower | Mineral oil; project-led ester | Latin America demand |
| Saudi Arabia, UAE, S. Africa | Utility growth, mega-projects, oil/gas | High-temp, fire-safe fluids | MEA infrastructure |
Transformer Shortages, Grid Delays, and Supply Pressure
Transformer oil demand does not move in isolation. When transformer manufacturers face long lead times, rising equipment prices, or material bottlenecks, the transformer oil market also feels the effect through procurement timing, maintenance decisions, refill demand, and replacement planning.
Supply-chain and procurement benchmarks
- Large power transformer procurement lead times can reach 4 years.
- Cable procurement lead times are tracked at 2 to 3 years.
- Direct current cable waiting times can reach 5 years or more.
- Cable and large-transformer lead times are about 2 times their 2021 level.
- U.S. high-capacity transformer queue length is also tracked at about 4 years.
- U.S. transformer prices increased about 80% over five years.
- Astor Enerji transformer contracts for U.S. shipments are tracked at USD 769 million for 2026–2028.
- LS Electric’s extra-high-voltage transformer contract is tracked at USD 312 million for 2027–2029.
- Hitachi Energy announced more than USD 1 billion of U.S. investment tied to transformer and grid equipment expansion.
- Hitachi’s new large transformer facility investment is tracked at USD 457 million, while a transformer component plant investment is tracked at USD 106 million.
- Siemens North Carolina manufacturing spending is tracked at USD 421 million.
- Supply pressure can raise the importance of oil testing, condition monitoring, filtration, reclaiming, and life-extension programs for transformers that utilities cannot replace quickly.
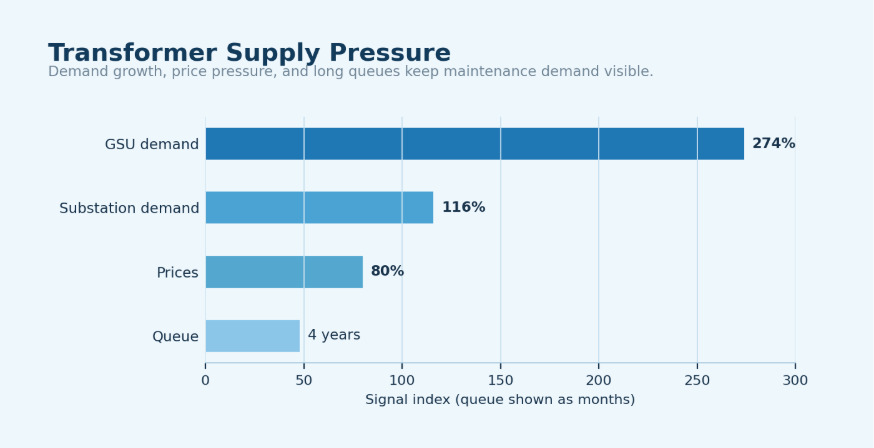
Figure 4. Transformer shortages and longer lead times can increase maintenance, oil testing, and life-extension demand for existing transformer fleets.
| Supply-chain signal | Transformer oil impact |
|---|---|
| Longer transformer lead times | More pressure to maintain existing units through oil testing, filtration, and reclamation |
| Higher transformer prices | More interest in extending transformer life and delaying replacement |
| Grid project delays | Oil demand may shift across years rather than disappear |
| Renewable interconnection queues | Long-term transformer and insulating-fluid demand remains supported |
| Manufacturing investment | New transformer output can increase first-fill oil demand when capacity comes online |
Supply-chain interpretation
Transformer shortages do not only affect transformer buyers. They also affect oil suppliers, testing laboratories, service providers, and utilities. When replacement assets are costly or delayed, oil health becomes a more important lever for keeping transformers in service safely.
Environmental and Fire-Safety Pressures
Transformer oil selection is increasingly influenced by environmental risk, fire safety, land-use sensitivity, water protection, indoor installation rules, and utility sustainability goals. These factors do not eliminate mineral oil demand, but they do change the decision process in sensitive locations and high-risk applications.
Sustainability and safety statistics to connect
- Bio-based transformer oil is forecast to grow from USD 0.1678 billion in 2025 to USD 0.3523 billion by 2035.
- The published 2026 bio-based transformer oil value is USD 0.1794 billion.
- North America is expected to hold a 31% revenue share of bio-based transformer oil by 2035.
- Silicone-based transformer oil is forecast to rise from USD 0.6792 billion in 2025 to USD 1.3613 billion by 2035.
- China’s 9.7% silicone oil CAGR and India’s 9.0% CAGR show that safety-oriented fluids can grow quickly in expanding markets.
- Germany’s 8.3% silicone oil CAGR supports the idea that Europe can be important for higher-performance and regulated applications.
- Fire-safe fluids are more relevant in indoor transformers, dense urban substations, commercial buildings, rail systems, renewable sites, and sensitive industrial locations.
- Environmental fluids are more relevant where spill risk, water protection, soil contamination, or sustainability procurement standards matter.
- Oil reclamation and regeneration also support sustainability because they reduce waste and can extend fluid life where quality standards are met.
- Sustainability is a product-selection filter, not a single replacement wave.
| Decision factor | What it changes | Oil-market implication |
|---|---|---|
| Fire safety | Raises interest in high-fire-point fluids | Supports silicone and ester-fluid adoption |
| Environmental risk | Makes spill behavior and biodegradability more important | Supports bio-based and natural ester fluids |
| Indoor location | Increases safety and code sensitivity | Higher-value fluid decisions become easier to justify |
| Utility sustainability targets | Adds procurement pressure beyond upfront cost | More supplier differentiation |
| Asset-life extension | Encourages testing, filtration, and regeneration | Expands service-market opportunity |
Sustainability interpretation
Sustainability is not replacing mineral oil everywhere. It is changing how utilities and industrial buyers evaluate fluid choice in sensitive locations, renewable-energy projects, indoor installations, and high-risk environments. The market story should therefore balance mineral-oil scale with the growth of higher-value alternative fluids.
Competitive Landscape and Supplier Positioning
Transformer oil suppliers compete on price, availability, dielectric performance, oxidation stability, fire safety, environmental profile, technical service, utility approvals, and local distribution. The market includes global oil companies, specialty chemical producers, ester-fluid suppliers, silicone-fluid producers, testing laboratories, and regional distributors.
Supplier-positioning benchmarks and signals
- A global market moving toward USD 6.23 billion by 2034 creates room for both high-volume mineral-oil suppliers and specialized alternative-fluid producers.
- A silicone-based market forecast above USD 1.36 billion by 2035 gives specialty-fluid suppliers a clear growth lane.
- A bio-based market forecast above USD 0.3523 billion by 2035 creates a smaller but strategically important sustainability lane.
- Asia-Pacific’s forecast above USD 2.2 billion by 2032 makes regional distribution, local approvals, and transformer-manufacturer relationships especially important.
- The U.S. forecast above USD 1.06 billion by 2035 makes North America important for suppliers that can support reliability, testing, and grid replacement demand.
- Europe’s forecast above USD 1.06 billion by 2033 supports suppliers with environmental, fire-safety, and utility-standard positioning.
- Transformer oil testing labs become more important when transformer prices rise and replacement lead times lengthen.
- Regeneration and reclamation providers become more important when utilities want to extend fluid life and reduce waste.
- Regional distributors remain important because transformer oil procurement depends on availability, documentation, transport, storage, and emergency support.
- Supplier credibility depends not only on product performance but also on approval history, quality consistency, technical support, and field-service capability.
| Supplier type | Strength | Buyer consideration |
|---|---|---|
| Mineral oil producers | Scale, cost, and broad availability | Consistency, price stability, and utility approval |
| Silicone fluid suppliers | Fire safety and high-temperature performance | Higher upfront cost and application fit |
| Ester / bio-based suppliers | Sustainability, biodegradability, and safety profile | Technical acceptance and lifecycle value |
| Testing laboratories | Condition monitoring and asset-life insight | Speed, accuracy, and maintenance integration |
| Reclamation providers | Cost control and circularity | Quality assurance and suitability for reuse |
Transformer Oil Market Diagnostic
A polished transformer oil statistics report should help readers decide where to look next. The best diagnostic model connects statistics to market questions: where is demand growing, which oil types are gaining, what is happening in transformers, and what risks affect procurement timing?
| Problem area | Core signals to measure | Useful benchmark from this report |
|---|---|---|
| Grid expansion demand | Transmission projects, substations, transformer orders, grid investment | Annual grid investment of about USD 400 billion |
| Replacement demand | Transformer age, lead times, prices, maintenance pressure | Large transformer lead times up to 4 years and price increases near 80% |
| Product substitution | Mineral oil scale versus silicone and bio-based growth | Silicone above USD 1.36 billion by 2035; bio-based above USD 0.3523 billion by 2035 |
| Regional demand | Country electricity growth, renewable projects, industrial load | Asia-Pacific near USD 2.2 billion by 2032 and Europe above USD 1.06 billion by 2033 |
| Supply-chain pressure | Equipment queue, contract awards, manufacturing investment | U.S. GSU demand up 274% and substation transformer demand up 116% |
| Sustainability shift | Bio-based oil share, ester adoption, fire-safe use cases | North America 31% bio-based revenue share by 2035 |
Diagnostic principle
Each statistic should answer a market question. Is demand coming from new transformers or installed-base maintenance? Is growth regional or global? Is the opportunity mineral-oil volume, silicone performance, bio-based sustainability, or oil-service activity? The clearer those answers are, the less the article feels like a raw data dump.
90-Day Transformer Oil Market Intelligence Plan
Statistics become more useful when they are translated into a repeatable measurement plan. A 90-day approach helps suppliers, utilities, and investors organize the market into baseline data, segment comparison, and final opportunity scoring.
| Timing | What to do | Output |
|---|---|---|
| Days 1-30 | Build the baseline from global market size, product type, application, region, and country stats | Clear demand map by oil type, region, and application |
| Days 31-60 | Compare mineral oil, silicone oil, bio-based oil, power transformers, distribution transformers, and regional growth | Segment opportunity view with stronger article storytelling |
| Days 61-90 | Review transformer shortages, grid investment, environmental rules, supplier investments, and country-level demand signals | Final market scorecard for profitable demand and procurement risk |
Planning principle
The best transformer oil analysis should not chase every available number. It should compare market size, grid investment, transformer demand, product type, and regional growth to explain where oil demand is strongest and why.
Metrics Transformer Oil Suppliers and Utilities Should Track
The final scorecard should be detailed enough to locate demand without becoming a vanity dashboard. These metrics help connect global market forecasts with practical buying, production, maintenance, and investment decisions.
| Metric | Why it matters |
|---|---|
| Global transformer oil market value | Overall demand scale and gives the article its headline benchmark |
| CAGR by source | The speed of market expansion and helps compare forecast methodologies |
| Regional market share | Where demand is concentrated and where localization matters |
| Country-level grid investment | Connects oil demand to actual infrastructure activity |
| Mineral oil share | The baseline volume opportunity |
| Silicone oil CAGR | Fire-safe and high-temperature fluid growth |
| Bio-based oil CAGR | Sustainability-driven fluid demand |
| Power transformer demand | High-volume oil requirement per asset |
| Distribution transformer demand | High-unit-count opportunity |
| Transformer lead time | Procurement pressure and maintenance urgency |
| Oil testing demand | Service opportunity from installed transformer fleets |
| Reclamation and regeneration demand | Sustainability and asset-life extension opportunity |
Transformer Oil Market Statistics FAQ
Common questions
- What is the size of the transformer oil market?
Market estimates vary by source, but Fortune Business Insights places the market at USD 3.57 billion in 2025 and USD 3.79 billion in 2026. Global Market Insights uses a 2023 value above USD 2.9 billion, while MarketsandMarkets uses a more conservative USD 2.0 billion 2023 base.
- What is the expected growth rate of the transformer oil market?
Published and calculated forecast paths generally point to mid-single-digit growth. The Fortune series implies about 6.4% growth through 2034, while MarketsandMarkets lists a 5.9% CAGR to 2030.
- Which region leads transformer oil demand?
Asia-Pacific is the strongest regional demand center. GMI Asia-Pacific tracks the region at about USD 1.2 billion in 2023 and near USD 2.2 billion by 2032.
- Why is Asia-Pacific important for transformer oil?
Asia-Pacific combines grid expansion, industrial growth, renewable-energy additions, distribution-network development, and transformer manufacturing scale. China and India are especially important because their silicone-based transformer oil CAGR signals are 9.7% and 9.0%, respectively.
- Which oil type dominates the transformer oil market?
Mineral oil remains the volume backbone because it is cost-effective, familiar, and widely used across power and distribution transformers. The growth story is broader, however, because silicone and bio-based fluids are expanding in safety-sensitive and sustainability-focused applications.
- What is silicone transformer oil used for?
Silicone transformer oil is used where fire safety, high-temperature stability, indoor location, dense urban infrastructure, or reliability requirements matter. The silicone-based transformer oil market is forecast above USD 1.36 billion by 2035.
- Why are bio-based transformer oils growing?
Bio-based oils are growing because utilities and industrial buyers are paying more attention to environmental risk, biodegradability, sustainability goals, and fire safety. The bio-based transformer oil market is forecast from USD 0.1678 billion in 2025 to USD 0.3523 billion by 2035.
- How do transformer shortages affect transformer oil demand?
Transformer shortages can increase the importance of oil testing, filtration, reclamation, and life-extension programs. When large power transformer lead times reach 4 years and prices rise 80%, maintaining existing units becomes more valuable.
- Which countries should be watched most closely?
China, India, the United States, Germany, the United Kingdom, Brazil, Saudi Arabia, and the UAE are useful watch markets. They represent a mix of grid expansion, industrial load, renewable integration, transformer replacement, and sustainability-led fluid demand.
- What metrics matter most for transformer oil suppliers?
Suppliers should track global market size, regional growth, oil-type CAGR, transformer orders, grid investment, country-level power demand, transformer lead times, oil testing demand, and sustainability-related fluid adoption.
Final Takeaway
Transformer oil market growth is being shaped by grid expansion, transformer replacement, renewable-energy interconnection, industrial electrification, and safer fluid selection. Mineral oil remains the volume backbone because it is cost-effective, familiar, and deeply tied to the installed transformer base. Silicone and bio-based fluids are smaller but strategically important where fire safety, environmental risk, and high-temperature performance matter.
The most useful market view separates demand by oil type, transformer type, application, region, and country-level infrastructure signal. Asia-Pacific carries the strongest expansion story, North America carries replacement and shortage pressure, Europe carries modernization and sustainability demand, and emerging regions connect transformer oil demand to new power infrastructure.
For suppliers, utilities, transformer manufacturers, and investors, the practical goal is not to quote one global CAGR. The stronger approach is to track where transformers are being built, where aging fleets need life extension, where renewable projects require grid connection, and where safety or environmental rules change fluid choice.