Food allergen testing has moved from a specialist laboratory function into a mainstream food safety, label-control, and export-compliance requirement. The market is shaped by food allergy prevalence, stricter allergen declaration rules, undeclared allergen recalls, more complex processed foods, rapid test adoption, and the need to validate free-from claims across global supply chains.
The strongest market signal is that allergen testing operates at the intersection of regulation and consumer protection. Global estimates place the food allergen testing market anywhere from USD 833 million to USD 1.7 billion in 2024, depending on methodology, while forecast CAGRs commonly sit in the 6% to 8% range. That range is useful because it shows a market with enough regulatory demand to be stable and enough technology adoption to keep expanding.
This article reviews the numbers through the same lens a food manufacturer, lab network, retailer, or export compliance team would use: market size, testing technology, allergens, food categories, regulations, recall signals, regions, country-level rules, delivery models, growth drivers, risk factors, metrics, and operating frameworks.
Executive Food Allergen Testing Market Benchmarks
The numbers that define the market
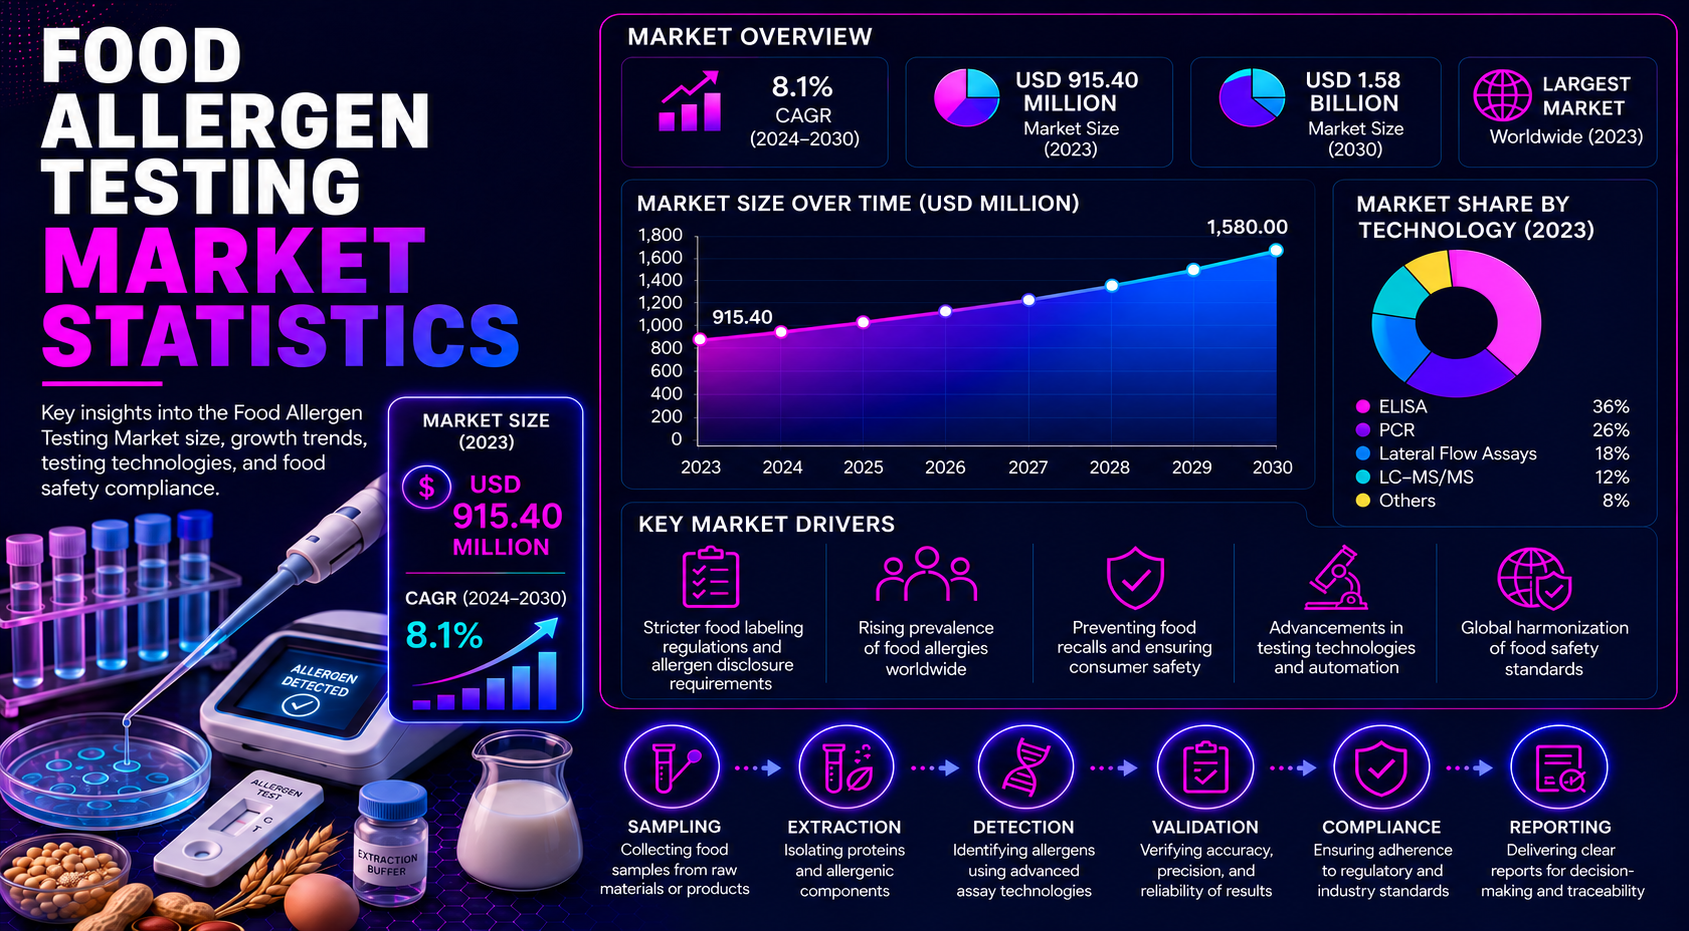
- Strategic Market Research placed the food allergen testing market at USD 1.7 billion in 2024 with an 8.1% CAGR through 2030.
- Future Market Insights reported a 2025 market value of USD 970.3 million and a 2035 forecast of USD 2,062.6 million.
- Market.us estimated the market at USD 833 million in 2024 and USD 1,717 million by 2034.
- Research and Markets / TechSci reported a 2024 market value of USD 0.81 billion and a 2030 forecast of USD 1.14 billion.
- ELISA and immunoassay methods hold a 67.8% benchmark share in the testing technology mix.
- PCR-based testing is benchmarked at 35.4%, reflecting the role of DNA-based verification in specific workflows.
- Milk allergen testing accounts for a 32.7% benchmark share among allergen targets in the available dataset.
- Bakery and confectionery represents a 29.4% testing/application benchmark because shared lines and multi-ingredient recipes raise cross-contact risk.
- Processed foods carry a 28% application benchmark, showing how complex ingredients push routine testing demand.
- The U.S. major allergen list expanded to 9 with sesame under the FASTER Act.
- The EU and UK allergen-declaration framework covers 14 allergen groups that require clear consumer information.
- Canada tracks 11 priority allergen categories and sulphites at a 10 ppm declaration benchmark.
- North America’s 2025 market estimate reaches USD 310.5 million in the workbook model.
- Europe’s 2025 market estimate reaches USD 281.4 million, while Asia-Pacific reaches USD 232.9 million.
- UK allergen incidents fell from 299 in 2023 to 267 in 2024, but the volume still shows persistent operating risk.
Food allergen testing market readout
Food allergen testing is best read as a compliance market and a prevention market at the same time. Testing demand grows when regulated allergens, complex manufacturing lines, retailer standards, export rules, and recall risk converge into one operational problem.
Why Food Allergen Testing Carries Market and Compliance Stakes
Food allergen testing matters because the error is rarely abstract. A missed allergen can become a mislabeled product, a consumer reaction, a retailer withdrawal, a border rejection, or a public recall. That is why the market is tied to the everyday controls inside food plants: raw-material approval, rework control, line clearance, sanitation validation, packaging checks, and final label review.
Market growth also reflects a change in how companies prove control. Food manufacturers once relied heavily on labels, supplier certificates, and cleaning procedures. Those controls still matter, but testing provides evidence that a process worked. Rapid tests support production decisions, ELISA supports routine laboratory confirmation, PCR supports target-specific checks, and LC-MS/MS supports more advanced multi-allergen workflows.
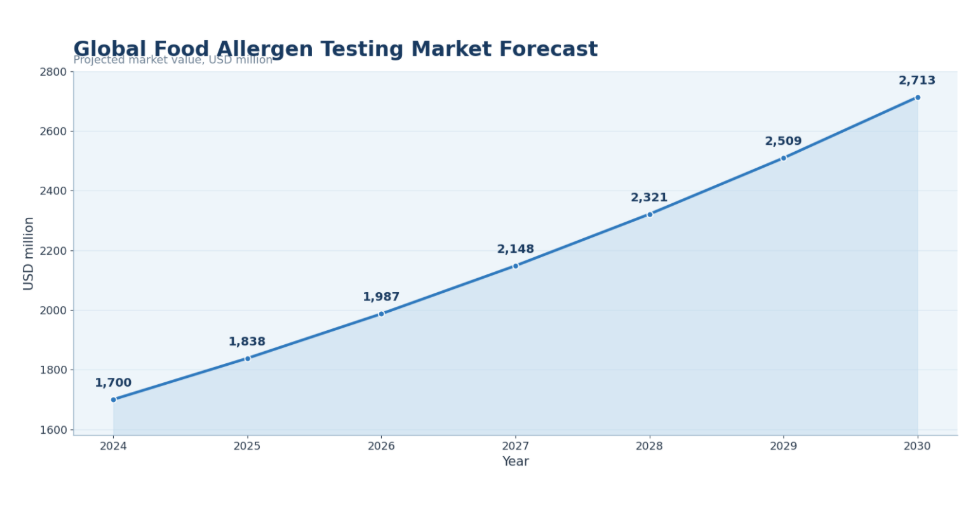
Figure 1. Market forecasts show steady growth as allergen controls become routine food-safety practice.
Food Allergen Testing Market Signal Map
| Signal | Benchmark | Why it matters |
|---|---|---|
| Market value | USD 833 million to USD 1.7 billion in 2024 | A measurable safety and compliance market |
| Forecast growth | 6.02% to 8.37% CAGR range | Sustained testing adoption |
| Technology mix | 67.8% ELISA / immunoassay benchmark | Routine lab-method strength |
| Allergen coverage | 9 U.S. major allergens and 14 EU/UK allergen groups | Shows regulation-led demand |
| Recall signal | 267 UK allergen incidents in 2024 | Continuing operational risk |
Compliance readout
The market grows when testing becomes documentation, not only detection. Companies need evidence that labels, sanitation, suppliers, and cross-contact controls work in real production conditions.
Global Food Allergen Testing Market Size Statistics
Global market estimates vary because research firms define the category differently. Some include only laboratory testing services, some include test kits, some include rapid tests, and some build wider food-safety testing revenue models. That is why the best article does not use one number alone. It compares the range and then explains what each number signals.
- The Strategic Market Research baseline of USD 1.7 billion in 2024 produces a derived 2030 value of USD 2,712.7 million at 8.1% CAGR.
- Future Market Insights uses a smaller 2025 baseline of USD 970.3 million but reaches USD 2,062.6 million by 2035.
- Spherical Insights projects a 2033 market value of USD 1,874.6 million at 8.37% CAGR.
- Research and Markets / TechSci estimates USD 0.81 billion in 2024 and USD 1.14 billion by 2030.
- Market.us estimates USD 833 million in 2024 and USD 1,717 million by 2034.
- Persistence Market Research places the 2026 market near USD 1.2 billion and the 2033 forecast near USD 2.0 billion.
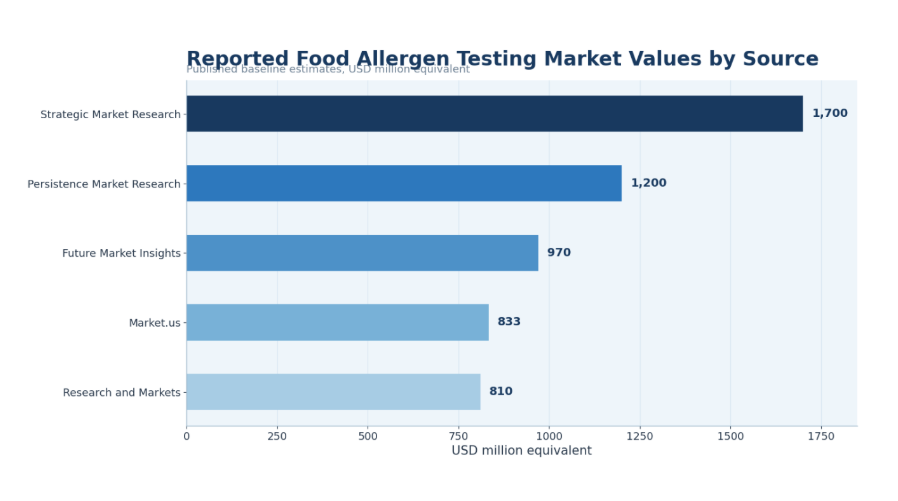
Figure 2. Market estimates vary by scope, but still point toward steady testing demand.
Global Market-Size Snapshot
| Source view | Base value | Forecast / CAGR |
|---|---|---|
| Strategic Market Research | USD 1.7 billion in 2024 | 8.1% CAGR to 2030 |
| Future Market Insights | USD 970.3 million in 2025 | USD 2,062.6 million by 2035 |
| Spherical Insights | Forecast model | USD 1,874.6 million by 2033 |
| Research and Markets / TechSci | USD 0.81 billion in 2024 | USD 1.14 billion by 2030 |
| Market.us | USD 833 million in 2024 | USD 1,717 million by 2034 |
Market-size readout
The market-size range should not be treated as a conflict. It shows that allergen testing can be counted as services, kits, methods, or wider food-safety testing spend. The growth direction is the more important signal.
Food Allergy and Consumer-Safety Statistics
Consumer-safety statistics explain why allergen testing receives budget attention. Allergen risk is not limited to shoppers who make special dietary choices. It affects children, adults, schools, retailers, foodservice locations, importers, and packaged-food brands. Accurate allergen declarations become a lifeline for consumers who depend on labels to avoid exposure.
- EU estimates in the workbook place food allergy at 1% of the population, equal to about 4.5 million people.
- The same dataset indicates that 75% of child allergic reactions are linked to egg, peanut, cow’s milk, fish, and nuts.
- For adults, 50% of allergic reactions are linked to fruits, vegetables, nuts, and peanuts.
- The United Kingdom benchmark shows 6% of adults with clinically confirmed food allergy, or 2.4 million adults.
- Greater Manchester survey context shows 30% of adults reporting an adverse reaction to food.
- The U.S. adult food allergy benchmark in the workbook is 7%, showing large-scale consumer exposure.
- Food allergy data included from FARE notes a 50% increase in U.S. child food allergy prevalence across earlier tracking periods.
Consumer-Safety and Testing Relevance
| Consumer signal | Benchmark | Testing relevance |
|---|---|---|
| EU food allergy estimate | 1% or 4.5 million people | Supports accurate label verification |
| UK clinically confirmed adult allergy | 6% or 2.4 million adults | Raises retailer and foodservice scrutiny |
| Child reaction concentration | 75% linked to key allergens | Supports target prioritization |
| Adult reaction pattern | 50% linked to fruits, vegetables, nuts, peanuts | Different adult risk profile |
| U.S. adult food allergy benchmark | 7% | Shows broad consumer exposure |
Consumer-safety readout
Testing is not the whole protection system, but it is a critical verification layer. It helps confirm that ingredient controls, cleaning processes, and label declarations are aligned with the real risk to consumers.
Food Allergen Testing Technology Statistics
Technology choice is one of the most important market splits because different methods answer different operating questions. A factory may need a lateral flow strip to release a cleaned line quickly, an ELISA method for routine quantification, PCR for DNA-based verification, or LC-MS/MS when a lab needs advanced confirmation. No single method solves every allergen-control problem.
- ELISA / immunoassay methods carry a 67.8% benchmark in the workbook, making them the dominant routine testing signal.
- PCR-based testing carries a 35.4% benchmark and is important when DNA-based target verification is useful.
- LC-MS/MS is tracked as an advanced technology category for confirmatory and multi-analyte laboratory work.
- Lateral flow devices are tracked as a practical rapid-testing category for on-site checks and line decisions.
- Biosensors are tracked as an emerging rapid-detection category for future near-site workflows.
- Next-generation sequencing is included as a future-facing technology category, although it remains less common in routine allergen programs.
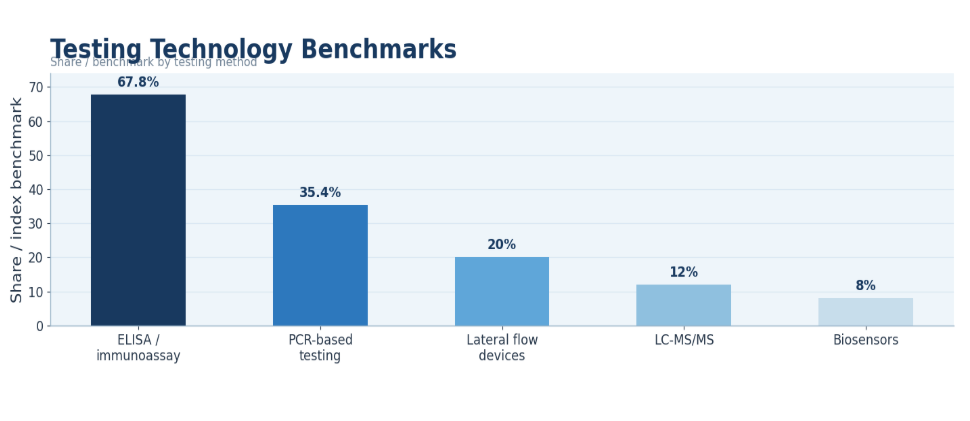
Figure 3. ELISA leads routine testing while rapid and confirmatory methods widen workflow coverage.
Food Allergen Testing Technology Diagnostic
| Technology | Best use case | Market role |
|---|---|---|
| ELISA / immunoassay | Routine protein detection | Core lab workflow and broad adoption |
| PCR | DNA-based target verification | Useful for processed foods and species-linked checks |
| LC-MS/MS | Confirmatory multi-allergen analysis | Advanced lab capability |
| Lateral flow | Rapid line and cleaning checks | Operational decision support |
| Biosensors | Near-site rapid detection | Emerging innovation category |
| Multiplex tests | Multiple allergens in one workflow | Efficiency and broader panel coverage |
Technology readout
The market is not moving from one method to another in a simple sequence. Mature allergen programs combine methods based on product matrix, risk level, turnaround time, documentation needs, and cost per decision.
Major Allergen Target Statistics
Allergen-target statistics show where testing demand becomes specific. Milk, egg, peanut, tree nuts, wheat/gluten, soy, sesame, fish, crustacean shellfish, mustard, celery, lupin, and sulphites do not behave the same way in food systems. Some are high-severity consumer risks, some are hidden ingredients, some appear through cross-contact, and some have clear threshold or declaration rules.
- Milk testing has a 32.7% benchmark share among allergen targets and a USD 272.4 million revenue estimate in the workbook.
- Milk also appears in 536 RASFF notification benchmarks across the available historical allergen target dataset.
- Wheat/gluten appears in 290 RASFF notification benchmarks, showing strong relevance for gluten-free and label verification.
- Soy appears in 247 RASFF notification benchmarks and remains important in sauces, processed foods, and meat alternatives.
- Peanut appears in 199 RASFF notification benchmarks, reflecting a high-severity and high-attention allergen target.
- Egg appears in 195 RASFF notification benchmarks and is common in bakery, pasta, dressings, and prepared foods.
- Sesame became the 9th major allergen in the U.S., expanding testing and label-control demand.
Major Allergen Target Map
| Allergen target | Risk pattern | Testing importance |
|---|---|---|
| Milk | Bakery, chocolate, sauces, snacks | High recall and cross-contact relevance |
| Wheat / gluten | Bakery, cereals, processed foods | Key allergen and claim-verification area |
| Soy | Sauces, processed foods, meat alternatives | Common ingredient and hidden-source risk |
| Peanut | Snacks, confectionery, bakery | High-severity consumer concern |
| Egg | Bakery, pasta, dressings | Common formulation and processing risk |
| Sesame | Bakery, spreads, sauces, toppings | Expanded U.S. major-allergen relevance |
| Sulphites | Drinks, dried fruit, processed foods | Threshold and declaration relevance |
Allergen-target readout
Testing demand grows fastest when an allergen becomes a regulatory issue, a consumer-trust issue, and an operational cross-contact issue at the same time.
Food Category Testing Statistics
Food-category data explains where allergen testing is most practical. High-risk categories are usually not risky because of one ingredient alone. Risk rises when products contain many inputs, run on shared lines, use rework, change packaging frequently, or carry free-from claims that must be verified.
- Bakery and confectionery carries a 29.4% application benchmark in the workbook.
- Processed foods carry a 28% application benchmark because complex recipes and supplier networks increase hidden allergen risk.
- Dairy products are tracked as a major application area because milk proteins are both ingredients and allergen targets.
- Meat and seafood processing is tracked as a category because ingredient systems, marinades, and shared lines can introduce allergen exposure.
- Infant foods are tracked as a category because vulnerable-consumer and label-trust issues are especially high.
- Cocoa, coffee, and tea show a 209 RASFF notification benchmark in the workbook category dataset.
- Sauces and condiments show a 215 RASFF notification benchmark and often include hidden ingredients, sulphites, mustard, soy, or milk derivatives.
Food Category Testing Diagnostic
| Food category | Allergen risk pattern | Why testing matters |
|---|---|---|
| Bakery and confectionery | Multiple ingredients and shared equipment | High cross-contact potential |
| Processed foods | Complex recipes and many suppliers | Higher hidden-allergen risk |
| Dairy products | Milk protein verification | Core allergen and label issue |
| Sauces and condiments | Hidden ingredients and reformulation | Important for label accuracy |
| Snacks and ready meals | Shared lines and flavorings | Cross-contact and recall relevance |
Food-category readout
The strongest testing demand appears where recipe complexity, shared production, and consumer claims overlap. Those are the places where one labeling error can become a recall.
Regulatory and Labelling Statistics
Regulation is one of the clearest demand drivers for allergen testing because every market defines allergen risk in a specific way. A product that is compliant in one country may need additional label controls, test documentation, or allergen declarations in another. Exporters therefore need country-specific allergen governance rather than a single global checklist.
- The U.S. major allergen list includes 9 allergens after sesame became a major food allergen.
- The U.S. FALCPA framework identified 8 major allergens before the FASTER Act sesame expansion.
- The EU Annex II framework requires declaration of 14 allergen groups.
- The United Kingdom uses 14 EU-style allergen groups for food information requirements.
- Canada tracks 11 priority allergen categories and uses a 10 ppm benchmark for sulphites declaration.
- Australia/New Zealand Plain English Allergen Labelling implementation is benchmarked to 2024, with sell-through context into 2026.
- Japan maintains required and recommended allergen labeling categories, creating a country-specific compliance workflow.
- Codex / FAO / WHO allergen work supports global discussion around risk assessment and harmonization.
Country and Region Allergen Labelling Snapshot
| Market | Regulatory signal | Testing implication |
|---|---|---|
| United States | 9 major allergens including sesame | Supports label and cross-contact verification |
| European Union | 14 regulated allergen groups | Requires broad multi-allergen control |
| United Kingdom | 14 allergen groups and strong label scrutiny | Raises retailer and foodservice pressure |
| Canada | 11 priority allergen categories and 10 ppm sulphites benchmark | Supports packaged-food compliance |
| Australia/New Zealand | Plain English Allergen Labelling | Drives clearer declarations and verification |
| Japan | Required and recommended allergen categories | Requires market-specific review |
| Codex / FAO / WHO | Global allergen risk-assessment work | Supports harmonization discussions |
Regulatory readout
Regulation turns testing into a market access tool. Companies test not only because allergens are dangerous, but because labels, import rules, retailer policies, and consumer transparency requirements demand proof of control.
Food Allergen Recall and Incident Statistics
Recall and incident data are important because they show where allergen controls break down. Many failures are not caused by a missing lab test alone. They begin with an ingredient change, rework error, wrong packaging, incomplete label approval, shared-line residue, or a supplier update that does not reach the label team.
- UK allergen incidents rose from 240 in 2020 to 272 in 2021 and 322 in 2022.
- UK allergen incidents then moved to 299 in 2023 and 267 in 2024.
- The 2024 UK benchmark represented an 11% decrease from 2023, but incident levels remained material.
- Food Standards Scotland allergen incidents increased from 18 in 2023 to 30 in 2024 in the workbook dataset.
- Wrong packaging, undeclared allergens, supplier ingredient changes, rework, and cross-contact are recurring operational causes.
- RASFF category benchmarks show sauces and condiments at 215 notifications and cocoa, coffee, and tea at 209 notifications in the workbook data.
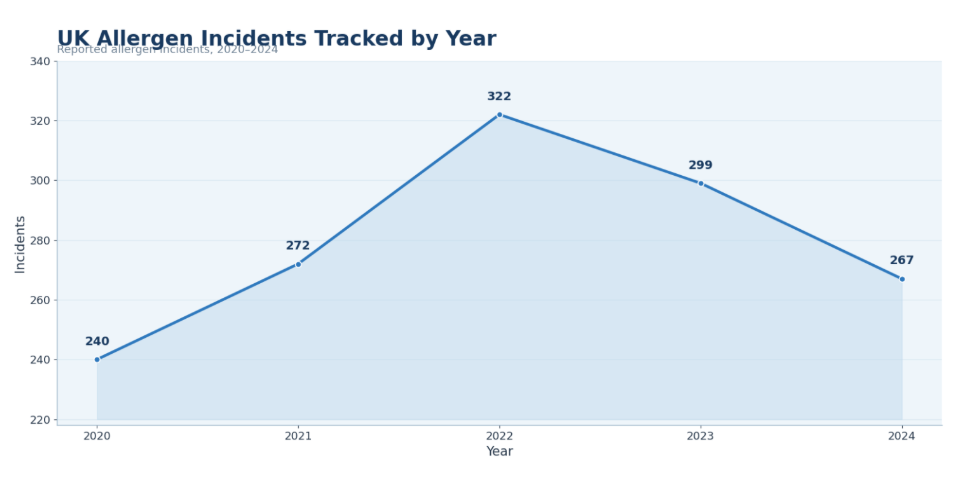
Figure 4. UK incident data shows why allergen testing must be connected to packaging, labeling, supplier, and cleaning controls.
Food Allergen Recall Diagnostic
| Recall driver | What usually happens | Testing / control response |
|---|---|---|
| Undeclared allergen | Allergen not listed on label | Label review and verification testing |
| Wrong packaging | Product placed in incorrect pack | Packaging-line checks and final verification |
| Cross-contact | Allergen residue reaches another product | Cleaning validation and swabbing |
| Supplier change | Ingredient profile changes | Supplier approval and certificate review |
| Rework risk | Allergen-containing rework misused | Batch controls and allergen mapping |
| Precautionary gap | Risk not controlled or declared | Risk assessment and testing support |
Recall readout
The best allergen programs treat testing as one part of a closed loop. The loop includes specifications, suppliers, production scheduling, line clearance, cleaning, labeling, packaging, and corrective action.
Regional Food Allergen Testing Market Statistics
Regional market statistics show that allergen testing demand is global, but the reasons differ by geography. North America is led by regulation, recalls, litigation risk, and large processed-food manufacturers. Europe is shaped by a broad allergen-declaration framework and retailer compliance. Asia-Pacific is driven by processed food growth, export activity, and regulatory modernization.
- North America’s 2025 food allergen testing market estimate is USD 310.5 million.
- Europe’s 2025 estimate is USD 281.4 million, reflecting mature regulation and multi-allergen compliance needs.
- Asia-Pacific’s 2025 estimate is USD 232.9 million and represents one of the strongest long-term adoption opportunities.
- Latin America’s 2025 estimate is USD 77.6 million, with demand linked to exports and packaged-food growth.
- Middle East and Africa’s 2025 estimate is USD 67.9 million, shaped by import reliance and food-safety modernization.
- North America, Europe, and Asia-Pacific together account for most modeled 2025 demand in the workbook regional estimate.
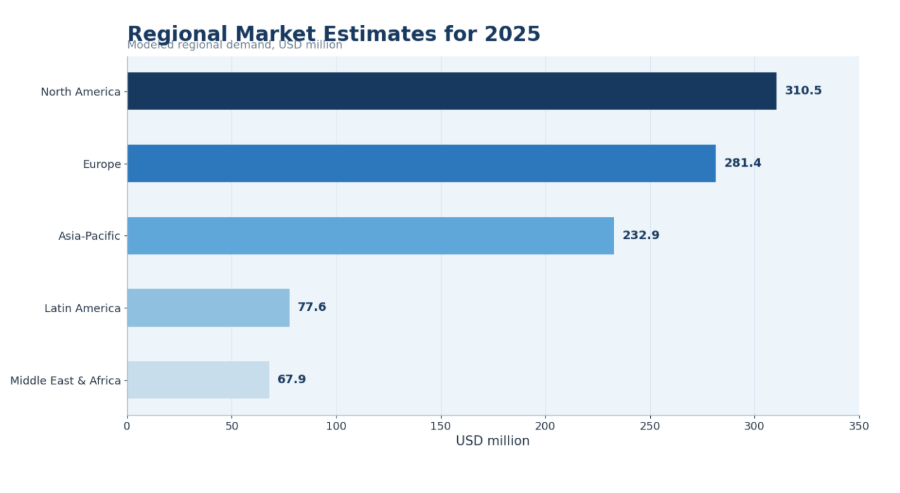
Figure 5. Regional estimates show mature demand in North America and Europe, with Asia-Pacific building a larger testing opportunity.
Regional Food Allergen Testing Market Snapshot
| Region | 2025 estimate | Article interpretation |
|---|---|---|
| North America | USD 310.5 million | Mature testing demand tied to regulation and recalls |
| Europe | USD 281.4 million | High compliance and multi-allergen testing need |
| Asia-Pacific | USD 232.9 million | Fast adoption opportunity from processing and exports |
| Latin America | USD 77.6 million | Testing demand tied to trade and regulation |
| Middle East & Africa | USD 67.9 million | Emerging compliance and import-control opportunity |
Regional readout
The regional market should not be ranked only by revenue. The more useful view is maturity: North America and Europe are mature compliance markets, while Asia-Pacific, Latin America, and MEA carry more modernization and export-driven growth potential.
Country-Level Food Allergen Testing Intelligence
Country-level statistics matter because allergen testing programs are implemented locally. A global food brand may have a corporate allergen-control policy, but it still needs market-specific labels, declarations, claims, supplier documents, and risk assessments. Country data also reveals where demand is larger because the food industry, regulatory system, or export base is larger.
- The United States has a 2025 country demand estimate of USD 217.3 million.
- Canada has a 2025 estimate of USD 37.3 million, supported by 11 priority allergen categories.
- Germany’s 2025 estimate is USD 50.6 million, the largest European country benchmark in the workbook subset.
- The United Kingdom’s 2025 estimate is USD 45 million and is supported by high allergy-alert visibility.
- France has a 2025 estimate of USD 36.6 million, while Italy is estimated at USD 28.1 million.
- China’s 2025 estimate is USD 58.2 million, reflecting a large processed-food and export base.
- Japan’s 2025 estimate is USD 34.9 million and sits inside a country-specific allergen labeling framework.
- Australia’s estimate is USD 27.9 million, supported by strong allergen labeling clarity and recall visibility.
Country-Level Allergen Testing Intelligence
| Country | 2025 estimate / signal | Why it matters |
|---|---|---|
| United States | USD 217.3 million; 9 major allergens | Largest country demand benchmark |
| Canada | USD 37.3 million; 11 priority categories | Strong packaged-food compliance need |
| Germany | USD 50.6 million | Large EU food industry and lab demand |
| United Kingdom | USD 45.0 million | Strong labeling and allergy alert visibility |
| China | USD 58.2 million | Large processed-food and export base |
| Japan | USD 34.9 million | Country-specific allergen categories |
| Australia | USD 27.9 million | Strong labeling and verification pressure |
Country readout
A global allergen testing strategy must be localized. The allergens, label language, enforcement expectations, and proof requirements change by country, so testing plans need to follow market access risk.
Laboratory Services, Test Kits, and Rapid Testing Statistics
The market is split not only by technology but also by delivery model. Some companies use third-party laboratories for confirmation and documentation. Others run in-house ELISA or rapid testing for routine checks. Many use rapid lateral-flow kits for cleaning validation and environmental swabs because the decision has to happen before a line restarts.
- Third-party laboratory services remain important for confirmatory testing, compliance documentation, and method validation.
- In-house testing supports frequent screening when turnaround time matters more than external certification.
- Rapid lateral-flow kits help operators make immediate decisions on cleaning and line clearance.
- Environmental swabs support shared-line risk control before allergen residues enter finished products.
- Finished-product testing supports release decisions, especially when label claims or high-risk allergens are involved.
- Raw-material testing reduces upstream risk when suppliers change ingredients, processing sites, or specifications.
Food Allergen Testing Delivery Model Comparison
| Testing model | Best fit | Market role |
|---|---|---|
| Third-party lab services | Confirmatory and compliance testing | Strong documentation and expertise |
| In-house lab testing | Frequent routine screening | Faster operating decisions |
| Rapid test kits | Line checks and cleaning validation | Immediate control support |
| Environmental swabs | Shared-line risk | Sanitation verification |
| Finished-product testing | Label and release checks | Consumer safety support |
| Raw-material testing | Supplier verification | Upstream risk reduction |
Testing-delivery readout
Mature companies rarely rely on one testing model. They combine supplier checks, swabs, rapid screens, finished-product testing, and laboratory confirmation so each test answers a specific decision question.
Food Allergen Testing Market Drivers
The market grows when safety, compliance, and commercial access overlap. A company may test allergens to protect consumers, avoid recalls, satisfy retailers, support free-from claims, or access export markets. The same analytical method can therefore serve multiple business goals, which helps explain why demand is more resilient than discretionary testing spend.
- More regulated allergens expand testing panels and increase label-control needs.
- Undeclared allergen recalls push companies toward preventive verification rather than reactive correction.
- Complex supply chains require stronger supplier controls, ingredient checks, and certificate management.
- Processed food growth increases hidden allergen risk because recipes and suppliers change more frequently.
- Free-from, gluten-free, and allergen-free claims require stronger validation than ordinary ingredient lists.
- Export markets require country-specific declarations, documentation, and testing confidence.
- Rapid testing innovation makes routine checks easier to embed into daily manufacturing operations.
- Retailer requirements push suppliers into documented testing and corrective-action programs.
Food Allergen Testing Growth Drivers
| Driver | Why it increases testing demand |
|---|---|
| Regulatory expansion | More allergens and clearer labels require verification |
| Recall prevention | Testing supports prevention before public withdrawal |
| Complex supply chains | Supplier variability requires evidence of control |
| Processed food growth | Hidden ingredients increase risk |
| Free-from claims | Claims require stronger validation |
| Export markets | Country-specific compliance creates testing demand |
| Rapid testing innovation | More decisions can be made near the production line |
Driver readout
The strongest growth drivers are practical. Companies test allergens because it helps them sell safely, protect consumers, keep retailers confident, and avoid expensive disruptions.
Food Allergen Testing Market Challenges and Risks
Testing is powerful, but it can fail if it is used without a good allergen-management system. Sampling error can miss uneven contamination. Matrix interference can affect results. Heat processing can change detectable proteins or DNA. Cross-contact can vary by shift, line, ingredient, and cleaning quality. That is why method validation and risk-based sampling matter.
- Sampling error matters because allergen contamination can be uneven across a batch.
- Matrix interference can change detection performance depending on fat, sugar, protein, and processing conditions.
- Heat processing can alter proteins or DNA and make method selection more important.
- Cross-contact risk changes by line layout, cleaning procedures, scheduling, and rework controls.
- False positives can create unnecessary waste, while false negatives can create serious consumer risk.
- Threshold uncertainty and regulatory differences make global allergen management more complex.
- Testing costs, staff training, and turnaround time affect how widely companies can test.
Food Allergen Testing Risk Diagnostic
| Challenge | Why it matters | Practical response |
|---|---|---|
| Sampling error | Contamination can be uneven | Use risk-based sampling plans |
| Matrix interference | Food composition affects detection | Validate method by product type |
| Heat processing | Proteins and DNA may change | Select suitable methods |
| Cross-contact | Risk varies by line and shift | Combine testing with controls |
| Threshold uncertainty | Rules vary by market | Track regulatory guidance |
| False results | Can create safety or waste issues | Confirm high-risk findings |
Challenge readout
Testing cannot replace allergen control. It works best when the facility already has strong labels, suppliers, cleaning, training, scheduling, and corrective-action discipline.
Food Allergen Testing Market Diagnostic Framework
A practical allergen-testing framework should prevent the article from becoming a list of isolated statistics. Every number should answer one of six questions: what is the market size, where is demand strongest, which allergen matters, which technology fits, what regulation applies, and which operational control can reduce risk.
Food Allergen Testing Diagnostic Framework
| Problem area | Core signals to measure | Useful benchmark type |
|---|---|---|
| Market scale | Market value, CAGR, regional share | Market-size and forecast data |
| Regulation | Allergen lists, label rules, enforcement | Country compliance data |
| Consumer risk | Allergy prevalence and severe reactions | Public health data |
| Recall risk | Undeclared allergen incidents | Recall and alert data |
| Technology | ELISA, PCR, LC-MS/MS, rapid tests | Method adoption data |
| Food category | Bakery, dairy, snacks, processed foods | Application data |
| Operations | Swabs, cleaning validation, supplier checks | Internal QA data |
Diagnostic interpretation
The framework keeps statistics connected to decisions. A market number explains scale, a recall number explains risk, a regulatory number explains obligation, and a technology number explains how the testing decision is made.
90-Day Food Allergen Testing Benchmark Plan
A 90-day plan should start with visibility, not testing volume. The first task is to map allergens by ingredient, supplier, product, line, cleaning method, and label. Once the risk map is clear, the company can compare methods, frequency, documentation gaps, and country compliance requirements.
90-Day Food Allergen Testing Benchmark Plan
| Timing | What to do | Output |
|---|---|---|
| Days 1–30 | Build baseline for allergens, products, suppliers, recalls, and methods | Allergen risk map |
| Days 31–60 | Compare testing frequency, technology choice, cleaning validation, and label controls | Testing improvement scorecard |
| Days 61–90 | Review country rules, export needs, rapid testing gaps, and recall-prevention metrics | Allergen testing governance plan |
Planning principle
The best allergen testing programs do not chase every test. They test where results can prevent a real safety, compliance, or market-access failure.
Metrics Food Safety Leaders Should Track
Food safety leaders should track metrics that connect testing to risk reduction. A large testing budget does not automatically mean a safer program. The better measure is whether failed tests, swabs, label errors, supplier changes, and corrective actions are identified early enough to prevent consumer exposure or product withdrawal.
- Track allergen test pass/fail rate by product, line, allergen, and supplier.
- Track environmental swab results and cleaning validation pass rate after allergen runs.
- Track finished-product test results for claim verification and high-risk SKUs.
- Track raw-material supplier compliance, certificate accuracy, and specification updates.
- Track label review completion, packaging verification errors, and artwork-change controls.
- Track allergen-related complaints, near-miss incidents, and corrective-action closure time.
- Track test turnaround time, cost per test, and the share of results linked to a documented decision.
- Track country-label compliance coverage for products sold across multiple markets.
Food Allergen Testing Metrics Scorecard
| Metric | Why it matters |
|---|---|
| Allergen test pass/fail rate | Whether product and line controls are stable |
| Environmental swab results | Sanitation and shared-line risk |
| Finished-product testing | Supports release and claim verification |
| Supplier compliance | Reduces upstream formulation risk |
| Label review completion | Prevents undeclared allergen failures |
| Packaging verification errors | Controls wrong-pack recall risk |
| Corrective action closure time | Shows speed of risk resolution |
| Country-label compliance coverage | Supports export and multi-market sales |
Supplier, Manufacturing, and Line-Control Statistics
Supplier control is where many allergen-testing programs begin because the plant cannot control a risk it has not identified in the ingredient specification. A supplier may change a seasoning, carrier, processing aid, flavor system, or shared manufacturing site without the operational team immediately seeing how that change affects the label. Testing supports supplier governance when certificates, questionnaires, and specification documents are not enough to answer the risk question.
In a reference-style market article, supplier data should be interpreted as a demand driver. More global ingredient sourcing, more private-label manufacturing, more co-packing, and more reformulation create more places where allergen information can break down. That is why allergen testing demand is not limited to finished-product release. It also appears in raw materials, supplier qualification, change control, and incoming ingredient verification.
- Raw-material testing reduces upstream risk before the ingredient reaches a shared production line.
- Supplier documentation supports compliance, but testing verifies whether the declared risk matches the material received.
- Specification changes, flavor reformulation, and substituted ingredients can create hidden allergen exposure.
- Co-manufacturing and private-label production increase the need for standardized allergen evidence across sites.
- Supplier approval programs should track ingredient-level allergens, cross-contact statements, and certificate renewal dates.
- High-risk suppliers should be benchmarked by corrective-action history, test failures, and change-notification discipline.
Supplier and Manufacturing Control Map
| Control point | Testing role | Why it matters |
|---|---|---|
| Incoming ingredients | Raw-material verification | Reduces upstream allergen surprises |
| Supplier approval | Risk-based documentation review | Links purchasing to food safety |
| Co-manufacturing | Standardized test evidence | Improves control across sites |
| Change control | Retesting after formulation changes | Prevents label mismatch |
| Rework management | Batch and allergen mapping | Limits accidental cross-contact |
| Shared lines | Environmental swabs and cleaning checks | Verifies sanitation before restart |
Supplier-control readout
Allergen testing becomes more valuable when it is connected to supplier governance. The strongest programs do not wait for a finished-product failure; they test and verify the risk before production begins.
Packaging, Labeling, and Claim-Verification Statistics
Packaging and label controls deserve their own market lens because many allergen recalls are label failures rather than ingredient failures. A product may contain the right ingredients, pass the right process checks, and still create risk if it enters the wrong package or uses outdated artwork. Testing cannot fix a label-control failure by itself, but it can support a verification system that catches mismatches before the product reaches consumers.
This is especially important for free-from and gluten-free products. A standard allergen declaration tells consumers what is present, but a free-from claim tells consumers what should not be present. That changes the evidence burden. The company must prove that raw materials, line cleaning, environmental controls, and finished-product results support the claim. For that reason, the testing market benefits from the growth of free-from products, plant-based reformulation, premium health-positioned foods, and retailer claim-verification programs.
- Wrong packaging is a high-impact allergen control failure because the label no longer matches the food inside the pack.
- Artwork approval should be benchmarked alongside laboratory testing because both protect the consumer-facing declaration.
- Free-from claims require stronger evidence than ordinary ingredient lists because they communicate absence to high-risk consumers.
- Plant-based foods can introduce soy, wheat, nuts, pea proteins, and other emerging formulation risks.
- Retailer private-label programs often require documented allergen controls before suppliers can maintain listing status.
- Label review completion, packaging verification errors, and claim-validation tests should be tracked as linked metrics.
Label and Claim Verification Diagnostic
| Control point | Testing role | Why it matters |
|---|---|---|
| Incoming ingredients | Raw-material verification | Reduces upstream allergen surprises |
| Supplier approval | Risk-based documentation review | Links purchasing to food safety |
| Co-manufacturing | Standardized test evidence | Improves control across sites |
| Change control | Retesting after formulation changes | Prevents label mismatch |
| Rework management | Batch and allergen mapping | Limits accidental cross-contact |
| Shared lines | Environmental swabs and cleaning checks | Verifies sanitation before restart |
Label-control readout
The label is the consumer-facing endpoint of the allergen-control system. Testing supports that endpoint, but packaging verification, artwork approval, and claim governance decide whether the result becomes consumer protection.
Export, Retailer, and Certification-Driven Testing Statistics
Global trade adds another layer to allergen testing demand. Exporters must understand destination-market allergen lists, language requirements, precautionary labeling norms, documentation expectations, and retailer standards. This is why allergen testing is increasingly connected to market access. A company may not test only because a local rule requires it; it may test because an importer, retailer, certification body, or private-label customer expects documented proof of control.
Certification programs and retailer audits also change the market by making allergen management auditable. Auditors often look for a risk assessment, allergen map, cleaning validation evidence, change-control records, training logs, supplier documents, and corrective actions. Testing results become part of that evidence trail. As a result, demand comes from both regulatory enforcement and commercial pressure.
- Exporters must compare U.S., EU, UK, Canadian, Australian/New Zealand, Japanese, and local market allergen lists before final label approval.
- Retailer standards can require testing or validation even when regulation does not specify a fixed testing frequency.
- Food safety certification programs make allergen management visible during audits and supplier approval.
- Importers often need documentation that supports both ingredient declarations and cross-contact controls.
- Regional differences in allergen lists make multi-market product launches more complex.
- Testing programs should be designed around market access risk, not only plant-level convenience.
Export and Retailer Testing Demand Map
| Demand source | What it requires | Testing impact |
|---|---|---|
| Export markets | Destination-specific allergen declarations | Country-specific verification |
| Retailers | Supplier assurance and claim support | Documented testing evidence |
| Certification audits | Proof of allergen risk control | Cleaning validation and records |
| Importers | Compliance documentation | Finished-product and ingredient checks |
| Private label | Consistent standards across suppliers | Standardized test plans |
| Foodservice customers | Menu and ingredient confidence | Supplier data and verification |
Market-access readout
Allergen testing is becoming a market-access tool. The ability to prove control can determine whether a product clears an audit, enters a retailer, or moves across borders without label or safety issues.
Food Allergen Testing Market Statistics FAQ
Common questions
How large is the food allergen testing market?
Published estimates differ by methodology, but the workbook range shows 2024 market values from USD 833 million to USD 1.7 billion. The difference reflects whether sources include services, kits, rapid tests, or broader testing revenue.
What is driving growth in food allergen testing?
Growth is driven by food allergy prevalence, stricter labeling rules, undeclared allergen recalls, more processed foods, global food trade, free-from claims, retailer standards, and faster testing technologies.
Which food allergens are tested most often?
Milk, egg, peanut, tree nuts, wheat/gluten, soy, sesame, sulphites, fish, and crustacean shellfish are important targets. The workbook shows milk with a 32.7% benchmark share and strong historical notification relevance.
What technologies are used for food allergen testing?
ELISA / immunoassay, PCR, LC-MS/MS, lateral flow devices, biosensors, and multiplex tests are used. ELISA is the strongest routine benchmark, while rapid tests and advanced lab methods support specific decisions.
Why are undeclared allergens a major recall cause?
Undeclared allergens can enter products through wrong labels, wrong packaging, supplier changes, shared equipment, rework, or incomplete cleaning validation. Testing helps verify the controls that prevent these failures.
Which region leads the market?
North America leads the workbook’s 2025 regional estimate at USD 310.5 million, followed by Europe at USD 281.4 million and Asia-Pacific at USD 232.9 million.
How do allergen testing rules differ by country?
The U.S. has 9 major allergens, the EU and UK use 14 allergen groups, Canada tracks 11 priority categories, and Australia/New Zealand uses Plain English Allergen Labelling. Exporters need country-specific controls.
What metrics matter most for an allergen testing program?
The best metrics include test failures, swab results, cleaning validation pass rate, label review completion, packaging errors, supplier compliance, corrective-action closure time, and allergen-related complaints.
Final Takeaway
Food allergen testing market statistics point to one conclusion: allergen testing is now a core food safety, compliance, quality, and consumer-trust function. The market grows because food companies must control allergens across suppliers, raw materials, shared production lines, cleaning procedures, labels, packaging, claims, and export markets.
The strongest allergen testing strategy is not simply to test more. It is to test the right products, in the right locations, with the right method, at the right frequency, and then connect results to supplier control, cleaning validation, line clearance, label approval, and recall prevention.
In a mature program, testing is evidence that allergen risks, labels, suppliers, cleaning, and release decisions are controlled. That is why the strongest market outlook belongs to testing programs that connect lab results with prevention, compliance, and consumer trust.