Food sweeteners sit at the center of packaged food reformulation, beverage innovation, sugar-reduction programs, and ingredient supply planning. The category includes traditional sugar, high-fructose corn syrup, glucose syrup, natural sweeteners, high-intensity sweeteners, polyols, and newer low-calorie systems that help brands balance sweetness with taste, texture, label appeal, regulatory compliance, and cost.
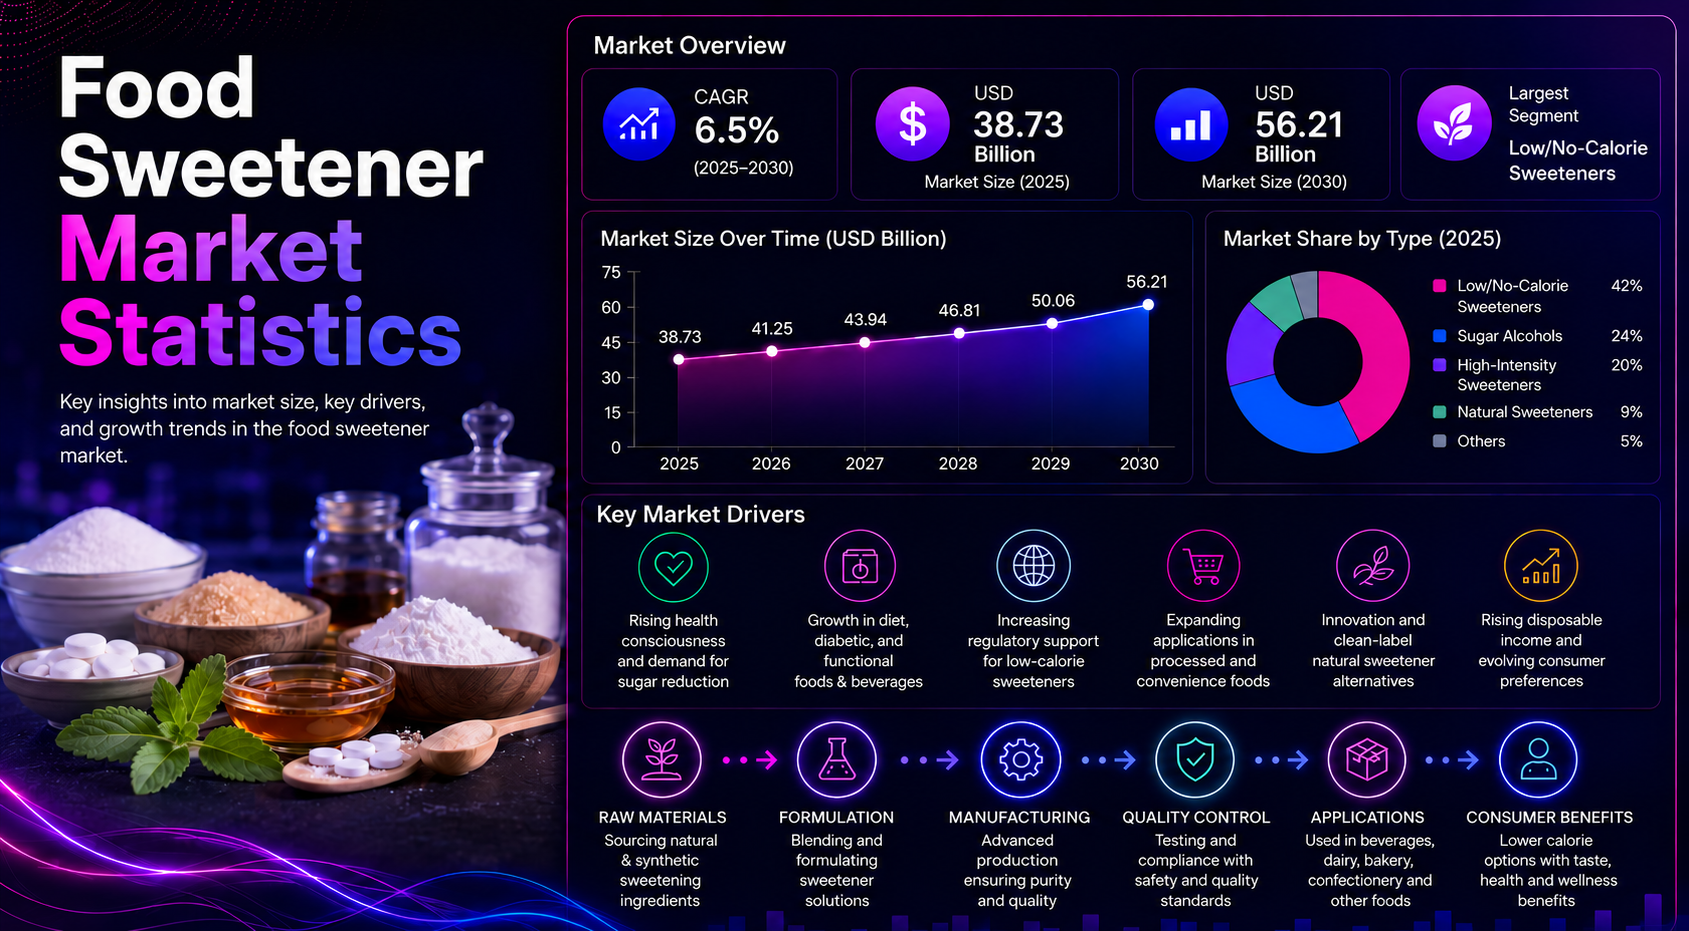
The food sweetener market is expected to reach USD 87.44 billion in 2026 and move toward USD 109.02 billion by 2031, reflecting a 4.51% CAGR across beverage, bakery, confectionery, dairy, sauces, snacks, and packaged-food applications. Broader sweeteners estimates point to USD 89.95 billion in 2025 and USD 126.15 billion by 2033, while natural sweeteners are moving from USD 27.22 billion in 2025 toward USD 49.00 billion by 2034.
Sugar remains the volume anchor, with global production projected near 184.9 million metric tons for 2026/27, but growth is increasingly shaped by zero-sugar beverages, natural labels, diabetes-aware product design, sugar taxes, and consumer demand for products that taste familiar while carrying fewer calories.
Executive Food Sweetener Benchmarks
The numbers that define the food sweetener market
- The food sweetener market is estimated at USD 87.44 billion in 2026, confirming that sweetness remains one of the largest ingredient systems in packaged food and beverage manufacturing.
- The market is forecast to reach USD 109.02 billion by 2031, showing that sweetener demand is still expanding even as brands reduce sugar intensity in many product lines.
- A 4.51% CAGR through 2031 signals steady growth rather than a short reformulation spike, with demand spread across beverages, bakery, confectionery, dairy, and processed foods.
- The broader global sweeteners market is estimated near USD 89.95 billion in 2025 and projected to reach USD 126.15 billion by 2033, showing a wider ingredient base beyond food-only use cases.
- Natural sweeteners are estimated at USD 27.22 billion in 2025 and projected to reach USD 49.00 billion by 2034, showing strong clean-label and plant-based positioning.
- Global sugar production is forecast near 184.9 million metric tons for 2026/27, keeping cane and beet sugar central to commodity supply and industrial formulation.
- Beverages account for roughly 31% of sweetener application demand in the market mix, making drinks the clearest pressure point for sugar reduction.
- Sugar and caloric sweeteners still represent about 42% of estimated sweetener-type demand, showing that bulk, texture, and cost remain important formulation factors.
- High-fructose corn syrup holds an estimated 18% share in the sweetener-type mix, largely because it remains useful in cost-sensitive beverage and processed-food systems.
- Natural sweeteners represent around 16% of the market mix, with stevia, monk fruit, honey, and agave supporting clean-label and reduced-calorie claims.
- High-intensity sweeteners hold around 14% of the mix, with sucralose, aspartame, acesulfame-K, stevia extracts, and blends supporting zero-sugar reformulation.
- Asia-Pacific represents an estimated 36% of sweetener demand in the regional mix, supported by population scale, beverage growth, packaged-food expansion, and sugar production.
- North America accounts for roughly 28% of regional demand, shaped by reduced-sugar beverages, HFCS use, natural sweetener adoption, and active reformulation programs.
- Europe represents about 22% of regional demand, with beet sugar, clean-label expectations, sugar-reduction policy, and regulatory scrutiny shaping sweetener selection.
- Latin America accounts for about 9% of demand in the market mix, but Brazil and Mexico keep the region strategically important for sugar production and beverage reformulation.
- Middle East and Africa represent about 5% of estimated demand, with growth tied to packaged-food penetration, affordability, and imported ingredient availability.
Editorial readout
The sweetener market is no longer only a sugar-volume story. Growth depends on taste, cost, calorie reduction, label claims, supply reliability, public-health pressure, and consumer trust moving in the same direction.
Why Food Sweeteners Now Matter
Sweetener decisions now sit at the intersection of nutrition targets and product experience. A drink, snack, yogurt, sauce, or cereal may need fewer added sugars, but it still has to taste familiar on first purchase and remain stable through storage, distribution, and shelf life. This makes sweetener selection a commercial decision as much as a nutrition decision.
Brands also have to manage different consumer definitions of “better.” Some shoppers prefer natural sweeteners, some want zero sugar, some prioritize low calories, and others focus on recognizable ingredients. The market therefore rewards blended systems that deliver sweetness, texture, and label appeal without forcing a single ingredient to solve every formulation challenge.
Sweeteners are one of the few ingredient categories that influence taste, cost, nutrition positioning, shelf stability, mouthfeel, processing behavior, and consumer acceptance at the same time. A beverage brand can reduce sugar by using high-intensity sweeteners, but the finished product still has to deliver sweetness curve, body, aftertaste control, price discipline, and label clarity.
The same complexity applies to bakery, confectionery, dairy, sauces, and snacks. Sugar contributes sweetness, browning, bulk, homestay, fermentation behavior, and texture. Replacing it requires a system rather than a single ingredient swap, which is why blending strategies now matter more than isolated sweetener choices.
Public-health pressure has accelerated reformulation. Sugar taxes, front-of-pack labels, diabetes concerns, obesity policy, and school nutrition debates push brands toward lower sugar loads. At the same time, shoppers still expect indulgent taste, familiar sweetness, and affordable price points.
Zero-sugar beverage launches continue to make sweetener systems visible because drinks can change consumer calorie exposure quickly.
Clean-label demand gives natural sweeteners a premium role, but taste masking and cost remain barriers.
Bakery and confectionery reformulation remains harder because sugar provides structure, not only sweetness.
Regional regulation changes the addressable market for sweeteners such as allulose, stevia extracts, and monk fruit.
Commodity sugar volatility keeps procurement teams focused on supply risk as much as health positioning.
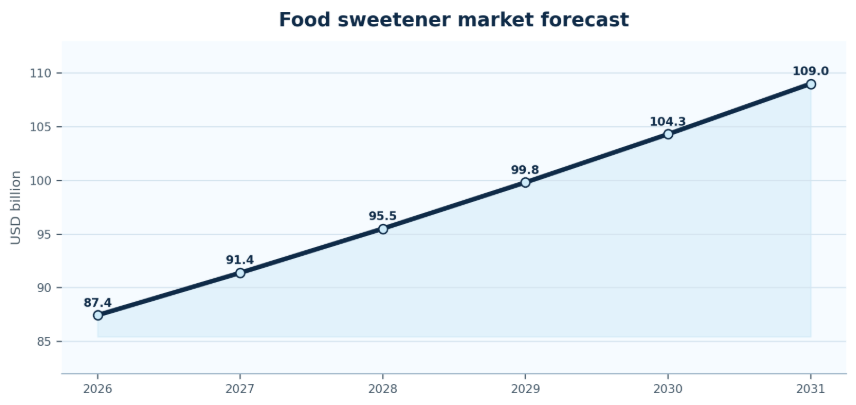
Figure 1. Food sweetener market growth shows steady revenue expansion while reformulation reshapes the mix of sugar, natural alternatives, and low-calorie systems.
Category readout
Sweetener demand is shaped by a three-way tradeoff: product taste, nutrition positioning, and formulation economics. Winning systems solve all three without making labels harder to defend.
Global Food Sweetener Market Size and Forecast
Forecast growth is steady because sweeteners are used across nearly every major packaged-food category. Even modest reformulation across beverages, dairy, bakery, confectionery, sauces, snacks, and functional foods can create large ingredient demand because sweeteners are purchased continuously and reformulated repeatedly.
The strongest growth signals come from segments where sugar reduction is visible to shoppers and measurable on labels. Beverages, sports drinks, dairy products, and snack brands can use sweetener systems to support calorie control, zero-sugar claims, and natural positioning, while bakery and confectionery remain more dependent on bulk and texture performance.
The global market outlook shows a category that is mature by volume but still active by formulation. Market value growth is not driven only by more sugar consumption. It is also driven by premium natural sweeteners, high-intensity blends, low-calorie systems, polyols, and technical support that helps brands maintain taste while changing sugar profiles.
The 2026 to 2031 forecast moves from USD 87.44 billion to USD 109.02 billion. That trajectory gives manufacturers room to serve both traditional caloric sweetener demand and the faster innovation cycle in reduced-sugar products. Beverages carry the most visible reformulation pressure, but bakery, confectionery, and dairy remain important because texture and indulgence are difficult to protect during sugar reduction.
Market-size benchmark snapshot
- The food sweetener market moves from USD 87.44 billion in 2026 toward USD 109.02 billion by 2031, keeping the category in steady expansion mode.
- A 4.51% CAGR shows the market is growing through reformulation and packaged-food volume rather than a single short-term trend.
- The broader sweeteners category is estimated near USD 89.95 billion in 2025 and projected to reach USD 126.15 billion by 2033.
- Natural sweeteners rising from USD 27.22 billion in 2025 toward USD 49.00 billion by 2034 give clean-label sweetening a visible premium lane.
| Market signal | What to measure | Why it matters |
|---|---|---|
| Market size | Global sweetener revenue | Commercial scale |
| CAGR | Forecast growth rate | Momentum |
| Segment mix | Sugar, HFCS, natural, high-intensity | Formulation direction |
| Application mix | Beverage, bakery, dairy, confectionery | Shows end-use opportunity |
| Regulation | Sugar taxes and sweetener approvals | Reformulation pressure |
Market readout
A steady CAGR hides major mix change. Sugar remains the base, but higher-value growth increasingly comes from natural, low-calorie, and blended sweetener systems.
Sugar, HFCS, and Caloric Sweetener Statistics
Caloric sweeteners continue to matter because they deliver more than sweetness. Sugar affects browning, body, crystallization, moisture retention, fermentation, mouthfeel, and perceived indulgence. That is why many product teams reduce sugar gradually or blend sugar with high-intensity sweeteners instead of removing it completely.
HFCS and glucose syrups remain important in industrial food manufacturing because liquid handling, cost, and processing behavior can be more attractive than crystalline sugar in specific applications. These ingredients are especially relevant where manufacturers need consistent sweetness, viscosity control, and predictable large-scale supply.
Commodity exposure makes the traditional sweetener base more volatile than many specialty ingredient categories. Weather patterns, crop yields, energy prices, trade policy, freight costs, and currency shifts can all affect sugar and syrup pricing, which is why procurement teams track production countries as closely as consumer trends.
Traditional caloric sweeteners still carry the largest volume base. Sugar, HFCS, glucose syrup, fructose, and other carbohydrate sweeteners are deeply embedded in beverages, bakery, confectionery, sauces, cereals, and processed foods. Their role is not limited to sweetness; they influence browning, viscosity, fermentation, texture, moisture, and shelf life.
Global sugar output near 184.9 million metric tons for 2026/27 shows the importance of cane and beet supply chains. Brazil, India, China, Thailand, the European Union, and the United States remain key markets because production, exports, domestic consumption, and government policy affect availability and price.
HFCS and glucose syrups continue to matter in applications where cost, liquid handling, sweetness profile, and processing consistency are important. These inputs can face public-health scrutiny, but they remain practical for large-scale industrial production.
Sugar stays central in bakery and confectionery because it contributes bulk, browning, texture, and sweetness in one ingredient.
HFCS remains important in beverages and processed foods because liquid handling and cost control support high-volume production.
Glucose syrup helps confectionery and bakery systems manage texture, crystallization, and shelf stability.
Fructose offers higher relative sweetness, but consumer scrutiny limits how aggressively brands position it.
Commodity exposure means sweetener strategy must track weather, harvests, trade policy, and currency movement.
Caloric sweetener benchmark snapshot
- Global sugar production near 184.9 million metric tons for 2026/27 keeps cane and beet sugar as the market’s volume base.
- Sugar and caloric sweeteners represent about 42% of estimated sweetener-type demand, showing that bulk and texture still matter.
- HFCS holds about 18% of estimated sweetener-type demand because beverage and processed-food systems still value liquid handling and cost control.
- Bakery and confectionery remain the hardest categories to reformulate because sugar supports browning, mouthfeel, crystallization, and shelf stability.
| Caloric sweetener | Main use | Market implication |
|---|---|---|
| Cane sugar | Beverages, bakery, confectionery | Large-volume global base |
| Beet sugar | Europe and temperate markets | Regional production strength |
| HFCS | Beverages and processed foods | Cost-sensitive formulation input |
| Glucose syrup | Confectionery and bakery | Texture and processing value |
| Fructose | Beverages and specialty foods | Sweetness flexibility |
Caloric sweetener readout
Sugar remains the base ingredient, but growth pressure comes from products that need sweetness with fewer calories, cleaner labels, or more controlled glycemic positioning.
Natural Sweetener Market Statistics
Natural sweetener growth is strongest where consumer trust matters as much as calorie reduction. Stevia, monk fruit, honey, agave, maple, and date-based systems can support cleaner label language, but each ingredient brings its own taste curve, cost structure, and formulation limits.
Stevia remains one of the most scalable natural low-calorie options, especially when used in beverages, tabletop sweeteners, and reduced-sugar packaged foods. However, aftertaste control is still central, which encourages blends with sugar, erythritol, allulose, monk fruit, or flavor modulation systems.
Honey, agave, maple syrup, and date syrup are often positioned around natural origin rather than calorie reduction. They are valuable in premium foods, cereals, bakery, snack bars, dairy, and sauces where shoppers accept a more traditional sweetener if the label feels familiar and less processed.
Natural sweeteners have gained market relevance because consumers often want lower-sugar products without synthetic-sounding labels. Stevia, monk fruit, honey, agave, date syrup, coconut sugar, maple syrup, and blended natural systems support products that need sweetness plus recognizable positioning.
The natural sweetener market moving from USD 27.22 billion in 2025 toward USD 49.00 billion by 2034 shows that this segment is no longer a niche. Growth is tied to beverages, tabletop sweeteners, bakery products, breakfast items, dairy alternatives, sports nutrition, and premium packaged foods.
The challenge remains taste and cost. Stevia can bring bitterness or lingering notes. Monk fruit can be expensive. Honey and syrups add calories. Blended systems are therefore common because they allow brands to combine label appeal, sweetness profile, and processing performance.
- Stevia supports natural low-calorie claims and is widely used in beverages, tabletop sweeteners, and reduced-sugar products.
- Monk fruit carries premium positioning because it is plant-derived and used in clean-label reduced-sugar launches.
- Honey remains familiar and trusted, but it does not solve calorie reduction because it is still a caloric sweetener.
- Agave, date syrup, and maple syrup support natural positioning in premium products, but cost and flavor impact limit mass adoption.
- Natural blends help brands reduce aftertaste and improve sweetness curves while protecting clean-label messaging.
Natural sweetener benchmark snapshot
- Natural sweeteners represent about 16% of estimated sweetener-type demand, led by stevia, monk fruit, honey, agave, and natural-positioned blends.
- Stevia remains the most scalable plant-derived low-calorie option for beverages, tabletop sweeteners, and reduced-sugar launches.
- Monk fruit carries premium positioning because it supports clean-label reduced-sugar products, but cost keeps it more selective.
- Honey, agave, maple syrup, and date syrup support natural claims but still carry calories, making them different from true low-calorie systems.
| Natural sweetener | Market signal | Why it matters |
|---|---|---|
| Stevia | Strong reduced-sugar use | Supports natural low-calorie claims |
| Monk fruit | Premium natural positioning | Useful in clean-label products |
| Honey | Familiar consumer appeal | Supports natural and traditional claims |
| Agave | Plant-based syrup demand | Used in premium foods |
| Date syrup | Whole-food positioning | Supports clean-label innovation |
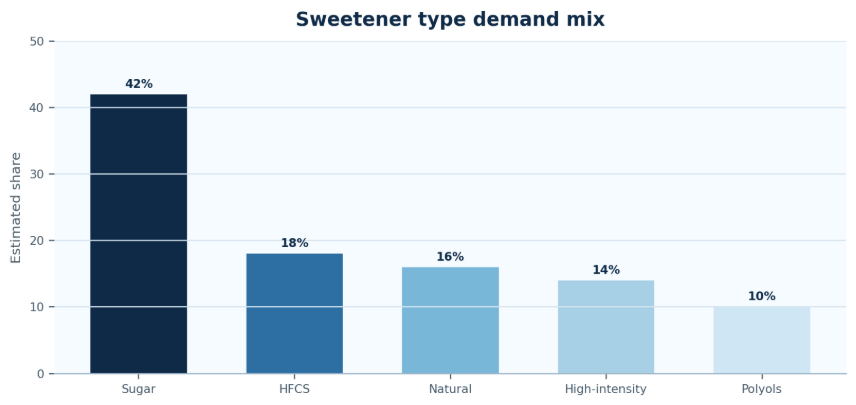
Figure 2. Sweetener-type demand shows the continued scale of sugar while natural and high-intensity systems gain reformulation importance.
Natural sweetener readout
Natural positioning helps brands win trust, but taste, cost, and supply reliability decide whether a sweetener moves from premium niche to broad manufacturing use.
High-Intensity and Low-Calorie Sweetener Statistics
High-intensity sweeteners are most useful when brands need large calorie reductions without adding bulk. They can deliver strong sweetness at low dosage, which makes them efficient in beverages, powders, tabletop products, and some dairy or nutrition systems.
The formulation challenge is that sweetness intensity does not automatically create a sugar-like experience. Sugar has onset, linger, body, and texture effects that many low-calorie sweeteners cannot fully replace alone. This is why commercial products often use blends instead of relying on a single sweetener.
Allulose and polyols are important because they can help with bulk and texture, not only sweetness. Their role is especially relevant in confectionery, bakery, frozen desserts, bars, and low-carb products where sugar replacement must protect mouthfeel and processing behavior.
Beverages remain the most visible application because liquid products can be reformulated quickly and consumers clearly compare full-sugar, low-sugar, and zero-sugar options. However, low-calorie sweeteners are also used in dairy, supplements, sports nutrition, sauces, chewing gum, and snacks.
- Sucralose remains popular because it offers high sweetness intensity and strong stability across many applications.
- Aspartame continues to appear in beverages, though public perception and labeling debates influence brand strategy.
- Acesulfame-K is often blended with other sweeteners to improve sweetness curve and reduce aftertaste.
- Allulose is gaining attention because it can provide bulk and sugar-like behavior with fewer calories, where approved.
- Polyols such as erythritol and xylitol support sugar-free confectionery, gum, and specialty low-carb products.
Low-calorie sweetener benchmark snapshot
- High-intensity sweeteners hold about 14% of estimated sweetener-type demand, making them central to zero-sugar and reduced-calorie products.
- Sucralose remains widely used because it delivers strong sweetness intensity and stability across many beverages and processed foods.
- Allulose and polyols are gaining attention because they help with bulk and texture, not only sweetness, where regulations permit use.
- Sweetener blends reduce aftertaste risk and help brands build a more sugar-like sweetness curve in beverages, dairy, and confectionery.
| Low-calorie system | Use signal | Adoption issue |
|---|---|---|
| Sucralose | Beverages, dairy, sauces | Perception and label fit |
| Aspartame | Diet beverages | Consumer trust debates |
| Acesulfame-K | Blended systems | Aftertaste management |
| Stevia extract | Natural reduced sugar | Bitterness control |
| Polyols | Confectionery and gum | Digestive tolerance |
Low-calorie sweetener interpretation
Low-calorie sweeteners create flexibility, but adoption depends on taste profile, label trust, regulatory approval, and performance in the target food matrix.
Application-Level Food Sweetener Statistics
Application demand should be read by function, not only by volume. Beverages need clean sweetness and fast reformulation, bakery needs structure and browning, confectionery needs crystallization and mouthfeel, dairy needs flavor balance, and sauces need stability under heat, acid, and storage.
Beverages are often the first category to show sweetener shifts because sugar levels are visible, serving sizes are standardized, and sugar-tax exposure can change product economics. Zero-sugar carbonates, flavored waters, energy drinks, sports drinks, ready-to-drink teas, and functional beverages keep this category highly active.
Bakery and confectionery are more difficult but also strategically important. Sugar contributes to texture, spread, moisture, color, and shelf life, so reformulation often requires sweetener blends, fibers, bulking agents, polyols, starch systems, or process changes to maintain product quality.
Application benchmark snapshot
- Beverages account for about 31% of estimated application demand, making drinks the leading reformulation battleground.
- Bakery represents about 19% of application demand, where sugar reduction is slower because sweetness, color, bulk, and texture are connected.
- Confectionery holds about 17% of estimated demand and requires careful blending because sugar controls sweetness, mouthfeel, and crystallization.
- Dairy and frozen desserts account for about 13% of demand, supported by family nutrition, reduced-sugar claims, and taste balancing.
| Application | Sweetener role | Market implication |
|---|---|---|
| Beverages | Sweetness and calorie reduction | Largest reformulation pressure |
| Bakery | Browning, bulk, texture | Harder sugar reduction |
| Confectionery | Mouthfeel and crystallization | Requires precise formulation |
| Dairy | Taste balance and health claims | Strong family positioning |
| Snacks | Flavor and indulgence | Supports premium launches |
| Sauces | Flavor rounding and viscosity | Needs stable sweetness |
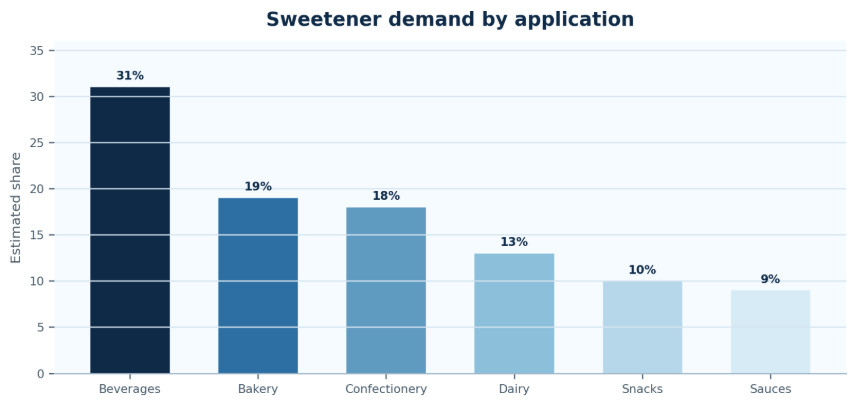
Figure 3. Beverage demand carries the clearest sugar-reduction pressure, while bakery and confectionery require more complex formulation support.
Application readout
Sweetener choice cannot be separated from application. The best-performing sweetener system in a beverage may fail in bakery, confectionery, or dairy because function changes by matrix.
Regional Food Sweetener Intelligence
Regional analysis matters because the same sweetener can have different commercial value depending on local diet patterns, beverage consumption, sugar taxes, regulatory approvals, and consumer trust. A natural sweetener with premium appeal in one market may face cost resistance in another.
North America and Europe are more mature reformulation regions, but they remain influential because large beverage, dairy, snack, and supplement brands often test reduced-sugar systems there first. Asia-Pacific carries larger volume potential because population scale, packaged-food growth, and beverage expansion create a wider base for sweetener adoption.
Latin America links production and consumption more directly because sugar is both an export commodity and a major ingredient in beverages and confectionery. Middle East and Africa remain more price-sensitive, with packaged-food growth and imported ingredient availability shaping sweetener selection.
North America
North America is a mature reformulation market. The United States has a large beverage, packaged-food, foodservice, and sweetener ingredient base. HFCS remains relevant, while zero-sugar beverages, stevia blends, monk fruit products, keto positioning, and no-added-sugar claims keep alternative sweetener demand active. Canada follows similar clean-label and health-positioning trends, though regulatory and retailer requirements influence launch pathways.
Europe
Europe combines beet sugar production, clean-label pressure, sugar-reduction policy, and regulatory scrutiny. The United Kingdom has been shaped by soft-drink levy experience, while Germany, France, Italy, and Spain show strong packaged-food demand with high expectations for ingredient transparency. European brands often need sweetener systems that satisfy both nutrition targets and consumer skepticism.
Asia-Pacific
Asia-Pacific carries the strongest scale signal because population size, beverage growth, packaged-food expansion, and rising middle-class consumption create large addressable demand. India, China, Thailand, Japan, Indonesia, and Australia each play different roles. India and China matter for consumption scale, Thailand for sugar supply, Japan for functional foods, and Australia for premium reformulation.
Latin America
Latin America is strategically important because Brazil is a major sugar producer and Mexico is a major beverage market with a strong sugar-tax context. The region combines sugar supply strength with growing reformulation pressure, especially in beverages, dairy, and packaged snacks.
Middle East & Africa
Middle East and Africa demand is linked to packaged-food penetration, beverage growth, dairy consumption, affordability, and imported ingredient access. Gulf markets support premium products, while broader regional adoption depends on manufacturing capacity, supply reliability, and price sensitivity.
Regional benchmark snapshot
- Asia-Pacific accounts for about 36% of estimated regional demand, supported by population scale, beverage growth, and packaged-food expansion.
- North America represents about 28% of regional demand, with reformulation, natural sweeteners, HFCS, and zero-sugar beverages shaping category strategy.
- Europe holds about 22% of estimated demand, where clean-label expectations, beet sugar supply, and sugar-reduction policy influence sweetener selection.
- Latin America accounts for about 9% of demand but remains strategically important because Brazil is a major sugar producer and Mexico is a key beverage market.
| Region | Food sweetener implication |
|---|---|
| North America | Mature reformulation market with low-calorie and natural demand |
| Europe | Regulation and clean label shape sweetener selection |
| Asia-Pacific | Population scale and beverages support high-volume demand |
| Latin America | Sugar production and beverage reformulation matter together |
| Middle East & Africa | Packaged-food growth and affordability drive demand |
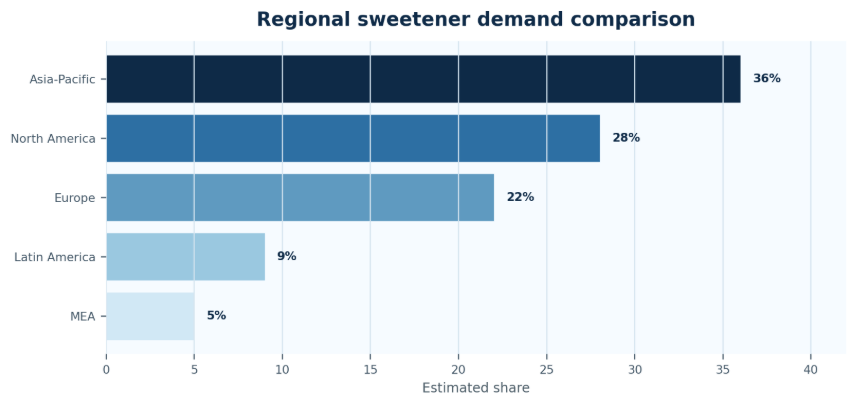
Figure 4. Regional sweetener demand reflects different growth engines: reformulation, regulation, population scale, sugar production, and packaged-food expansion.
Regional readout
Global sweetener averages are less useful than regional behavior. Each region combines different sugar supply, beverage demand, regulation, and consumer trust conditions.
Country-Level Food Sweetener Statistics
Country-level statistics are useful because global averages can hide very different market realities. Brazil and Thailand are supply signals because sugar exports influence global pricing. The United States and Mexico are reformulation signals because beverage demand and sugar policy shape brand decisions.
India and China are scale signals because population size, packaged foods, dairy, bakery, and beverage expansion can lift both caloric and alternative sweetener demand. Japan, Germany, France, and the United Kingdom show how mature markets use sweeteners through clean-label, low-calorie, functional, and premium product strategies.
Country-level analysis is essential because sweetener demand is tied to local food habits, commodity supply, regulatory approval, beverage consumption, and price sensitivity. A country can be a large sugar producer without being the fastest adopter of low-calorie alternatives. Another country can be smaller by volume but more advanced in clean-label reformulation.
The United States, Brazil, India, China, Thailand, Mexico, Germany, France, the United Kingdom, Japan, Indonesia, Australia, South Africa, Saudi Arabia, and the UAE each add different signals to the market map. Production, imports, consumer income, sugar-tax rules, and packaged-food penetration all change sweetener opportunity.
Brazil matters because sugarcane supply and exports influence global price and availability.
India matters because domestic sugar consumption and production scale create both supply and demand signals.
China matters because beverage, bakery, dairy, and packaged-food growth support a wide sweetener base.
Mexico matters because beverage reformulation is tied closely to sugar-tax and public-health discussion.
Japan matters because functional foods and low-calorie options have a strong premium positioning channel.
Country benchmark snapshot
- Brazil remains a critical supply-side country because sugar output and exports influence global pricing and availability.
- India combines large sugar production with high domestic consumption, making it both a supply market and a demand market.
- China’s packaged-food and beverage expansion keeps the country central to long-term sweetener demand across caloric and alternative systems.
- The United States remains a major reformulation market because beverage, snack, dairy, and tabletop sweetener demand is highly segmented.
| Country | Market signal | Why it matters |
|---|---|---|
| United States | Large beverages and packaged foods | Strong reformulation demand |
| Brazil | Major sugar producer | Key global supply signal |
| India | Large sugar output and consumption | High-volume growth market |
| China | Packaged-food expansion | Large sweetener demand base |
| Thailand | Major sugar exporter | Important supply-chain market |
| Mexico | Beverage reformulation and tax context | Important reduced-sugar case |
| Japan | Functional food culture | Premium sweetener opportunity |
| Germany | Clean label and beet sugar base | European formulation signal |
Consumer and Product Trend Statistics
Consumer trends have changed the language of sweetener use. Brands no longer promote only sweetness; they promote zero sugar, reduced sugar, no added sugar, natural sweetness, plant-based sweetness, diabetic-friendly positioning, keto compatibility, and functional beverage benefits. These claims turn sweetener choice into a front-of-pack strategy.
The challenge is that consumers are not uniform. Some shoppers prioritize calorie reduction. Others prioritize naturalness. Some avoid artificial sweeteners, while others avoid sugar alcohols due to digestive tolerance. The result is a fragmented market where different sweetener systems serve different consumer groups.
- Zero-sugar claims are strongest in beverages because consumers can easily compare calories per serving.
- No-added-sugar claims are common in dairy, snacks, cereals, sauces, and family nutrition products.
- Keto and low-carb products often rely on polyols, stevia, monk fruit, allulose, or blended systems.
- Natural claims help premium products, but flavor and cost determine repeat purchase.
- Functional beverages increasingly combine sweetness management with caffeine, protein, electrolytes, botanicals, or vitamins.
Trend readout
Consumer demand is split between fewer calories, cleaner labels, better taste, and affordable price. Sweetener systems that satisfy only one of these needs rarely scale widely.
Regulatory and Public-Health Landscape
Regulation affects sweetener demand in two directions. It can push brands away from high-sugar formulations through taxes, labeling rules, school-food standards, and public-health pressure. It can also slow adoption of alternatives when approval status, usage limits, or labeling language differs by country.
Public-health guidance has made sweetener choices more visible. Brands must now balance calorie reduction with consumer trust, especially where shoppers question unfamiliar high-intensity sweeteners or interpret “natural” as safer, cleaner, or more acceptable than synthetic alternatives.
Label claim discipline is central because sweeteners affect more than nutrition panels. Claims such as zero sugar, no added sugar, reduced sugar, naturally sweetened, diabetic-friendly, keto-friendly, or low calorie must align with ingredient rules, serving sizes, and country-specific requirements.
Regulation has become one of the strongest external forces shaping sweetener selection. Sugar taxes, front-of-pack labels, school nutrition rules, non-sugar sweetener guidance, acceptable daily intake rules, and country-level approvals influence how fast brands can reformulate and which ingredients they can use.
The policy landscape does not point in one direction only. Public-health pressure encourages sugar reduction, but regulatory review and consumer trust can slow adoption of some alternatives. Brands therefore need formulation systems that satisfy technical requirements and remain credible under public scrutiny.
| Policy area | Market effect | Sweetener implication |
|---|---|---|
| Sugar taxes | Push reformulation | Reduced-sugar systems |
| Front-of-pack labels | Increase nutrition visibility | Encourages lower sugar loads |
| ADI rules | Set use limits | Requires dosage control |
| Ingredient approvals | Determine market access | Shapes country launch plans |
| Children’s foods | Raise scrutiny | Requires careful claim strategy |
Policy interpretation
Sweetener demand is shaped by both consumer preference and public-health pressure. Sugar taxes and labels push reformulation, but approval status and consumer trust decide which alternatives scale.
Competitive Landscape and Company Statistics
Competitive strength depends on more than ingredient availability. Leading suppliers support customers with taste masking, sweetness curve design, application testing, regulatory guidance, procurement scale, and regional supply reliability. These services become especially valuable when brands reformulate core products.
Suppliers with broad portfolios can serve both traditional and emerging demand. Sugar and starch sweetener companies support high-volume manufacturing, while specialty suppliers in stevia, monk fruit, allulose, polyols, and flavor modulation support higher-value reformulation projects.
The competitive landscape includes commodity sugar suppliers, starch sweetener producers, natural sweetener specialists, ingredient distributors, and full-service formulation partners. The strongest suppliers are not only selling sweetness; they support blending, taste masking, texture repair, cost modeling, label claims, and regional regulatory navigation.
Cargill, ADM, Ingredion, Tate & Lyle, Roquette, Pure Circle, Sandsucker, Tereos, Associated British Foods, Ajinomoto, Swegon, and other suppliers compete across different parts of the sweetener system. Their value depends on portfolio breadth, production footprint, application knowledge, and supply reliability.
| Company area | What to compare | Why it matters |
|---|---|---|
| Sweetener portfolio | Sugar, starch, natural, high-intensity | Formulation breadth |
| Natural capability | Stevia, monk fruit, plant blends | Clean-label growth |
| Regional footprint | Production and distribution base | Supports supply reliability |
| Technical support | Taste masking and blending | Reformulation success |
| Customer base | Beverage, bakery, dairy, confectionery | Application strength |
Market Drivers and Barriers
The strongest driver is the pressure to reduce sugar without weakening product appeal. Shoppers may want fewer calories, but they still expect sweetness, indulgence, affordability, and familiar taste. This creates demand for systems that combine sweeteners with flavors, fibers, bulking agents, and processing support.
The largest barrier is execution risk. A sweetener system can look attractive in market data but fail if it changes texture, leaves aftertaste, raises cost, complicates label claims, or performs poorly during processing. The winning segments are those where consumer demand and technical feasibility align.
The market is pulled forward by sugar reduction, functional beverages, clean-label products, diabetes-aware nutrition, sports and active lifestyles, and packaged-food growth. At the same time, adoption is slowed by taste gaps, aftertaste, digestive tolerance, cost, regulatory uncertainty, and the difficulty of replacing sugar’s functional role in some foods.
A sweetener strategy works only when commercial, sensory, and regulatory factors align. A low-cost sweetener can fail if consumers reject the taste. A natural sweetener can fail if supply is inconsistent or too expensive. A high-intensity sweetener can fail if it does not match application texture or label expectations.
| Growth driver | Market effect |
|---|---|
| Reduced-sugar launches | Creates demand for low-calorie systems |
| Functional beverages | Expands sweetener blending needs |
| Natural sweetener demand | Supports stevia, monk fruit, honey, agave |
| Diabetes and weight management | Encourages calorie-reduction formats |
| Sugar taxes | Pushes beverage reformulation |
| Packaged-food expansion | Supports high-volume sweetener use |
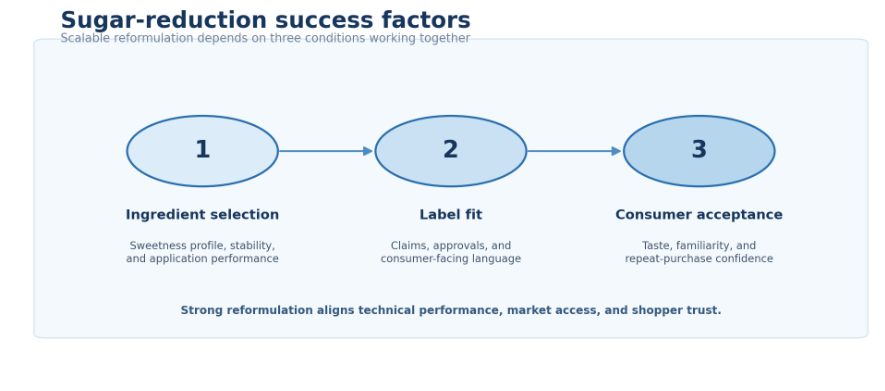
Figure 5. Sugar-reduction success depends on ingredient selection, label fit, and consumer acceptance.
Barrier readout
Sweetener growth depends on solving taste, cost, regulation, and texture together. A strong claim alone is not enough for repeat purchase or broad manufacturing adoption.
Sweetener Blend Economics and Cost Signals
The most resilient strategies balance sweetness curve, mouthfeel, supply security, regulatory acceptance, and consumer familiarity. That is why sweetener systems are often evaluated as formulation platforms rather than commodity purchases.
Cost per serving is therefore a more useful benchmark than ingredient price alone. A premium natural sweetener can look expensive on a kilogram basis but still work if dosage is low, label value is strong, and the finished product supports a higher retail price.
Sweetener economics increasingly depend on blends rather than single-ingredient swaps. A zero-sugar beverage may combine high-intensity sweetness, bulk support, acidity control, and flavor masking, while a bakery product may need bulking agents, humectants, and browning support to protect texture.
| Cost signal | What it shows | Market implication |
|---|---|---|
| Cost per serving | Real finished-product economics | Guides commercial feasibility |
| Dosage level | How much sweetener is needed | Shapes ingredient and label cost |
| Taste-masking need | Complexity of the blend | Raises technical support value |
| Supply reliability | Availability across regions | Protects launch continuity |
Economics readout
The winning sweetener system is not always the cheapest ingredient. It is the blend that protects taste, label appeal, regulatory fit, supply continuity, and cost per serving together.
Food Sweetener Market Diagnostic
A practical diagnostic should begin with the end product. A beverage, cookie, yogurt, sauce, or nutrition bar will not use the same sweetener strategy, even when the commercial target is similar. The best benchmarks compare ingredient performance against the specific application environment.
The diagnostic also has to include regional approval and consumer perception. A sweetener blend that works technically may still face launch friction if it lacks regulatory clarity, has negative consumer associations, or raises cost per serving beyond the brand’s price position.
A practical sweetener market review should move beyond revenue alone. The strongest diagnostic compares market demand, reformulation pressure, ingredient fit, application fit, regional approval, and supplier strength in the same view.
| Problem area | Core signals to measure | Useful benchmark |
|---|---|---|
| Market demand | Market size, CAGR, segment growth | Commercial opportunity |
| Reformulation pressure | Sugar tax, labels, launches | Structural demand |
| Ingredient fit | Taste, cost, stability, intensity | Feasibility |
| Application fit | Beverage, bakery, confectionery, dairy | End-use opportunity |
| Regional access | Approvals and acceptance | Entry complexity |
90-Day Food Sweetener Benchmark Plan
| Timing | What to do | Output |
|---|---|---|
| Days 1–30 | Build baseline by market size, type, application, region, and country | Clear demand map |
| Days 31–60 | Compare sugar reduction, natural systems, high-intensity sweeteners, and application barriers | Segment opportunity map |
| Days 61–90 | Review regulation, taste acceptance, supplier capability, and reformulation cost | Practical market scorecard |
Planning principle
The strongest sweetener analysis compares growth with formulation reality. A segment may look attractive by CAGR, but adoption slows if taste, cost, labeling, regulation, or processing performance cannot match the target application.
Metrics Food and Beverage Leaders Should Track
Metric discipline matters because the sweetener market is shaped by both commodity supply and reformulation demand. Leaders should monitor sugar output, price movement, alternative sweetener adoption, reduced-sugar launch activity, regional regulation, and application-level performance together.
The most useful scorecards combine commercial and technical indicators. Market size and CAGR show opportunity, but taste acceptance, cost per serving, label-claim compliance, supplier lead time, and processing performance determine whether a sweetener system can scale.
| Metric | Why it matters |
|---|---|
| Global market size | Commercial scale |
| CAGR | Growth momentum |
| Sweetener type share | Sugar vs alternative demand |
| Application share | Where sweeteners are used most |
| Sugar production | Commodity supply signals |
| Reduced-sugar launches | Innovation momentum |
| Natural sweetener adoption | Clean-label demand |
| Regulatory approval status | Market-entry feasibility |
| Taste acceptance | Consumer adoption risk |
| Label-claim compliance | Regulatory risk |
| Supplier lead time | Supply reliability |
Benchmark readout
The best sweetener scorecard tracks demand, formulation feasibility, label risk, and consumer acceptance together. Revenue without product performance gives an incomplete view.
Food Sweetener Market Statistics FAQ
How big is the food sweetener market?
The food sweetener market is estimated at USD 87.44 billion in 2026 and forecast to reach USD 109.02 billion by 2031. The category remains large because sweeteners are used across beverages, bakery, confectionery, dairy, sauces, snacks, and packaged foods.
What is the CAGR for the food sweetener market?
The food sweetener market is projected to grow at about 4.51% CAGR through 2031. The growth rate reflects steady packaged-food demand plus faster reformulation activity around natural, low-calorie, and reduced-sugar systems.
Which sweetener type has the largest demand?
Sugar and other caloric sweeteners still hold the largest demand base because they deliver sweetness, bulk, texture, and processing performance. Alternative sweeteners are growing faster in specific applications, but sugar remains the dominant volume anchor.
Why are natural sweeteners growing?
Natural sweeteners are growing because consumers want reduced-sugar products with familiar or plant-based labels. Stevia, monk fruit, honey, agave, date syrup, and blended systems help brands balance sweetness claims with cleaner ingredient positioning.
Which applications use the most sweeteners?
Beverages represent the strongest application signal because drinks face high sugar-reduction pressure and frequent product reformulation. Bakery, confectionery, dairy, snacks, and sauces also remain important because sweeteners influence taste, texture, and shelf stability.
Why are beverages important in sweetener demand?
Beverages are important because sugar content is highly visible and reformulation can produce immediate calorie reduction. Zero-sugar carbonates, flavored waters, sports drinks, iced teas, energy drinks, and functional beverages all use sweetener systems strategically.
Which region is growing fastest?
Asia-Pacific carries the strongest scale signal because population size, beverage growth, packaged-food expansion, and rising middle-class consumption create high-volume demand. North America and Europe are more mature but remain active reformulation markets.
How do sugar taxes affect sweetener demand?
Sugar taxes push beverage and packaged-food companies to reduce sugar per serving. This increases demand for high-intensity sweeteners, natural reduced-sugar systems, and blends that maintain taste while lowering taxable sugar content.
What are the biggest barriers in low-calorie sweetener use?
The biggest barriers are taste, aftertaste, cost, consumer trust, regulatory approval, and application performance. A sweetener may work well in beverages but fail in bakery or confectionery if it cannot replace sugar’s texture and bulk.
Which companies lead the sweetener market?
Leading players include large ingredient and sweetener suppliers such as Cargill, ADM, Ingredion, Tate & Lyle, Roquette, Pure Circle, Süd Zucker, Tereos, Ajinomoto, and Swegon. Competitive strength depends on portfolio breadth, supply reliability, and technical support.
How does regulation affect sweetener selection?
Regulation affects approved ingredients, usage levels, label claims, school-food rules, sugar taxes, and acceptable daily intake limits. Country-by-country differences can change which sweeteners are commercially practical in beverages, dairy, bakery, and supplements.
What metrics should food brands track?
Brands should track market size, CAGR, sweetener type share, application demand, sugar production, reduced-sugar launches, natural sweetener adoption, regulatory approval, cost per serving, taste acceptance, label compliance, and supplier lead times.
Final Takeaway
The food sweetener market remains large because sweetness is central to beverages, bakery, confectionery, dairy, snacks, sauces, and packaged foods. Traditional sugar still anchors volume, but growth increasingly comes from reduced-sugar, natural, and low-calorie formulation systems.
The largest opportunity is not simply replacing sugar. It is creating sweetener systems that deliver taste, texture, cost control, label appeal, regulatory compliance, and consumer trust in the same product.
The strongest market reading comes from tracking market size, CAGR, sweetener type, application mix, sugar output, reduced-sugar launches, regional rules, supplier capability, taste acceptance, label claims, and cost per serving.