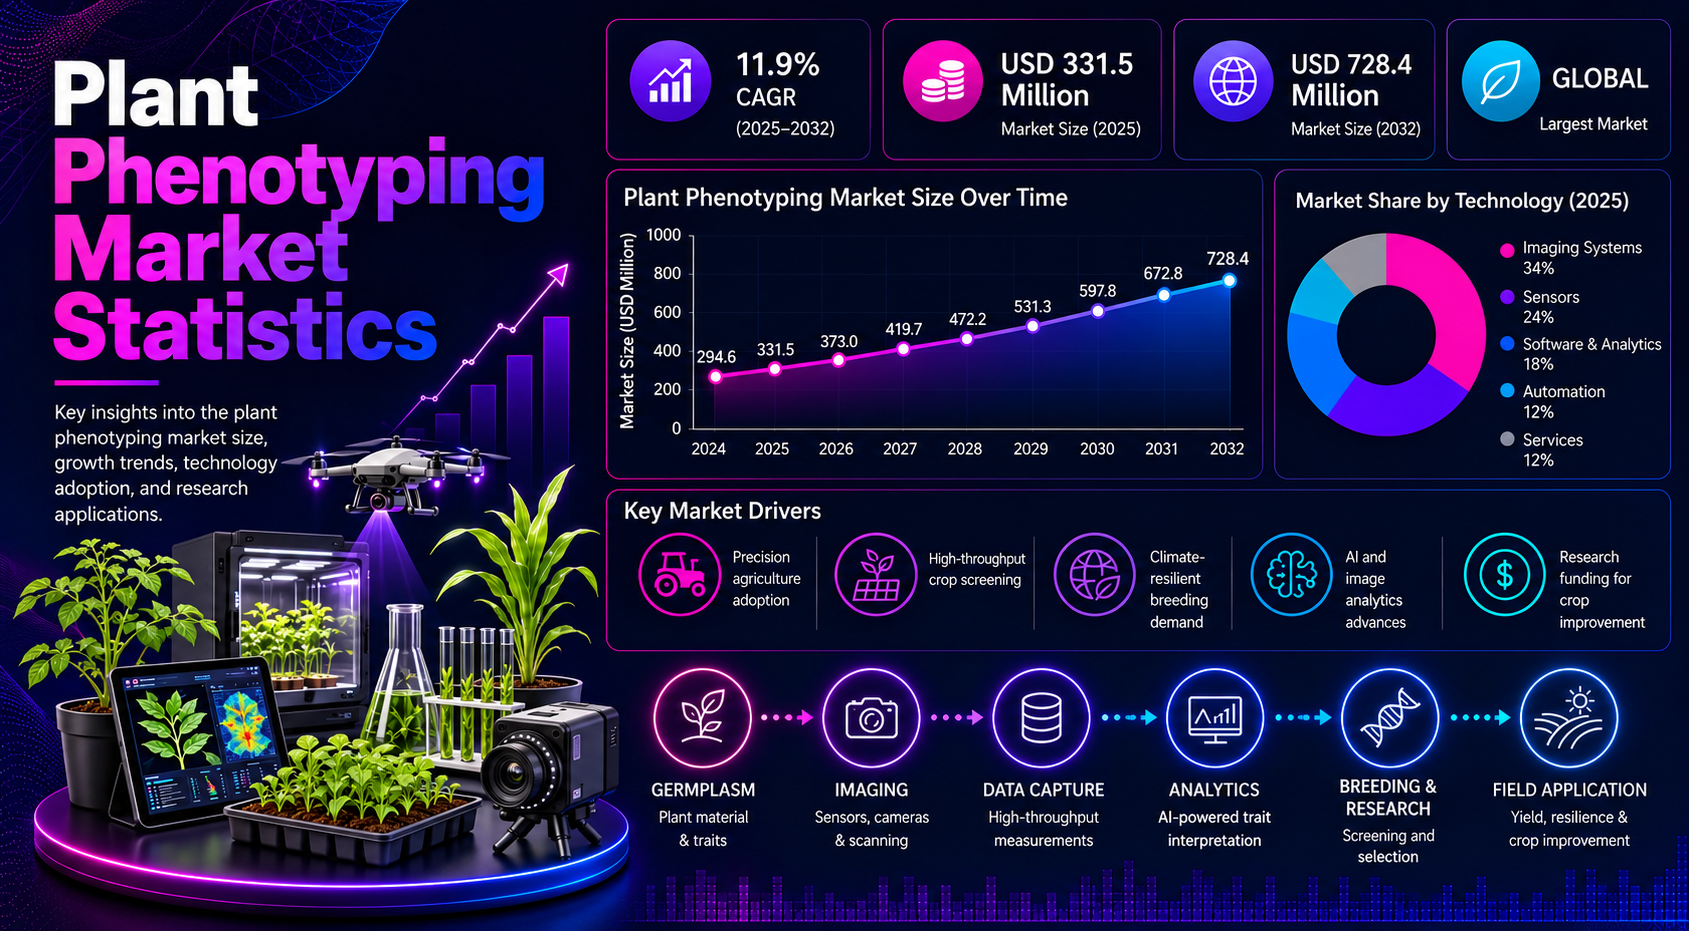
Plant phenotyping is the measurement and analysis of plant traits using imaging systems, sensors, robotics, controlled-environment platforms, field platforms, artificial intelligence, software, and data workflows. The market supports crop breeding, stress tolerance, disease resistance, yield improvement, climate resilience, food security, precision agriculture, and data-led plant science.
Market estimates show a fast-growing but scope-sensitive category. Grand View Research places the plant phenotyping equipment market at USD 205.8 million in 2022, USD 227.6 million in 2023, and USD 443.4 million by 2030. Markets & Data estimates the broader plant phenotyping market at USD 294.60 million in 2024 and USD 728.39 million by 2032, while Fortune Business Insights projects the market from USD 353.16 million in 2025 to USD 1,153.92 million by 2034.
The strongest way to read plant phenotyping statistics is to separate market size, equipment demand, sensor adoption, software and analytics, high-throughput systems, crop applications, regional infrastructure, country-level research capacity, end-user adoption, and business-model fit. A greenhouse imaging system, a drone survey, a field robot, and an AI trait-extraction platform may all support phenotyping, but each one solves a different adoption problem.
Executive Plant Phenotyping Benchmarks
The market is small compared with broad precision agriculture, but it is strategically important because crop improvement programs need faster and more reliable ways to connect plant traits with real performance.
The numbers that define the plant phenotyping market
• The global plant phenotyping equipment market was valued at USD 205.8 million in 2022.
• The plant phenotyping equipment market reached USD 227.6 million in 2023.
• Plant phenotyping equipment is projected to reach USD 443.4 million by 2030.
• The equipment market is expected to grow at 10.0% CAGR from 2023 to 2030.
• Markets & Data estimates the broader plant phenotyping market at USD 294.60 million in 2024.
• Markets & Data projects the market to reach USD 728.39 million by 2032.
• Fortune Business Insights places the market at USD 353.16 million in 2025.
• Fortune Business Insights projects the market to reach USD 1,153.92 million by 2034.
• Market Data Forecast estimates the market at USD 241.38 million in 2025.
• Market Data Forecast projects the market to reach USD 561.92 million by 2033.
• High-throughput phenotyping is estimated at USD 198 million in 2024 and USD 685 million by 2033.
• EMPHASIS has political support signals from 12 countries, while APPN includes 9 research organizations.
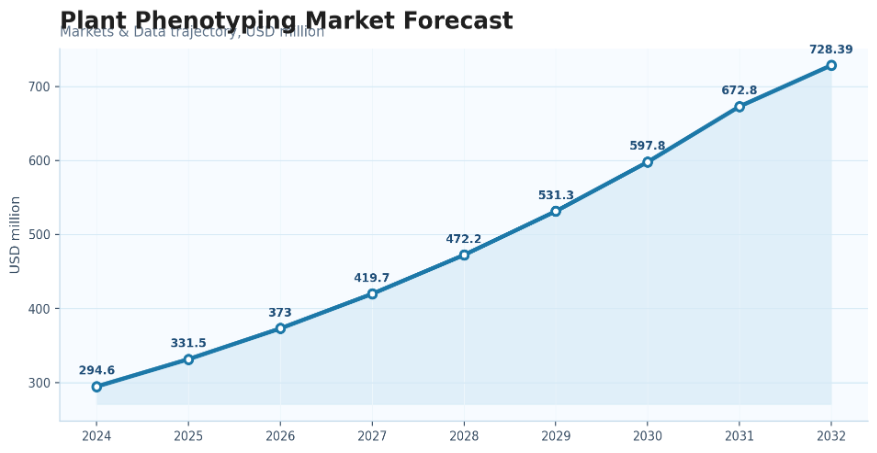
Figure 1. Plant phenotyping market growth reflects the rising role of imaging, sensors, automation, and AI-led trait measurement in crop science.
Editorial readout:
Plant phenotyping is moving from a research-support tool into crop-improvement infrastructure. Market growth is being driven by breeding speed, climate stress, sensor automation, AI analytics, and the need to connect plant traits with field performance.
Why Plant Phenotyping Matters
Plant phenotyping matters because crop improvement depends on more than genetic potential. Breeders need to know how plants actually perform under heat, drought, disease pressure, nutrient limits, greenhouse conditions, and field variability. Genotyping can identify potential, but phenotyping shows whether that potential becomes a useful crop trait.
Traditional plant measurement is slow, manual, and difficult to scale. Modern phenotyping systems can measure plant height, canopy structure, biomass, leaf area, chlorophyll response, disease symptoms, root vigor, flowering time, water stress, heat stress, and seedling development with greater speed and consistency. That makes the category valuable for research programs, seed companies, public agencies, and aggrotech vendors.
The strongest demand comes from use cases where measurement improves a real decision. If a system helps breeders screen more lines, detect stress earlier, compare plots more accurately, or reduce manual labor, the market case becomes clearer.
| Value driver | What it shows | Market implication |
|---|---|---|
| Breeding speed | Faster trait screening | Supports seed and crop improvement programs |
| Climate resilience | Heat, drought, water stress, disease response | Raises demand for field and controlled-environment systems |
| Sensor automation | More traits measured with less manual labor | Supports equipment and software growth |
| AI analytics | Converts images into trait data | Raises workflow and software value |
| Research infrastructure | Shared platforms and national networks | Reduces adoption barriers |
| Food security | Better crop performance under stress | Makes phenotyping strategically important |
Editorial readout:
Plant phenotyping matters because crop improvement is no longer only about collecting more data. The strongest value comes from measuring the right traits, under the right conditions, with enough speed and repeatability to support crop decisions.
Plant Phenotyping Market Size and Forecast Statistics
Market-size and forecast benchmarks
• Grand View Research places the plant phenotyping equipment market at USD 227.6 million in 2023.
• Grand View Research projects equipment demand at USD 443.4 million by 2030.
• Markets & Data estimates the broader plant phenotyping market at USD 294.60 million in 2024.
• Markets & Data projects the market to reach USD 728.39 million by 2032.
• Fortune Business Insights estimates the plant phenotyping market at USD 353.16 million in 2025.
• Fortune Business Insights projects the market at USD 1,153.92 million by 2034.
• Market Data Forecast estimates USD 241.38 million in 2025 and USD 561.92 million by 2033.
• Data Bridge Market Research estimates USD 292.98 million in 2024 and USD 672.74 million by 2032.
• Forecast variation is caused by scope differences across equipment, software, services, sensors, and total platform definitions.
| Market scope | What it includes | Use this logic |
|---|---|---|
| Equipment market | Imaging systems, carriers, chambers, platforms | Use for hardware and facility sizing |
| Total market | Equipment, software, services, sensors, analytics | Use for overall market benchmark |
| High-throughput phenotyping | Automated large-scale trait capture | Use for advanced breeding and research |
| Controlled-environment phenotyping | Greenhouse, growth chamber, indoor imaging | Use for repeatable stress testing |
| Field phenotyping | Drones, rovers, field sensors, gantries | Use for real-world crop validation |
| Software and analytics | AI, image processing, cloud data platforms | Use for workflow and data value |
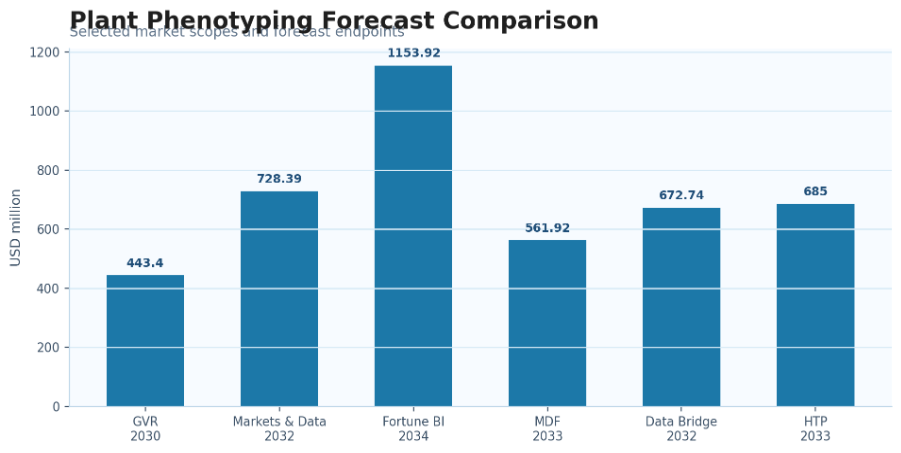
Figure 2. Forecast comparisons show why plant phenotyping statistics should be read by market scope, source, and forecast period.
Editorial readout:
Plant phenotyping market estimates should be read by definition. Equipment-only estimates are narrower than full market estimates that include sensors, software, services, analytics, and infrastructure access.
Equipment, Sensors, and Software Statistics
The technology stack is the core of the plant phenotyping market. Equipment captures images and plant measurements, sensors define the type of trait that can be measured, software converts raw signals into usable data, and services help users avoid high upfront investment.
Equipment is important because phenotyping requires controlled systems, carriers, robots, drones, cameras, chambers, conveyors, and field units. Software is becoming more important because raw images are not useful until they are cleaned, segmented, labelled, compared, and linked with plant traits. That shift makes analytics one of the strongest value layers in the market.
• Equipment represents an estimated 47% of the 2025 plant phenotyping market planning mix.
• Sensors represent an estimated 23% share.
• Software represents an estimated 18% share.
• Services represent an estimated 12% share.
• RGB imaging has a high adoption signal because it is relatively low-cost and useful for visual trait capture.
• Multispectral imaging supports vegetation indices, stress detection, and biomass signals.
• Hyperspectral imaging supports fine spectral signatures for disease, nutrient, and stress analysis.
• Thermal imaging supports canopy temperature and water-stress measurement.
• LiDAR and 3D scanning support plant height, canopy structure, and biomass estimation.
| Technology area | What it measures | Market implication |
|---|---|---|
| RGB imaging | Color, morphology, visible traits | Low-cost entry point |
| Multispectral imaging | Vegetation indices and stress | Strong field and crop monitoring fit |
| Hyperspectral imaging | Fine spectral signatures | Premium research and disease/stress analysis |
| Thermal imaging | Canopy temperature and water stress | Useful for drought and irrigation studies |
| Fluorescence imaging | Photosynthesis and stress physiology | Strong controlled-environment use |
| LiDAR / 3D | Structure, height, canopy geometry | Supports biomass and architecture traits |
| AI analytics | Segmentation, classification, trait extraction | Software value driver |
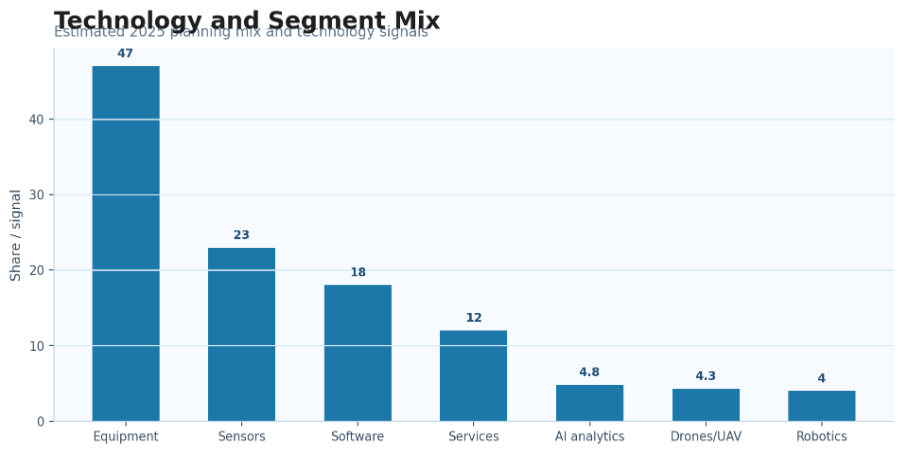
Figure 3. Imaging, sensor, and analytics technologies define how plant phenotyping systems convert plant traits into usable data.
Editorial readout:
The plant phenotyping market is not only about equipment sales. The highest-value workflows combine sensors, automation, image analytics, databases, and interpretation layers that make trait data repeatable and comparable.
High-throughput Phenotyping Statistics
High-throughput phenotyping turns plant measurement into a scalable workflow. Instead of measuring a small number of plants manually, researchers can capture thousands of images, plot-level signals, or sensor readings and convert them into repeatable trait data.
Automation is the main reason this segment matters. Greenhouse conveyor systems, field robots, UAVs, mobile platforms, and AI processing pipelines can reduce manual effort and increase trial scale. The challenge is that more data does not automatically create better decisions; the system must also produce accurate, standardized, and comparable outputs.
• High-throughput phenotyping was valued at USD 198 million in 2024.
• High-throughput phenotyping is projected to reach USD 685 million by 2033.
• The high-throughput phenotyping market is expected to grow at 14.5% CAGR.
• One plant image dataset study used 1,672 images.
• The same computer vision study achieved 94.31% non-null OCR text extraction accuracy.
• Leaf morphology classification averaged 62.82% accuracy.
• Plant treatment prediction reached 60.08% accuracy.
• Field robotics expands high-throughput phenotyping from controlled environments into real field conditions.
| HTP element | What it improves | Market implication |
|---|---|---|
| Automation | Reduces manual measurement | Increases trial scale |
| Computer vision | Extracts traits from images | Supports data-rich breeding |
| Machine learning | Classifies plant traits and stress | Raises software value |
| Field robotics | Captures data in real environments | Improves field relevance |
| UAVs | Covers larger areas faster | Supports field-scale screening |
| Greenhouse conveyors | Standardizes indoor imaging | Supports repeatability |
| Data pipelines | Organize multi-sensor outputs | Needed for scalable adoption |
Editorial readout:
High-throughput phenotyping is important because breeding and crop research need more than isolated measurements. The strongest systems create repeatable, scalable, and comparable trait data across plants, plots, environments, and time.
Application and Crop Statistics
Applications matter because plant phenotyping is valuable only when trait data improves a real crop decision. Trait identification, breeding selection, stress tolerance, disease resistance, yield estimation, biomass measurement, nutrient-use efficiency, canopy architecture, and root vigor all connect measurement with crop performance.
Crop type also changes the business case. Cereals and grains carry broad demand because they are central to food security and global breeding programs. Oilseeds, pulses, fruits, vegetables, specialty crops, horticulture, and biomass crops each require different traits, environments, and market logic.
• Trait identification accounts for an estimated 22% application share.
• Breeding selection accounts for an estimated 21% application share.
• Stress tolerance screening accounts for an estimated 18% application share.
• Yield and biomass estimation accounts for an estimated 14% application share.
• Cereals and grains account for an estimated 32% crop-type demand share.
• Oilseeds and pulses account for an estimated 18% share.
• Fruits and vegetables account for an estimated 16% share.
• Specialty crops account for an estimated 12% share.
| Application | Trait focus | Market implication |
|---|---|---|
| Breeding selection | Yield, vigor, architecture, stress response | Core commercial use case |
| Drought stress | Canopy temperature, wilting, root vigor | Climate resilience driver |
| Heat stress | Flowering, canopy response, biomass | Rising demand in warm regions |
| Disease resistance | Lesion detection, color change, growth impact | Supports breeding and crop protection |
| Yield and biomass | Plant height, canopy size, weight proxies | Links traits to output |
| Nutrient-use efficiency | Greenness, growth, root response | Supports sustainable agriculture |
| Canopy architecture | Structure, leaf angle, density | Useful for breeding and modeling |
| Root/seedling vigor | Early-stage growth and stress response | Important for screening pipelines |
Editorial readout:
Applications matter because phenotyping turns measurement into market value only when the data helps select better plants, explain stress response, or improve crop performance.
Regional Plant Phenotyping Market Statistics
North America
North America has strong adoption signals because of aggritech companies, seed companies, universities, public research, and precision agriculture activity. The United States remains a high-signal market because plant science, field research, AI analytics, and breeding programs are well established.
Europe
Europe has strong infrastructure signals because plant phenotyping is supported by research coordination, shared facilities, and sustainability-focused crop science. EMPHASIS provides an important network signal, while Germany, France, the United Kingdom, the Netherlands, and Belgium support advanced research demand.
Asia Pacific
Asia Pacific combines food security pressure with growing research infrastructure. Australia has a strong APPN signal, China and India have large crop-improvement needs, Japan and South Korea bring automation capability, and Singapore adds controlled-environment agriculture relevance.
Latin America
Latin America is shaped by tropical crop systems, soybean, maize, drought pressure, and field-based breeding needs. Brazil and Argentina are important for row crops, while Mexico, Chile, and Colombia add horticulture and climate-adaptation signals.
Middle East & Africa
Middle East & Africa has lower infrastructure maturity but strong need for heat, drought, water-stress, and controlled-environment solutions. Israel, the UAE, Saudi Arabia, South Africa, Kenya, and Egypt each show different combinations of aggrotech, irrigation, food security, and stress-tolerance demand.
| Region | Demand signal | Market implication |
|---|---|---|
| North America | Strong agrotech, universities, seed companies | Large research and commercial opportunity |
| Europe | Research infrastructure and EMPHASIS signal | Strong facility and shared-network role |
| Asia Pacific | Food security, Australia APPN, China/India demand | High long-term adoption potential |
| Latin America | Soybean, maize, tropical crop resilience | Field phenotyping and breeding relevance |
| Middle East & Africa | Heat, drought, water stress, CEA | Stress tolerance and controlled systems matter |
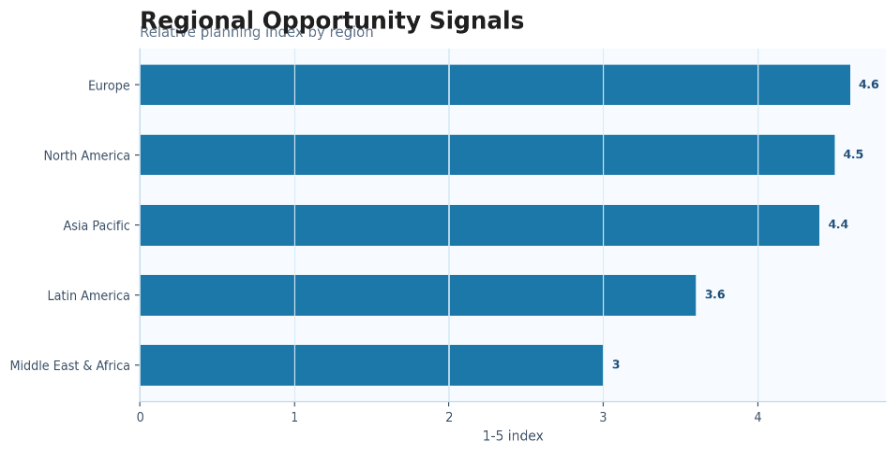
Figure 4. Regional signals show why plant phenotyping demand differs by infrastructure maturity, crop type, climate pressure, and research capacity.
Editorial readout:
Regional demand is shaped by research infrastructure, crop value, climate stress, breeding investment, and technology access. A region with strong research networks may adopt differently from one driven by food security and climate adaptation.
Country-Level Plant Phenotyping Signals
Country-level demand should not be measured only by GDP or farm size. Plant phenotyping adoption depends on crop research intensity, breeding investment, institutional infrastructure, local climate pressure, and whether users can turn trait data into practical crop decisions.
High-signal countries include the United States, Germany, Australia, China, the Netherlands, France, the United Kingdom, India, Brazil, and Canada. Emerging and specialized markets include Japan, South Korea, Spain, Italy, Israel, Argentina, Mexico, South Africa, the UAE, Saudi Arabia, Kenya, and Egypt.
| Country | Signal | Market implication |
|---|---|---|
| United States | Strong agrotech and research ecosystem | Field, AI, seed-company and university demand |
| Germany | Strong European plant science and infrastructure | Advanced research and EMPHASIS-linked opportunity |
| Australia | APPN national infrastructure | Strong crop stress and field phenotyping relevance |
| China | Food security and crop-scale research | Large long-term market potential |
| Netherlands | Greenhouse and controlled-environment strength | Controlled phenotyping and CEA fit |
| France | Crop science and European infrastructure | Breeding and research demand |
| United Kingdom | Phenomics and plant science base | Research-led adoption |
| India | Food security and stress tolerance demand | High need for scalable phenotyping |
| Brazil | Soybean, maize, tropical crop breeding | Strong field phenotyping fit |
| Canada | Cereal and canola breeding | Cold-climate crop research demand |
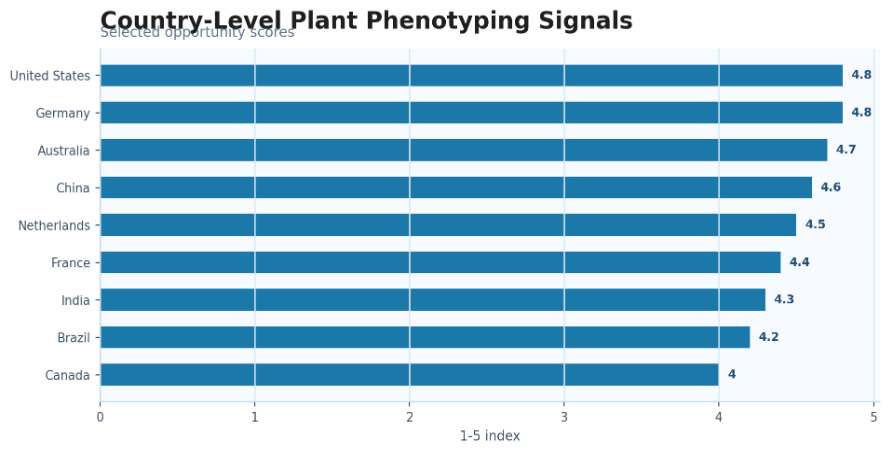
Figure 5. Country-level opportunity signals show where crop research intensity, infrastructure, and food-security needs can support phenotyping adoption.
Editorial readout:
Country-level demand is strongest when crop value, research infrastructure, and practical breeding needs overlap. Adoption is not only about technology availability; it depends on whether the user can apply trait data to crop improvement.
Research Infrastructure and Network Statistics
Research infrastructure is one of the strongest adoption signals in plant phenotyping. Shared facilities, national networks, and coordinated access models reduce the burden of buying expensive equipment and make it easier for researchers to compare data across environments and crops.
EMPHASIS is important because it signals a coordinated European approach to plant phenotyping infrastructure. APPN is important because it shows how a national network can connect research organizations, cropping zones, and phenotyping facilities across Australia.
• EMPHASIS has political support signals from 12 countries.
• APPN includes 9 research organizations.
• APPN provides infrastructure across mainland Australia’s major cropping zones.
• Shared infrastructure helps reduce adoption barriers for expensive phenotyping platforms.
• National networks make it easier to compare plant traits across environments, crops, and research programs.
| Infrastructure model | What it supports | Market implication |
|---|---|---|
| National phenotyping network | Shared equipment and expertise | Reduces capex barriers |
| European infrastructure | Standardized access and coordination | Supports cross-country research |
| Field stations | Real-environment crop testing | Improves breeding relevance |
| Controlled-environment facilities | Repeatable stress and growth testing | Supports high-quality trait data |
| Data platforms | Storage, sharing, and analytics | Needed for scalable phenotyping |
| Service access | External phenotyping support | Helps users without their own equipment |
Editorial readout:
Shared facilities and national networks help users access expensive systems, improve data comparability, and connect phenotyping with breeding and crop science programs.
End-user and Business Model Statistics
Plant phenotyping adoption is not limited to equipment purchases. The market also grows through shared infrastructure, software subscriptions, services, field deployments, and partnerships that make trait measurement easier to access.
Research institutes are often the core early adopters because they need controlled workflows, publication-grade data, and specialized platforms. Seed companies need scale and field relevance. Aggrotech firms need sensor integration and analytics. Public agencies connect the market with food security, resilience, and climate adaptation goals.
• Academic and research institutes account for an estimated 34% demand share.
• Seed and breeding companies account for an estimated 24% demand share.
• Aggrotech and precision agriculture firms account for an estimated 16% share.
• Government and public research agencies account for an estimated 13% share.
• Contract research and service providers account for an estimated 8% share.
• Controlled-environment agriculture operators account for an estimated 5% share.
| End user | What they need | Market implication |
|---|---|---|
| Research institutes | Trait data, repeatability, publication-grade workflows | Core early adoption group |
| Seed companies | Selection speed and field relevance | Commercial value driver |
| Aggrotech firms | Sensors, AI, automation, analytics | Technology integration opportunity |
| Government agencies | Food security and climate resilience | Public research demand |
| Service providers | Platform access and contract testing | Supports non-capex adoption |
| CEA operators | Growth optimization and controlled trials | Links phenotyping with indoor farming |
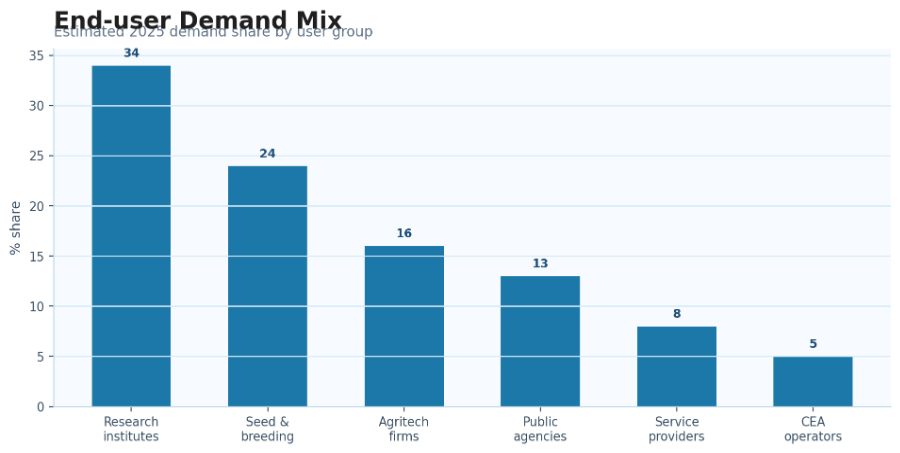
Figure 6. End-user demand is concentrated in research institutes and seed or breeding companies, but services and software models can expand access.
| Business model | Use case | Market implication |
|---|---|---|
| On-premise facility purchase | Large institutions and seed companies | High capex model |
| Shared infrastructure access | Research networks and public platforms | Lowers adoption barrier |
| Phenotyping-as-a-service | Contract trait measurement | Expands access beyond owners |
| Software subscription | Analytics and image processing | Recurring revenue opportunity |
| Mobile field deployment | Drones, rovers, portable systems | Useful for real field testing |
| Hybrid partnerships | Data and platform collaboration | Supports cross-institution projects |
Editorial readout:
Plant phenotyping adoption is broadest when users can choose between equipment ownership, shared infrastructure, contract service access, and analytics subscriptions.
Plant Phenotyping Growth-Leak Diagnostic
Growth leaks happen when phenotyping systems collect more data than users can interpret, compare, or connect to breeding decisions. The strongest market growth comes from systems that combine measurement accuracy, throughput, workflow simplicity, and practical crop relevance.
| Problem area | Core signal to measure | Useful benchmark |
|---|---|---|
| Market scope | Equipment vs total market | Equipment forecast at USD 443.4 million by 2030 |
| High-throughput adoption | Automation and trial scale | HTP forecast at USD 685 million by 2033 |
| Sensor fit | RGB, multispectral, hyperspectral, thermal, LiDAR | Sensor value depends on trait need |
| Software workflow | AI, image analysis, databases | Data bottlenecks limit adoption |
| Field relevance | Controlled vs field phenotyping | Real-world validation matters |
| Infrastructure access | Shared networks and national platforms | APPN and EMPHASIS show network value |
| Country fit | Crop value and research infrastructure | Country-level adoption varies |
| Cost barrier | Capex and technical complexity | Services and shared access reduce friction |
Editorial readout:
A system that measures many traits but cannot deliver decision-ready data creates adoption friction. Practical usefulness is the strongest test of market value.
90-Day Plant Phenotyping Benchmark Plan
| Timing | What to do | Output |
|---|---|---|
| Days 1–30 | Map market scope, benchmarks, technologies, crop applications, users, regions, and country signals. | Plant phenotyping benchmark map |
| Days 31–60 | Compare equipment, sensors, software, services, high-throughput systems, infrastructure, and country opportunity. | Opportunity and risk matrix |
| Days 61–90 | Prioritize technologies, crop applications, countries, and business models by adoption barriers and practical value. | Phenotyping market scorecard |
Planning principle:
A strong plant phenotyping benchmark plan should connect market value with trait value. The best opportunities are measurable, repeatable, comparable, and useful for crop decisions.
Metrics Plant Phenotyping Leaders Should Track
| Metric | Why it matters |
|---|---|
| Market size by scope | Prevents equipment-only and total-market confusion |
| CAGR by source | Shows growth consistency or forecast spread |
| Equipment share | Tracks hardware demand |
| Sensor mix | imaging and measurement priorities |
| Software share | Tracks analytics and workflow value |
| Service demand | Shows non-capex adoption |
| Throughput per trial | Measures scale |
| Cost per plot | economic feasibility |
| Data accuracy | Determines research usefulness |
| Trait repeatability | Supports breeding confidence |
| Field validation rate | Links controlled data with real-world performance |
| Crop coverage | Shows market expansion |
| Regional opportunity score | Guides geographic prioritization |
| Country infrastructure signal | adoption readiness |
| End-user mix | Clarifies buyer groups |
| Business model mix | capex vs service adoption |
Editorial readout:
The best plant phenotyping scorecard connects market size with practical research performance. Throughput, accuracy, repeatability, cost, crop relevance, and workflow usability matter as much as headline revenue forecasts.
Plant Phenotyping Market Signal Flow
Plant phenotyping demand is easiest to read as a signal chain. The chain starts with a crop problem, moves into the traits that need to be measured, then into the sensor or platform that can measure those traits, and finally into the workflow that turns data into a breeding or research decision.
| Signal | What to compare | Action logic |
|---|---|---|
| Crop problem | Drought, heat, disease, yield, nutrition | Start with the decision that needs better data |
| Trait selection | Canopy, biomass, roots, color, temperature, architecture | Choose traits that directly support the decision |
| Technology fit | RGB, multispectral, hyperspectral, thermal, LiDAR, robotics | Match sensor to trait and environment |
| Workflow readiness | AI analytics, databases, repeatability, validation | Make data comparable and usable |
| Adoption model | Ownership, shared infrastructure, service, subscription | Reduce cost and access barriers |
Editorial readout:
The strongest phenotyping benchmark links market size with trait usefulness. A platform wins when it measures the right trait, in the right environment, with a workflow the user can repeat.
Controlled-Environment and Field Phenotyping Statistics
Controlled-environment and field phenotyping answer different market questions. Controlled systems are useful when researchers need repeatable conditions, precise lighting, stable imaging geometry, and standardized stress protocols. Field systems are useful when researchers need to understand how a trait performs in soil, weather, management variability, and real production environments.
Greenhouse and growth-chamber phenotyping often supports early-stage screening, treatment comparison, photosynthesis research, root and seedling work, and controlled stress testing. Field phenotyping supports late-stage validation, plot-level selection, canopy monitoring, drought response, disease scouting, and yield-related decisions. A strong program often needs both, because controlled precision must eventually connect with real-world performance.
The commercial implication is that platforms should not be evaluated only by sensor type. A hyperspectral camera in a controlled cabinet and the same sensing logic mounted on a field robot solve very different workflow problems. The first improves repeatability and trait precision; the second improves plot coverage and environmental relevance. Buyers compare not only accuracy, but also throughput, labor savings, calibration burden, data output, and integration with breeding decisions.
• Controlled-environment phenotyping is strongest when repeatability, lighting control, and treatment comparison matter.
• Field phenotyping is strongest when real-world stress, soil variation, weather, and plot-scale performance matter.
• Greenhouse conveyor systems can standardize plant movement and imaging geometry for high-throughput indoor studies.
• Drones and rovers can collect plot-level signals faster than manual scouting in large field trials.
• Adoption improves when users can compare controlled-environment signals with field validation outcomes.
| Phenotyping setting | Best fit | Market implication |
|---|---|---|
| Growth chamber | Seedling and controlled stress testing | Useful for repeatable early-stage trait work |
| Greenhouse conveyor | High-throughput indoor imaging | Strong facility-based research fit |
| Screenhouse / nursery | Semi-controlled plant development | Useful bridge between lab and field |
| Field plots | Breeding lines and real crop performance | Critical for commercial validation |
| Drone-based field systems | Large-area canopy and vigor screening | Supports field-scale monitoring |
| Rover / robot systems | High-resolution plot and plant scanning | Improves repeatable field data capture |
Editorial readout:
The strongest phenotyping strategy combines controlled precision with field relevance. Controlled systems make traits easier to measure; field systems make traits easier to trust.
Data Workflow and Interoperability Statistics
Data workflow is one of the most important parts of the plant phenotyping market because the output of a phenotyping system is not only an image. It is a structured trait dataset that must be stored, cleaned, labelled, compared, validated, and connected with genotypes, treatments, environments, plots, and crop performance.
Many adoption barriers appear after the image is captured. Users need metadata standards, sensor calibration, plot matching, object segmentation, trait extraction, quality control, database access, and visualization tools. If those steps are too difficult, the system becomes a measurement bottleneck rather than a research accelerator.
AI analytics can raise market value by reducing manual scoring and turning images into usable trait signals. However, AI models need training data, validation, repeatable imaging conditions, and careful interpretation. A model that performs well in one crop, growth stage, or environment may need adjustment before it can support broader decisions.
The highest-value data workflows connect phenotyping outputs with breeding pipelines. That means a user should be able to compare genotypes, rank lines, identify stress response, track growth over time, and export data into downstream analysis systems. This is why software and analytics are becoming more important even when equipment remains a large market component.
• Image capture creates value only when the data can be translated into a usable trait.
• Metadata quality is essential because plant images need crop, genotype, treatment, date, location, and environment context.
• Data interoperability becomes more important as users combine field, greenhouse, drone, robot, and lab measurements.
• AI analytics can reduce manual scoring but still needs validation against expert observation and field outcomes.
• Cloud databases and visualization tools help users compare traits across trials, crops, and locations.
| Workflow layer | What can go wrong | Practical fix |
|---|---|---|
| Metadata capture | Images lack crop, plot, treatment, or time context | Standardize trial labels and sensor records |
| Sensor calibration | Different devices produce inconsistent outputs | Use calibration targets and repeatable protocols |
| Trait extraction | Raw images do not become decision-ready traits | Use validated segmentation and analytics models |
| Data storage | Files become scattered or difficult to compare | Use structured databases and cloud access |
| Interoperability | Phenotype data cannot connect with breeding systems | Use common formats and exportable workflows |
| Validation | Model output is not checked against real performance | Compare analytics with field and expert measurements |
Editorial readout:
Data workflow is where phenotyping becomes useful. Systems that capture clean images but fail at metadata, calibration, trait extraction, or interoperability will struggle to create durable market value.
Commercial Adoption and Procurement Signals
Commercial adoption depends on the buyer’s problem. A research institute may prioritize repeatability, publication-quality data, and platform flexibility. A seed company may prioritize throughput, selection speed, field relevance, and integration with breeding software. A service provider may prioritize utilization rate, portability, and the ability to run many projects for different clients.
Procurement is also shaped by capital intensity. Full phenotyping facilities can require equipment, controlled space, trained staff, data systems, maintenance, and ongoing calibration. That makes shared infrastructure, services, and software subscriptions attractive for users who need trait data but cannot justify owning a full platform.
Seed and breeding companies often evaluate phenotyping tools by the value of faster selection. If a system reduces manual scoring, screens more lines, identifies stress response earlier, or improves confidence in field selection, it can support a stronger business case. Public agencies may focus more on food security, climate resilience, and research access.
Service models can expand the market by reducing the need for direct ownership. A user can buy a phenotyping service, rent access to a facility, or subscribe to analysis software. These models are important because they allow smaller research teams, regional programs, and crop-specific projects to use advanced measurement without building an entire facility.
• Large research institutes usually need flexible platforms and strong data quality.
• Seed companies usually need scale, field relevance, and direct breeding pipeline value.
• Public agencies usually need food security, resilience, and multi-crop research outcomes.
• Service providers usually need portability, utilization rate, and repeatable client workflows.
• Software subscriptions can turn phenotyping from a hardware purchase into an ongoing analytics workflow.
| Buyer type | Procurement question | Market implication |
|---|---|---|
| Research institute | Can the platform support repeatable, publishable trait data? | flexibility and validation |
| Seed company | Does the system improve selection speed and confidence? | Needs scale and breeding integration |
| Public agency | Does it support food security or climate resilience? | Needs program-level usefulness |
| Service provider | Can the system be used across many projects? | utilization and portability |
| CEA operator | Can trait data improve controlled production? | actionable growth optimization |
| Software buyer | Can analytics reduce manual work and improve decisions? | Needs integration and usability |
Editorial readout:
Commercial adoption rises when phenotyping solves a clear workflow problem. Buyers do not only buy sensors; they buy speed, repeatability, confidence, and access to decision-ready trait data.
Crop Stress and Climate-Resilience Signals
Climate resilience is one of the strongest long-term demand drivers for plant phenotyping. Drought, heat, salinity, flooding, disease pressure, and nutrient stress all create conditions where visual scoring and manual measurement are not enough. Breeders need scalable tools that detect how plants respond over time and under real stress conditions.
Drought and heat stress are especially important because they affect many regions and many crops. Thermal imaging can help measure canopy temperature and water stress. Multispectral and hyperspectral systems can support stress detection before visible symptoms become severe. Root and seedling measurements can help identify early vigor and stress resilience.
Disease-resistance phenotyping also has a strong market role because disease symptoms can be visual, spatial, and time-sensitive. RGB imaging can capture visible lesions, color changes, and canopy damage. Spectral systems may detect earlier changes in plant physiology. AI can help classify symptoms, but it must be trained and validated carefully to avoid misleading outputs.
Climate-resilience applications are commercially useful because they connect phenotyping with crop value. When a system helps identify varieties that hold biomass, yield, canopy function, or disease tolerance under stress, it supports breeding decisions that matter to farmers, seed companies, and food-security programs.
Another practical signal is repeatability across seasons. Plant phenotyping tools are often tested in one crop, one location, or one controlled setting, but market adoption improves when users can repeat the same measurement logic across seasons, varieties, and treatment conditions. This is why calibration, standardized protocols, and comparable trait outputs are central to long-term value.
The market also benefits from the rise of adjacent digital agriculture systems. Precision farming, remote sensing, controlled-environment agriculture, robotics, and farm analytics all create familiarity with sensor-led decision-making. Plant phenotyping sits deeper in the research and breeding workflow, but it benefits when growers, researchers, and aggrotech teams become more comfortable with image-based crop intelligence.
Training and technical support are also part of the market story. A phenotyping platform may include cameras, lighting, robotics, environmental controls, and software, but the user still needs protocols, staff training, data interpretation, and maintenance. Vendors that make the workflow easier to learn can reduce adoption friction and widen the buyer base.
The strongest commercial systems will likely combine modular hardware with flexible software. Users may start with RGB imaging or a small field workflow, then add multispectral sensing, thermal imaging, LiDAR, AI analytics, cloud storage, or service support as needs grow. This staged adoption path is important because many plant science teams cannot move directly into full high-throughput infrastructure.
Plant phenotyping statistics should therefore be read as an infrastructure signal, not just a revenue signal. The market grows when measurement speed, trait accuracy, software usability, facility access, regional support, and crop relevance move together. If one layer is missing, adoption becomes slower even when headline growth rates look strong.
• Drought phenotyping often uses canopy temperature, wilting, leaf area, root traits, and biomass response.
• Heat phenotyping often uses flowering response, canopy function, growth rate, and yield components.
• Disease phenotyping often uses lesion detection, color change, canopy damage, and growth suppression.
• Flooding and salinity phenotyping require time-based monitoring because symptoms develop across growth stages.
• Climate-resilience demand is strongest when phenotyping can connect stress signals with yield or survival outcomes.
| Stress area | Useful trait signals | Market reading |
|---|---|---|
| Drought | Canopy temperature, wilting, root vigor, biomass | Strong field and controlled-environment demand |
| Heat | Flowering, canopy response, seed set, growth rate | Rising need in warm regions |
| Disease | Lesions, color change, canopy damage, growth impact | Supports breeding and crop protection |
| Salinity | Growth suppression, chlorophyll, root response | Important for water-limited agriculture |
| Nutrient stress | Greenness, leaf area, biomass, root response | Supports sustainable input use |
| Flooding | Survival, recovery, leaf damage, root response | Useful for climate-risk screening |
Editorial readout:
Climate-resilience phenotyping is strongest when stress signals can be linked to crop performance. The market value comes from measuring traits that help users select better plants under difficult conditions.
Plant Phenotyping Market Statistics FAQ
Common questions
• How large is the plant phenotyping market?
The answer depends on scope. Grand View Research measures equipment at USD 227.6 million in 2023 and USD 443.4 million by 2030, while broader market estimates range from USD 241.38 million in 2025 to more than USD 1,153.92 million by 2034.
• Why do plant phenotyping market estimates differ?
Estimates differ because some reports measure equipment only, while others include equipment, sensors, software, services, analytics, and full platform workflows.
• How fast is the plant phenotyping market growing?
Growth estimates commonly sit in the low double digits. Equipment is expected to grow at 10.0% CAGR, while high-throughput phenotyping is estimated at 14.5% CAGR.
• What is high-throughput phenotyping?
High-throughput phenotyping is automated large-scale trait measurement using imaging, robotics, drones, conveyors, AI analytics, sensors, and data workflows.
• Which technologies matter most?
RGB, multispectral, hyperspectral, thermal, fluorescence, LiDAR, NDVI, AI analytics, cloud databases, UAVs, and field robotics are important because each measures a different type of plant signal.
• Which regions matter most?
North America, Europe, and Asia Pacific have strong adoption signals, while Latin America and Middle East & Africa show crop-stress and food-security opportunities.
• Which countries should be included?
High-signal countries include the United States, Germany, Australia, China, the Netherlands, France, the United Kingdom, India, Brazil, and Canada, with additional signals from Japan, South Korea, Mexico, Argentina, South Africa, Israel, the UAE, Saudi Arabia, Kenya, and Egypt.
• Who buys plant phenotyping systems?
Research institutes, seed companies, aggrotech firms, public agencies, contract research providers, and controlled-environment agriculture operators are the main user groups.
• What metrics should companies track?
Useful metrics include market scope, equipment demand, sensor mix, software share, throughput, accuracy, repeatability, cost per plot, crop relevance, regional opportunity, and adoption model.
Final Takeaway
The plant phenotyping market is growing because agriculture needs faster, more precise, and more repeatable ways to connect plant traits with crop performance. The category sits at the intersection of crop breeding, climate resilience, sensor automation, AI analytics, high-throughput research, field validation, controlled-environment testing, and food security.
The practical opportunity is not only to measure more plants. The stronger benchmark is whether phenotyping systems can measure the right traits, produce reliable data, reduce manual work, support breeding decisions, and remain accessible through equipment, software, services, shared infrastructure, or field deployment.
Plant phenotyping leaders should read the market through both revenue growth and research usefulness. A large forecast shows opportunity, but adoption depends on trait value, data accuracy, throughput, cost per plot, interoperability, and whether users can trust the results enough to make crop decisions.
Across every section, the same pattern appears: plant phenotyping is most valuable when it shortens the distance between observation and decision. A camera, sensor, robot, or software platform is only useful when it produces a trait measurement that a breeder, researcher, or agronomist can compare and act on.
The market also benefits from pressure outside the laboratory. Climate volatility, water scarcity, heat stress, disease pressure, and the need for higher-yielding crops make repeatable trait measurement more urgent. That gives phenotyping a strategic role inside seed development, public research, precision agriculture, and climate-resilient farming.
Future growth will depend on integration. Equipment suppliers, sensor vendors, software companies, research networks, and service providers need to make workflows easier to adopt. Systems that reduce manual work, connect controlled-environment and field data, and make outputs easy to interpret will hold the strongest market position