Online checkout is where ecommerce revenue is either completed, delayed, or lost. The customer has already shown intent, but final conversion still depends on pricing clarity, delivery expectations, mobile usability, trust, payment choice, authorization quality, and fraud controls. That makes checkout a business system, not just the last page in a funnel.
The strongest statistics show why checkout deserves its own scorecard. Cart abandonment remains above 70%, Baymard estimates large sites can gain up to 35% from checkout design improvements, Stripe found 95% of leading ecommerce sites still make five or more basic checkout errors, and Worldpay reports digital wallets now represent 53% of global ecommerce spend. At the same time, Checkout.com estimates $50.7 billion in false-decline losses across four major markets, proving that payment performance can erase revenue even after a shopper submits the order.
This final-polish version is organized for scanning. Each section starts with a short explanation, then presents curated benchmark bullets, followed by a concise interpretation block or planning table where it helps. The goal is not to list every available number. It is to show which statistics actually help ecommerce, payments, fraud, finance, and growth teams understand where checkout is leaking revenue.
Executive Checkout Benchmarks
These are the statistics show the scale of abandonment, the cost of checkout friction, the payment-method shift, and the difference between a completed form and a successful payment.
The numbers that define the checkout problem
• Baymard’s documented cart abandonment benchmark is 70.22%, meaning most carts still do not convert into completed orders.
• Baymard estimates the average large ecommerce site can increase conversion by as much as 35% through checkout design improvements.
• 39% of U.S. shoppers abandon because extra costs such as shipping, taxes, or fees are too high.
• 21% abandon because delivery is too slow, while 19% leave because they do not trust the site with card information.
• 18% abandon because checkout is too long or complicated, and 15% leave because the site had errors or crashed.
• Stripe found 95% of leading ecommerce sites make five or more basic checkout errors.
• Stripe found 60% of shoppers would abandon a purchase if checkout took more than two minutes.
• Worldpay reports global ecommerce spend grew from $1.2 trillion in 2014 to more than $6.8 trillion in 2024.
• Digital wallets reached 53% of global ecommerce spend in 2024, equal to roughly $3.6 trillion in online payment value.
• Adyen reports 54% of shoppers will leave a store or abandon online checkout if they cannot use their preferred payment method.
• Stripe’s payment-method experiment found a 12% average revenue lift and 7.4% conversion-rate lift from surfacing at least one relevant payment method beyond cards.
• Checkout.com reports $50.7 billion in false-decline losses across the U.S., U.K., France, and Germany.
Editorial readout The headline data points to five different sources of revenue loss: price surprise, delivery hesitation, form friction, payment-method mismatch, and payment rejection. A merchant that treats abandonment as one number will struggle to improve it. The more useful approach is to split checkout performance by step, device, country, payment method, and decline reason.
Why Checkout Now Carries Trillion-Dollar Stakes
Checkout optimization matters more when ecommerce and digital payments operate at global scale. Market-size figures do not tell a merchant exactly what to change, but they show why small checkout improvements can become material when transaction value is measured in billions or trillions.
Market-size and payment-growth benchmarks
• Worldpay reports global ecommerce spend rose from $1.2 trillion in 2014 to more than $6.8 trillion in 2024.
• eMarketer forecasts worldwide retail ecommerce sales of about $6.4 trillion in 2025.
• Worldpay says digital payment value across ecommerce and in-person commerce grew from $1.7 trillion in 2014 to $18.7 trillion in 2024.
• Worldpay projects digital payment value will exceed $33.5 trillion by 2030.
• Digital payment methods grew from 34% of ecommerce value in 2014 to 66% in 2024.
• Digital wallets are projected to reach 65% of global ecommerce value by 2030.
• Worldpay data shows BNPL online spend grew from about $2.2 billion in 2014 to $342 billion in 2024.
• Adobe reported $257.8 billion in U.S. online holiday spend from Nov. 1 to Dec. 31, 2025, up 6.8% year over year.
• Adobe also reported $145.2 billion in U.S. mobile holiday spend, up 10.7% year over year.
• McKinsey reports global payments revenue grew by an average 7% annually from 2019 to 2024, even though growth slowed to 4% in 2024 after 12% in 2023.
The market context changes the business case. A checkout improvement is not only a button-color test or a design-cleanup project. It can affect revenue capture, card fees, wallet adoption, fraud losses, chargebacks, support workload, and repeat-customer behavior.

Figure 1. Online checkout market scale and abandonment benchmarks should be reviewed together because small conversion improvements become significant at high transaction volume.
Cart Abandonment: Where Revenue Starts Leaking
Cart abandonment is useful only when it is broken into causes. A customer who leaves because shipping is expensive needs a different fix from a customer who leaves because a card is declined, a local payment method is missing, or the checkout fails on mobile.
Abandonment reasons worth separating
• Baymard’s documented cart abandonment average is 70.22% across a broad set of abandonment studies.
• 39% of U.S. shoppers abandon because shipping, taxes, or fees are too high.
• 21% abandon because delivery is too slow.
• 19% abandon because they do not trust the site with card information.
• 19% abandon because the site requires account creation.
• 18% abandon because checkout is too long or complicated.
• 15% abandon because the site had errors or crashed.
• 10% abandon because there were not enough payment methods.
• 8% abandon because their card was declined.
| Leak type | Primary metric | Likely owner |
|---|---|---|
| Price surprise | Shipping, tax, fee, and discount-code exits before payment | Pricing, ecommerce, fulfillment |
| Delivery hesitation | Exits after delivery-speed or delivery-cost display | Fulfillment, ecommerce |
| Trust concern | Exits near card entry, security messaging, return policy, or review visibility | UX, brand, payments |
| Account friction | Guest checkout completion versus required-login completion | UX, product, CRM |
| Payment rejection | Decline rate, retry success, alternative-method conversion | Payments, risk |
How to use the abandonment data The abandonment benchmark is a warning light, not the diagnosis. A useful dashboard separates preventable friction from normal browsing behavior, then assigns each preventable leak to an owner. That keeps teams from responding to a 70% abandonment rate with generic discounts when the real problem may be shipping transparency, mobile input, missing wallets, or issuer declines.
Checkout UX: Fields, Errors, and Time-to-Pay
Checkout UX statistics are strongest when they focus on work the shopper must do. Long forms, poor validation, missing mobile keyboards, account requirements, and slow payment entry all create effort after intent has already been established.
Form structure and checkout effort
• Baymard says an ideal checkout can be reduced to 12-14 form elements.
• The same research says an ideal checkout may require only 7-8 actual form fields.
• The average U.S. checkout displays 23.48 form elements by default.
• The average U.S. checkout includes 14.88 actual form fields, almost twice the ideal actual-field range.
• Baymard’s 2024 checkout-flow benchmark found an average of 5.1 checkout steps.
• The same benchmark found an average of 11.3 form fields, showing improvement in some flows but continued simplification opportunity.
UX quality, speed, and error benchmarks
• Baymard finds 64% of leading desktop ecommerce sites have mediocre or worse checkout UX.
• 63% of mobile ecommerce sites and 46% of mobile apps also rate mediocre or worse for checkout UX.
• Only 2% of desktop ecommerce sites and 2% of mobile ecommerce sites rate good for checkout UX in Baymard’s benchmark.
• Stripe found 95% of ecommerce sites make five or more basic checkout errors.
• Stripe’s European checkout research found 91% of European ecommerce sites had at least five basic checkout errors.
• Stripe found 60% of shoppers would abandon a purchase if checkout took more than two minutes.
• The average checkout still takes more than three minutes, according to Stripe.
• 17% of North American checkouts and 24% of European checkouts did not show a numeric keypad for card entry, according to Stripe.
Express checkout and saved-payment behavior
• Only 40% of North American sites supported one-click checkout in Stripe’s analysis.
• Only 34% of European ecommerce sites supported one-click checkout.
• 75% of North American consumers and 78% of European consumers were more likely to complete a purchase when one-click checkout was available.
• Stripe found 60% of North American sites did not let customers save payment details for one-click checkout.
• Wallet-based one-click payment is about three times faster than manually entering payment details, according to Stripe.
UX interpretation The most useful UX goal is not simply fewer fields. The goal is less unnecessary effort at each step: earlier cost visibility, better mobile keyboards, clearer error messages, reliable address entry, trusted payment presentation, and faster returning-customer checkout. Teams should review checkout time, form errors, mobile completion, and payment submission together because they often move together.
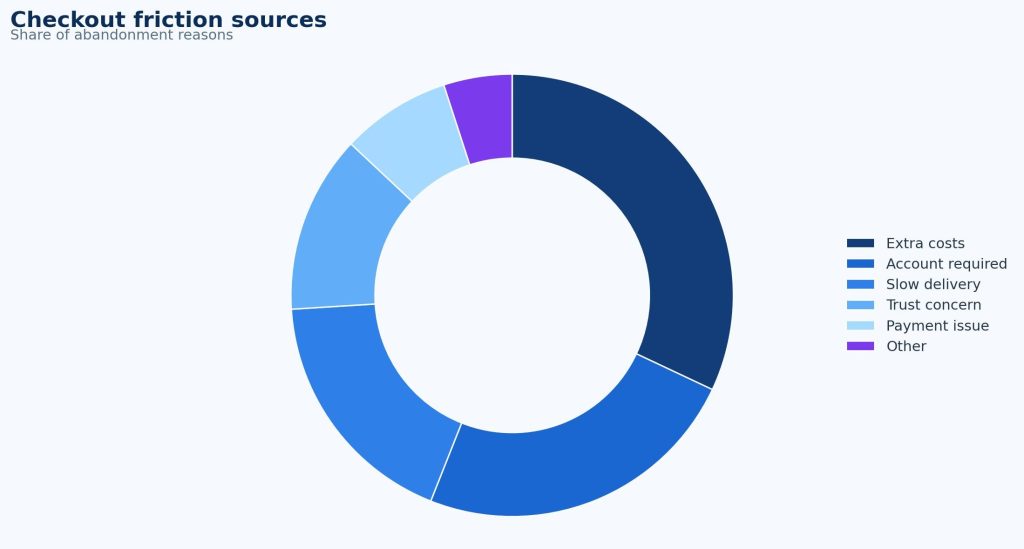
Figure 2. Checkout UX should be evaluated through form length, speed, errors, mobile behavior, and completion rate rather than a single design score.
Payment Choice: Conversion, Localization, and Profitability
Payment method availability is now a conversion variable. A checkout that accepts cards can still be poorly localized if shoppers expect wallets, bank payments, installments, invoice payment, or another local method.
Preferred-method and conversion benchmarks
• Stripe found 85% of customers said they would abandon checkout if their preferred payment method was unavailable.
• In North America, 81% of customers said they would frequently abandon when the preferred method was missing.
• In Europe, 86% of customers said they would frequently abandon when their preferred method was unavailable.
• Adyen reports 54% of shoppers will leave a store or abandon online checkout if they cannot use their preferred payment method.
• Baymard’s abandonment data shows 10% of U.S. shoppers abandon because there are not enough payment methods.
• Stripe’s payment-method experiment found a 12% average revenue increase from surfacing at least one relevant payment method beyond cards.
• The same experiment found an average 7.4% conversion-rate increase from adding relevant payment methods.
• Worldpay reports digital wallets reached 53% of global ecommerce value in 2024.
| Payment decision | What to compare | Why it matters |
|---|---|---|
| Add a wallet | Mobile completion, checkout time, authorization, repeat-customer conversion | Wallets reduce typing and can raise mobile completion. |
| Add BNPL | Conversion, AOV, fees, returns, disputes, customer lifetime value | Financing can lift orders but may change cost and risk. |
| Add local methods | Country conversion, payment approval, support tickets, refund behavior | Local payment habits vary sharply by market. |
| Optimize cards | Authorization, false declines, fraud rate, chargeback rate | Cards still drive large shares of spend in many markets. |
Payment-method rule Payment choice should not be managed as a feature checklist. The better question is which payment methods increase profitable completed orders in a specific market, device, and customer segment. A method that raises conversion but also raises disputes, refunds, or fees should be evaluated through margin quality, not only order count.
Mobile Wallets and Express Checkout
Mobile checkout is where payment strategy and usability become the same problem. Smartphones increase typing friction, while wallets and saved credentials can shorten address entry, card entry, authentication, and confirmation.
Mobile commerce and wallet scale
• Smartphones accounted for 56.4% of U.S. online holiday purchases in Adobe’s 2025 holiday data.
• Adobe reported $145.2 billion in U.S. mobile holiday spend, up 10.7% year over year.
• Worldpay reports smartphones’ share of global ecommerce spend rose from 19% in 2014 to 57% in 2024.
• Stripe notes mobile carts are abandoned at more than twice the rate of desktop carts.
• Baymard finds 63% of mobile ecommerce sites have mediocre or worse checkout UX.
• 46% of mobile apps still rate mediocre or worse for checkout UX.
• Digital wallets represented 53% of global ecommerce spend in 2024 and are projected to reach 65% by 2030.
• Wallet ecommerce value was about $3.6 trillion globally in 2024.
Wallet support gaps
• Stripe found 86% of North American checkouts did not support Apple Pay.
• Stripe found 93% of North American checkouts did not support Google Pay.
• The same research found 88% of North American sites did not support BNPL.
• Stripe found 96% of North American sites did not support real-time bank payments.
The mobile-wallet opportunity is practical: fewer keystrokes, faster confirmation, less address-entry friction, and stronger returning-customer flows. A mobile checkout review should test wallet button placement, saved address logic, keyboard behavior, autofill, payment error handling, and authentication success on real devices.
BNPL at Checkout: Order Lift and Risk
Buy now, pay later is both a conversion tool and a financing decision. The data supports BNPL’s ability to influence order size and spending behavior, but merchants should measure it with fees, returns, disputes, and customer quality included.
BNPL market and behavior benchmarks
• Financial Times coverage of Worldpay data reported global BNPL spending of $316 billion in 2023 after 18% annual growth.
• The same coverage reported the U.S. accounted for about $95 billion of BNPL spend.
• Worldpay data shows BNPL online spend grew from about $2.2 billion in 2014 to $342 billion in 2024.
• Reuters reported Adobe holiday data showing U.S. BNPL spend of $20.0 billion from Nov. 1 to Dec. 31, 2025.
• Adobe’s holiday data showed BNPL spending grew 9% year over year during the 2025 U.S. holiday period.
• A 2024 Journal of Retailing study found BNPL adoption increased online order size by 6.42%.
BNPL interpretation BNPL should be judged as incremental profitable demand, not just as a conversion lift. A careful scorecard compares conversion, average order value, provider fees, return rate, refund behavior, dispute rate, repeat purchase, and customer support issues against cards, wallets, and bank payments.
Regional Checkout Intelligence
Regional checkout data is one of the highest-value parts of a checkout statistics report. Global averages can hide large country differences in wallets, cards, bank payments, BNPL, authentication, and installment behavior.
North America
• The U.S. ecommerce market is above $1 trillion annually, making small checkout gains financially meaningful.
• Adobe reported $257.8 billion in U.S. online holiday spend in 2025, with smartphones accounting for 56.4% of purchases.
• Worldpay reports 67% of U.S. consumer spending across ecommerce and POS still came through credit, debit, and prepaid cards in 2024.
• U.S. digital wallets reached 39% of online spending in 2024, up from 15% in 2014.
• U.S. wallet use at POS expanded from 2% in 2014 to 16% in 2024.
• Worldpay reports 65% of Americans fund digital wallets with credit and debit cards, showing that wallets often sit on top of card economics.
Europe
• Digital wallets represented 33% of European ecommerce payment methods in 2024.
• European ecommerce payment mix also included debit/prepaid cards at 20%, credit cards at 19%, account-to-account payments at 17%, and BNPL/POS financing at 8%.
• Worldpay projects European ecommerce wallet share will reach 46% by 2030.
• Germany’s ecommerce payment mix included digital wallets at 35%, A2A at 26%, and BNPL at 20% in 2024.
• France’s ecommerce payment mix included digital wallets at 34% in 2024, while Italy’s ecommerce mix included wallets at 40%.
• Poland’s ecommerce payment mix was dominated by A2A at 70% in 2024, with a projected rise to 78% by 2030.
• Digital wallets led U.K. ecommerce payment methods with 40% share in 2024 and are forecast to reach 58% by 2030.
• Stripe’s European checkout research found 91% of European ecommerce sites had at least five basic checkout errors, while only 34% supported one-click checkout.
Asia-Pacific
• Worldpay reports China is the world’s largest ecommerce market and that digital wallets dominate its online payment mix.
• In China, wallets represented more than 80% of ecommerce transaction value in 2024.
• India’s UPI has made account-to-account payments a defining part of digital commerce behavior.
• Southeast Asian markets show heavy wallet adoption, especially in mobile-first ecommerce categories.
• Thailand, Vietnam, and Indonesia all require localized payment planning because wallet, bank-transfer, and cash-alternative expectations differ from card-heavy markets.
Latin America
• Brazil’s Pix has changed checkout expectations by making instant account-to-account payment mainstream.
• Latin American ecommerce often requires local cards, installments, cash alternatives, and bank-based methods alongside global wallets.
• Mexico, Colombia, Argentina, Chile, and Peru require country-specific testing because card behavior, installments, cash-payment alternatives, and bank transfer habits vary widely.
• For cross-border merchants, local payment fit can matter as much as translation or currency display because payment trust is part of localization.
| Region | Checkout implication |
|---|---|
| North America | Keep card performance strong while improving wallet and express-checkout coverage. |
| Europe | Localize for wallets, A2A, BNPL, and country-level payment expectations rather than one pan-European card flow. |
| Asia-Pacific | Treat wallets and mobile-first behavior as core checkout infrastructure, not optional add-ons. |
| Latin America | Plan for instant payments, installments, local cards, and cash/bank alternatives by country. |
Figure 3. Regional payment-method differences show why checkout localization should be measured by country, not only by global averages.
Payment Failure, Fraud, and Trust
A shopper can complete every form field and still fail to become a customer if payment is declined, authentication fails, fraud rules are too aggressive, or the checkout does not feel trustworthy. These metrics belong beside UX metrics because they directly affect conversion.
Authorization and false-decline benchmarks
• Checkout.com reports merchants lost $50.7 billion to false declines across the U.S., U.K., France, and Germany.
• Checkout.com also reports false-decline losses rose from about $20 billion in 2019 to $50.7 billion in the later study period.
• 45% of consumers in Checkout.com research said they would not retry a second payment after one false decline.
• 42% said they would never return to that retailer after a false decline.
• Baymard’s abandonment data shows 8% of U.S. shoppers abandon because their card was declined.
• Checkout.com has reported that some merchants see up to 5% of payments wrongly declined as fraud.
Fraud, chargebacks, and trust benchmarks
• Visa Acceptance/Cybersource’s 2025 fraud research is based on 1,000+ ecommerce merchants across 35+ countries.
• Merchant/payment-fraud research has estimated cumulative online-payment fraud losses of $343 billion between 2023 and 2027.
• Reported revenue lost to payment fraud fell from 3.6% in 2022 to 2.9% in 2023 in one merchant fraud benchmark.
• Mastercard-sponsored research cited by TechRadar estimates sellers could lose $15 billion to fraudulent chargebacks in 2025.
• The same coverage cited chargeback volume rising from $33.79 billion to $41.69 billion by 2028.
• Baymard reports 19% of U.S. shoppers abandon because they do not trust the site with card information.
Risk interpretation Fraud controls protect margin, but over-blocking can damage conversion and customer trust. A strong checkout scorecard reviews authorization, false declines, fraud, chargebacks, authentication challenges, and manual review together. That prevents teams from improving one risk metric while quietly rejecting good customers.
Abandoned Cart Recovery: Useful Signal, Not a Fix
Abandoned-cart recovery helps recover demand that did not convert the first time, but it should not replace checkout improvement. Recovery data is most valuable when it shows which shoppers still wanted to buy and what stopped them.
Recovery benchmarks
• Klaviyo’s 2024 abandoned-cart benchmark reported $3.65 average revenue per recipient.
• The same Klaviyo benchmark reported a 3.33% placed order rate for abandoned-cart flows.
• A later Klaviyo benchmark reported $3.07 revenue per recipient and a 2.68% placed order rate.
• Omnisend reported 42.02% of people who clicked an automated abandoned-cart message made a purchase.
• Recovery should be evaluated as incremental revenue after accounting for attribution overlap, discounting, and repeat reminders.
| Recovery signal | What it may reveal |
|---|---|
| Many shoppers recover only after discounts | Original checkout may be creating price or shipping-cost hesitation. |
| Recovered shoppers abandon again | The same payment, trust, delivery, or technical barrier may still exist. |
| Mobile recovery outperforms mobile checkout | Small-screen checkout may be too difficult even when purchase intent is real. |
| High-value carts recover differently | Financing, fraud review, delivery promises, or support access may need separate treatment. |
Checkout Revenue Leak Diagnostic
A polished checkout benchmark should help a team decide where to look next. The most useful structure is a short diagnostic model that connects statistics to action.
| Problem area | Core signals to measure | Useful benchmark from this report |
|---|---|---|
| Pricing and delivery | Extra-cost exits, shipping-cost exits, delivery-speed exits, discount-code errors | 39% abandon over extra costs; 21% abandon over slow delivery. |
| UX and mobile | Form errors, checkout time, mobile completion, keyboard behavior, step-level exits | Ideal checkout can be 7-8 fields; 60% abandon if checkout takes over two minutes. |
| Payment choice | Preferred-method abandonment, method-level conversion, wallet uptake, local-method adoption | 54% may abandon if preferred method is missing; relevant methods produced 12% revenue lift in Stripe testing. |
| Authorization | Approval rate, decline reason, retry success, false declines, fallback method usage | False declines cost $50.7 billion across four major markets. |
| Fraud and trust | Fraud rate, chargebacks, authentication challenge rate, manual-review rate, trust-related exits | 19% abandon because they do not trust the site with card information. |
| Recovery | Recovery revenue, placed order rate, discount dependency, repeat abandonment | Klaviyo reported $3.65 revenue per recipient in a 2024 abandoned-cart benchmark. |
Each metric belongs to a business question: are shoppers surprised by cost, slowed by UX, blocked by payment choice, rejected by authorization, worried about trust, or caught by fraud controls?
90-Day Checkout Benchmark Plan
Statistics become useful when they are translated into a measurement plan. A practical checkout review can be organized into a 90-day cycle rather than a vague redesign project.
| Timing | What to do | Output |
|---|---|---|
| Days 1-30 | Capture the baseline by device, country, step, payment method, decline reason, and recovery channel. | A clear map of where carts and checkout starts are lost. |
| Days 31-60 | Fix high-confidence leaks such as extra-cost visibility, mobile input errors, missing wallets, or confusing payment messages. | A short list of controlled tests and before/after metrics. |
| Days 61-90 | Review authorization, fraud, recovery, and regional-payment results so gains are not coming from higher risk or heavier discounting. | A repeatable scorecard for profitable completed orders. |
Planning principle The best checkout teams do not chase every benchmark. They compare external statistics against their own funnel, then prioritize leaks with high volume, clear ownership, and measurable financial impact.
Metrics Ecommerce Leaders Should Track
The final scorecard should be detailed enough to locate the leak without becoming a vanity dashboard. These metrics are the minimum useful set for a mature checkout review.
| Metric | Why it matters |
|---|---|
| Cart abandonment rate | Shows how much demand fails before order completion. |
| Checkout-start rate | Shows whether product/cart pages are moving shoppers into the final funnel. |
| Checkout completion rate | Shows how many checkout starts reach order confirmation. |
| Step-level drop-off | Separates delivery, account, address, payment, authentication, and confirmation exits. |
| Average checkout time | Tests whether checkout is approaching the two-minute abandonment threshold. |
| Form error rate | Shows where validation, address entry, or mobile inputs are slowing shoppers. |
| Payment-method conversion | Compares cards, wallets, BNPL, bank payments, invoice payment, and local methods. |
| Authorization rate | Shows approved payment value divided by submitted payment value. |
| False-decline rate | Captures legitimate customers wrongly rejected by issuer or fraud logic. |
| Fraud and chargeback rates | Protects margin while helping teams avoid excessive false positives. |
Online Checkout Statistics FAQ
Common questions
• What is the average cart abandonment rate?
Baymard’s documented benchmark is 70.22%, which means abandonment above 70% is common but still needs diagnosis by cause.
• What is the biggest reason shoppers abandon checkout?
Extra costs are the leading reason in Baymard’s U.S. data, with 39% citing shipping, taxes, or fees that were too high.
• How many checkout fields should an ecommerce checkout have?
Baymard says an ideal checkout may need only 7-8 actual form fields, although the right number depends on product, shipping, tax, and payment requirements.
• Do digital wallets improve checkout?
Wallets can reduce typing and speed up payment. Worldpay reports wallets represent 53% of global ecommerce value, while Stripe says wallet-based one-click payment is about three times faster than manual entry.
• How does BNPL affect online checkout?
BNPL can increase order size; a 2024 Journal of Retailing study found BNPL adoption increased online order size by 6.42%, but merchants should also review fees, returns, disputes, and customer quality.
• Which checkout metrics matter most?
The most useful scorecard combines cart abandonment, checkout completion, step-level drop-off, mobile completion, payment-method conversion, authorization rate, false declines, fraud, chargebacks, and recovery revenue.
Final Takeaway
Online checkout performance depends on five systems working together: pricing transparency, UX simplicity, payment choice, authorization quality, and fraud control. The statistics show that revenue loss can come from any one of those areas, so checkout should not be managed as a single page or a single blended conversion rate.
The most useful checkout analysis finds the actual leak. If shoppers leave when fees appear, the issue is cost visibility. If they leave during card entry, the issue may be wallet support, mobile input, or trust cues. If they complete the form but fail at payment, the issue may be authorization, local acquiring, retries, or risk rules. If they recover only after a discount, the original checkout may be creating price hesitation.
For ecommerce leaders, the main objective is to build a checkout system that is fast, reliable, localized, measurable, and financially secure. This includes reducing unnecessary form fields, providing transparent delivery and pricing details, supporting local payment methods, improving mobile wallet experiences, managing failed payments more effectively, and implementing fraud prevention measures that protect the business without blocking legitimate customers. In industries that handle recurring property or equipment payments, using a well-structured rental invoice can further improve payment tracking, financial organization, and customer trust throughout the checkout and billing process.