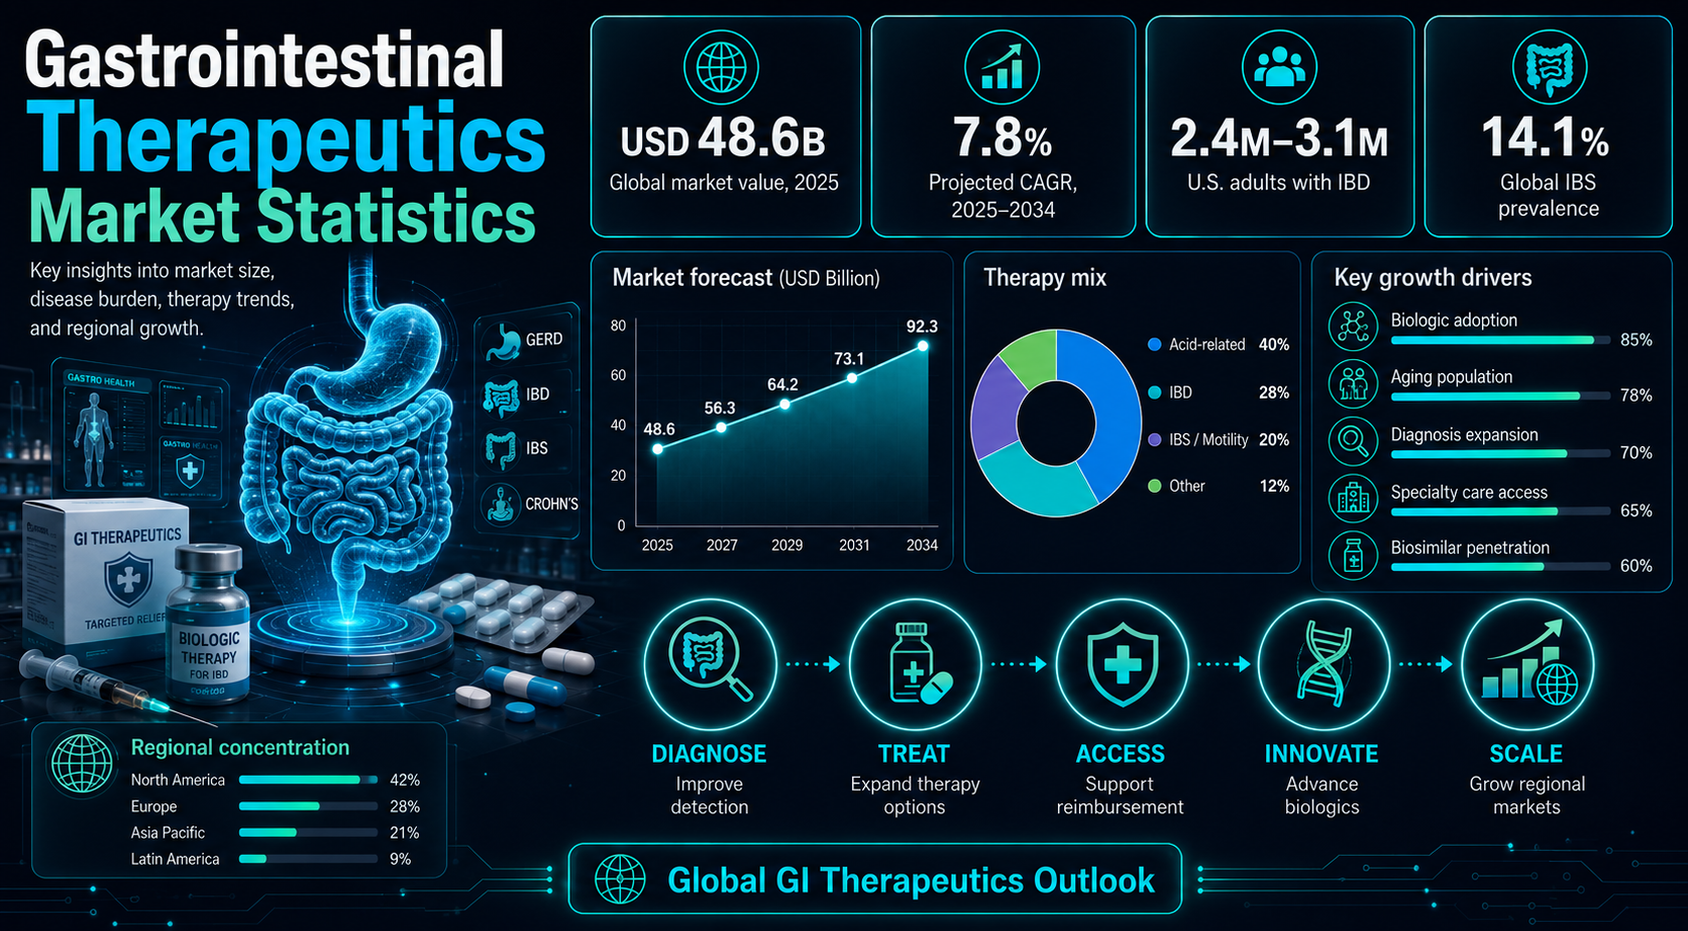
Gastrointestinal therapeutics is where digestive-disease burden, chronic care demand, specialty-drug access, and regional healthcare capacity meet. The category now covers acid-related disorders, inflammatory bowel disease, irritable bowel syndrome, constipation, diarrhea, peptic ulcer disease, GI infections, colorectal cancer support, pancreatic enzyme therapy, biologics, biosimilars, and specialty digestive care. This makes the market useful for both commercial planning and clinical access analysis, because each statistic points to a different question about diagnosis, treatment intensity, reimbursement, regional access, or long-term patient management.
The strongest statistics show why this market deserves its own scorecard. GMI estimated the global gastrointestinal therapeutics market at USD 42.5 billion in 2024, with a long-range forecast of USD 74.8 billion by 2034. The same market story also includes a 5.9% CAGR, high-volume GERD and IBS demand, and specialty growth tied to biologics and biosimilars.
This report is organized for scanning. Each section starts with a short explanation, then presents curated benchmark bullets, followed by a concise interpretation block, chart, or planning table where it helps. The goal is to show which statistics actually help pharma, healthcare, payer, and regional market teams understand where treatment demand is changing.
Executive Gastrointestinal Therapeutics Benchmarks
These are the statistics that frame the article. They show the market scale, the patient-burden base, the shift toward specialty therapies, and the difference between broad digestive-drug volume and high-value gastrointestinal care.
The benchmark set should be read as a market map, not as a single growth claim. The article uses the strongest numbers to separate scale, patient burden, therapy value, regional access, and specialty-drug momentum Market-size figures show that GI therapeutics is already a large established category rather than a narrow niche. Disease-burden figures explain why demand is persistent across common and complex digestive conditions. Regional and country figures show why access, reimbursement, and diagnosis can change the commercial meaning of the same therapy area.
The numbers that define the GI therapeutics market
• GMI placed the global gastrointestinal therapeutics market at USD 42.5 billion in 2024.
• The same forecast reaches USD 74.8 billion by 2034.
• A 5.9% CAGR from 2025 to 2034 points to steady long-term expansion rather than a short spike.
• Specialty care is already a major part of the market. Biologics and biosimilars generated USD 19.6 billion in 2024 and are projected to reach USD 36.1 billion by 2034.
• One segmentation placed IBD at 56.2% of the gastrointestinal therapeutics market.
• Retail pharmacies hold 46.6% of the market in one 2024 split, showing how much everyday treatment volume still flows through community and repeat-prescription channels.
• In the United States, digestive diseases affect an estimated 60 to 70 million people.
• CDC estimates U.S. IBD prevalence at 2.4 million to 3.1 million people, while a 2023 study estimated 2.390 million diagnosed Americans with IBD.
• IBS remains a major functional-disorder driver. A 2025 systematic review reported 14.1% global IBS prevalence across studies covering 52 countries.
• Colorectal cancer adds an oncology-linked treatment layer, with WHO estimating 1.9 million new cases and more than 900,000 deaths worldwide in 2022.
• Fact.MR projects CAGRs of 7.8% for China, 7.2% for India, 7.0% for South Korea, and 6.7% for Brazil through 2036.
Why GI Therapeutics Now Carries Multi-Billion-Dollar Stakes
Market-size statistics matter because the category combines very different commercial layers:
• Routine digestive medicines that depend on volume, distribution, affordability, and repeat use.
• Specialty therapies that carry higher annual treatment value and require specialist diagnosis, payer approval, and monitoring.
• Therapies such as PPIs, laxatives, antiemetics, biologics, and pancreatic enzymes that behave differently even when grouped under GI therapeutics.
• GMI shows the market moving from USD 36.3 billion in 2021 to USD 42.5 billion in 2024, with USD 44.7 billion expected in 2025.
• The same path places the market near USD 59.5 billion by 2030, USD 66.8 billion by 2032, and almost USD 74.8 billion by 2034.
• The growth curve is not explosive, but it is durable because long-term patient need supports repeat treatment demand.
• Some models include broad digestive drug categories, while others focus on prescription therapeutics or advanced treatment classes.
• Fortune Business Insights estimated a larger USD 80.6 billion value for 2025, while Grand View Research estimated USD 42.75 billion.
• The spread is a reminder to define the market boundary before using any single number in strategy.
• Reflux, constipation, IBS, IBD, ulcer disease, pancreatic insufficiency, and cancer-supportive care do not rise and fall together.
• Generic pressure in one product class can be offset by diagnosis growth, guideline changes, or specialty-drug adoption in another.
• The strongest message is that GI therapeutics is broad enough for market-level growth but still highly segment-specific.
• The important point is that several independent estimates place GI therapeutics in a large, established, steadily growing market.
• The growth story is broad enough to support market-level planning, but the highest-value opportunities remain segment-specific.
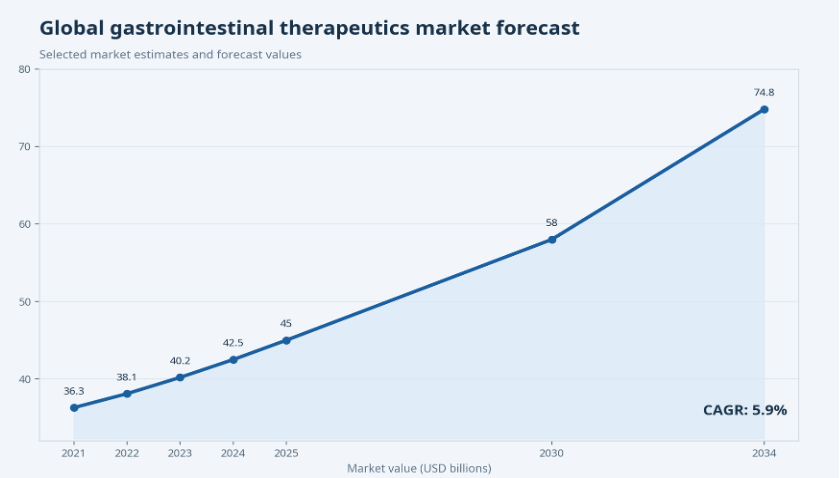
Figure 1. The forecast curve shows steady market expansion from a large existing base, which is why small changes in access, diagnosis, and specialty-drug adoption can create meaningful commercial impact.
Digestive Disease Burden: Where Treatment Demand Starts
Disease burden is the demand engine behind the GI therapeutics market. The reference-style way to read this section is to separate high-volume everyday conditions from smaller but higher-intensity specialty conditions.
A human reading of the disease data should separate three layers of demand:
• Broad symptom demand, where many patients use low-cost or repeat therapies for reflux, constipation, diarrhea, or abdominal discomfort.
• Specialist demand, where IBD, severe motility disorders, pancreatic insufficiency, or cancer-related digestive care require referral and monitoring.
• Access-sensitive demand, where patients may have symptoms but do not enter the market because diagnosis, coverage, affordability, or specialist access is weak.
Disease signals worth separating
• GERD and acid-related disorders create the broadest repeat-use base, with about 20% of people in the United States affected by GERD and strong demand for PPIs, H2 blockers, antacids, and antiulcer drugs.
• IBD is a smaller patient pool than GERD or IBS, but CDC estimates 2.4 million to 3.1 million U.S. adults live with the condition, making it one of the clearest specialty-drug demand signals in the market.
• A 2023 Gastroenterology study estimated 2.390 million diagnosed Americans with IBD, including 1.253 million with ulcerative colitis and 1.01 million with Crohn’s disease.
• IBD treatment intensity is high because many patients require corticosteroids, immunomodulators, anti-TNF therapy, JAK inhibitors, biologics, biosimilars, monitoring, and specialist follow-up.
• CDC estimated annual U.S. healthcare costs for IBD at about USD 8.5 billion in 2018; that cost signal explains why IBD carries more commercial weight than patient count alone suggests.
• IBS is a different demand layer: a 2025 systematic review reported 14.1% global prevalence across 96 articles and 52 countries, supporting recurring demand for symptom management rather than high-cost specialty therapy.
• Peptic ulcer disease, H. pylori treatment, and GI infections keep antibiotics and acid suppression relevant, even when incidence trends vary by age, geography, prevention, and treatment access.
• Colorectal cancer adds hospital and supportive-care demand; WHO estimated 1.9 million new cases and more than 900,000 deaths worldwide in 2022.
How to use the disease-burden data
The useful reading is not that every digestive condition grows in the same way. The stronger market view is to follow how a patient moves from common symptoms to diagnosis, repeat treatment, specialist referral, and advanced care.
• Common symptoms such as reflux, abdominal pain, constipation, diarrhea, bleeding, or unexplained weight loss often create the first treatment entry point.
• Some patients remain in retail or primary-care channels, while others move toward gastroenterology clinics, imaging, biologics, surgery, oncology support, or long-term monitoring.
• Diagnosis rates matter as much as prevalence because testing, referral, insurance coverage, specialist availability, and pharmacy access determine the addressable market.
For market teams, the disease-burden section should translate into three practical questions:
• Which conditions create reliable repeat volume through retail, primary care, and chronic prescription refills?
• Which conditions move patients into high-value specialty pathways such as biologics, biosimilars, pancreatic enzymes, infusion support, or hospital-based care?
• Which countries have enough diagnosis, reimbursement, specialist access, and pharmacy coordination to turn patient prevalence into treated demand?
This lens keeps the article close to the reference rhythm: the statistics are not listed for volume alone; they explain where market value forms, where access limits growth, and where commercial strategy should change by condition or country.
This is why GI therapeutics should be measured as both a volume market and a specialty-care market. GERD and IBS explain breadth; IBD, pancreatic disease, oncology support, and severe inflammatory conditions explain value.
| Condition | Human market reading | Treatment demand |
|---|---|---|
| GERD and acid reflux | Large chronic patient pool, high repeat use, and strong retail/prescription overlap | PPIs, H2 blockers, antacids, lifestyle-linked chronic care |
| IBD | Smaller patient pool but high treatment value and long-term specialist care | Biologics, biosimilars, immunosuppressants, corticosteroids |
| IBS | High prevalence with recurring functional symptoms and patient self-management | Antispasmodics, laxatives, antidiarrheals, motility therapies |
| Peptic ulcer disease | Improved outcomes but persistent infection and acid-related treatment need | Antibiotics, PPIs, ulcer prevention and follow-up therapy |
| Colorectal cancer | High global burden and significant supportive-care needs | Antiemetics, diarrhea/constipation management, oncology-linked GI support |
| Celiac disease | About 2 million U.S. patients and around 1% global prevalence in key estimates | Diagnosis, diet management, symptom support, monitoring |
Therapy Areas Defining the GI Therapeutics Market
Therapy-area analysis keeps the market story clear. Acid suppression, IBD management, motility therapy, infection treatment, oncology support, and enzyme replacement each have different users, payment pathways, and growth logic. A mature market view separates those layers before comparing regional opportunity.
This section should also keep high-volume and high-value therapy areas separate. Reflux, constipation, and diarrhea therapies often depend on repeat use and broad pharmacy availability, while IBD, pancreatic enzyme therapy, and oncology support depend more on diagnosis, referral, and long-term care coordination.
That split is why therapy-area charts should not be read as simple popularity rankings. They are better used to show which parts of the market depend on everyday access and which depend on specialist-managed clinical pathways.
Therapy-area demand is easier to read when each group is separated:
• Acid-related therapeutics such as PPIs, H2 blockers, antacids, and antiulcer agents draw value from scale and repeat need.
• IBD therapeutics are shaped by clinical severity, relapse risk, biologic sequencing, biosimilar substitution, route of administration, and payer approval.
• That is why IBD can lead value share even though GERD and IBS affect broader populations.
• Constipation, diarrhea, and IBS therapies matter to pharmacy channels, primary care, gastroenterology clinics, and patient quality of life.
• Anti-infective GI treatments, especially H. pylori-related therapy, often work alongside acid suppression.
• Pancreatic enzyme therapy and liver-linked digestive care sit closer to specialty chronic management, where adherence and access are central.
GERD and constipation categories often grow through repeat use, OTC availability, and primary-care prescribing.
• IBD and advanced inflammatory conditions grow through specialist diagnosis, therapy escalation, and wider use of biologics or biosimilars.
• Oncology-linked digestive care grows with screening, cancer incidence, and supportive-care needs.
• The market behaves like a layered portfolio: high-volume symptom relief at the base, chronic disease management in the middle, and high-value specialty care at the top.
A stronger analysis should therefore avoid presenting all GI therapies as one single pipeline. The market behaves more like a layered portfolio: high-volume symptom relief at the base, chronic disease management in the middle, and high-value specialty care at the top. That layered structure is what makes the category commercially resilient.
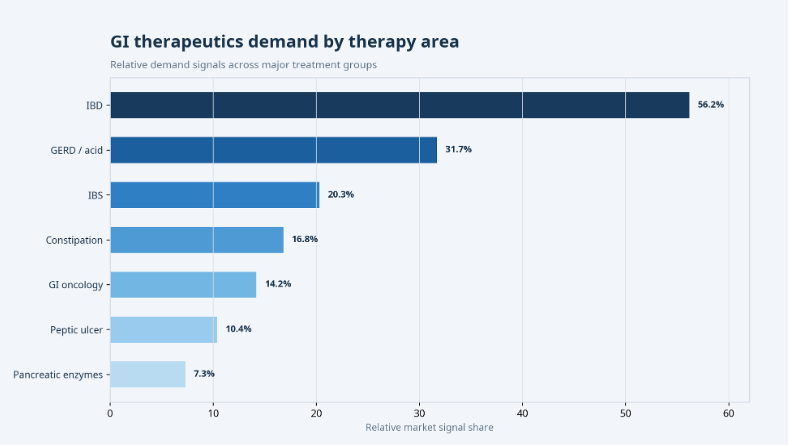
Figure 2. Therapy areas should be read as different demand pools: some represent market share, some represent prevalence pressure, and others represent growth or specialty-care signals.
Drug Class and Treatment Segment Statistics
Drug-class statistics explain how the market converts disease burden into revenue. Proton pump inhibitors, H2 blockers, antacids, laxatives, antidiarrheals, antiemetics, antibiotics, aminosalicylates, corticosteroids, immunomodulators, biologics, biosimilars, and pancreatic enzymes do not compete in the same way. Some are mature and genericized. Others are specialist-prescribed and shaped by patents, biosimilars, and clinical sequencing.
Biologics and biosimilars are the clearest specialty value pool:
• Their USD 19.6 billion 2024 revenue and projected USD 36.1 billion 2034 value show advanced treatment becoming more central.
• The 6.4% CAGR attached to this segment is higher than many mature symptom-relief categories.
• The segment benefits from chronic disease burden, therapy escalation, and specialist-led prescribing.
| Drug class | Main use | Market role |
|---|---|---|
| Proton pump inhibitors | GERD, ulcers, and acid-related disorders | High-volume chronic and retail/prescription category |
| H2 receptor antagonists | Acid control and alternative reflux treatment | Mature symptom-control category |
| Biologics | IBD and inflammatory disease | High-value specialty care and long-term disease control |
| Biosimilars | IBD cost control and access expansion | Pricing pressure and broader specialty adoption |
| Laxatives | Constipation and IBS-C | Retail and chronic symptom-management demand |
| Antidiarrheals | Acute diarrhea and IBS-D | Symptom control across retail and prescription settings |
| Antiemetics | Nausea and vomiting, including oncology support | Hospital, oncology, and acute-care relevance |
| Antibiotics | H. pylori and GI infections | Protocol-driven infectious disease treatment |
| Pancreatic enzymes | Pancreatic insufficiency | Chronic specialty therapy with adherence needs |
Regional Gastrointestinal Therapeutics Intelligence
Regional analysis is a crucial component of any gastrointestinal therapeutics market assessment, as the commercial impact of the same disease can vary significantly across healthcare systems. Factors such as diagnosis rates, access to specialists, reimbursement policies, availability of biologics, biosimilar regulations, pharmacy infrastructure, and patient affordability can all influence market potential. Understanding these regional differences helps stakeholders evaluate opportunities more effectively, much like using a construction invoice to clearly organize and assess project-related costs.
Regional data should be read as a market-access map rather than a simple ranking:
• North America is strongest where specialty prescribing, payer systems, and advanced biologic access are already mature.
• Europe requires closer attention to biosimilar substitution, reimbursement rules, public procurement, and national prescribing habits.
• Asia Pacific carries the strongest patient-volume story, but diagnosis expansion and affordability decide how quickly that volume becomes treated demand.
• Latin America, the Middle East, and Africa can still be strategically important where private healthcare, hospital access, and specialist networks are improving.
North America
North America remains the largest and most developed revenue pool in the available estimates:
• One GMI view placed North America at USD 17.8 billion in 2024 and forecast USD 30.7 billion by 2034 at a 5.6% CAGR.
• Another 2025 split placed the region at USD 30.05 billion and 35.51% global share.
• The commercial logic is strong diagnosis, high spending, specialty access, and payer complexity.
• High diagnosis rates and specialist care.
• Strong biologic adoption and insurance-driven treatment pathways.
• Substantial pharmaceutical spending.
• Added complexity from prior authorization, step therapy, specialty pharmacy coordination, and out-of-pocket exposure.
Europe
Europe is a large and policy-sensitive GI therapeutics market:
• One estimate placed Europe at USD 21.81 billion in 2025, or 25.77% of global demand, with a 5.31% CAGR.
• 2026 country forecasts included USD 5.30 billion for the U.K., USD 4.78 billion for Germany, and USD 3.53 billion for France.
• Public coverage, biosimilar adoption, and prescribing practice make Europe a distinct access and pricing environment.
• Public systems often push for cost control while maintaining clinical access.
• Biosimilars can reduce healthcare-budget pressure and widen treatment availability.
• They can also reshape branded biologic revenue and create a dedicated pricing lens.
Asia Pacific
Asia Pacific matters because patient volume and healthcare access are expanding together:
• One 2025 estimate placed the region at USD 20.95 billion, or 24.76% of global market share.
• The 2026 forecast reached USD 22.3 billion.
• Country forecasts placed China at USD 4.13 billion and India at USD 4.03 billion in 2026.
• Fact.MR also projected strong country CAGRs through 2036: 7.8% for China, 7.2% for India, and 7.0% for South Korea.
• China benefits from urban hospital expansion and healthcare modernization.
• India combines large patient volume with improving pharmaceutical distribution and private-sector access.
• South Korea has advanced healthcare standards and regulatory clarity that support faster adoption of some advanced therapies.
Latin America, Middle East, and Africa
Latin America, the Middle East, and Africa are smaller revenue pools but still strategically relevant:
• Latin America recorded USD 3.44 billion in 2025 and 4.06% of global market share, with a 2026 projection of USD 3.56 billion.
• The Middle East & Africa generated USD 2.61 billion in 2025, equal to 3.08% of global revenue, with USD 2.68 billion projected for 2026.
• Brazil remains a standout country because Fact.MR projects a 6.7% CAGR through 2036.
• Demand rises as diagnosis improves, private healthcare grows, and distribution becomes more reliable.
• Advanced therapies may remain constrained by affordability and reimbursement.
• Market potential can be high even when realized revenue remains lower than disease burden suggests.
| Region | Market signal | Strategic implication |
|---|---|---|
| North America | Largest spending pool and high specialty adoption | Focus on biologics, IBD, payer access, and specialty pharmacy execution |
| Europe | Large public-system market with biosimilar and reimbursement influence | Balance innovation with pricing pressure and country-specific access |
| Asia Pacific | Large patient base and faster growth in China, India, and South Korea | Build diagnosis, access, affordability, and local distribution strategy |
| Latin America | Smaller share but improving access and Brazil growth | Localize pricing, patient support, and distribution |
| Middle East & Africa | Developing specialist access and hospital-centered care | Use hospital and specialist partnerships to widen access |
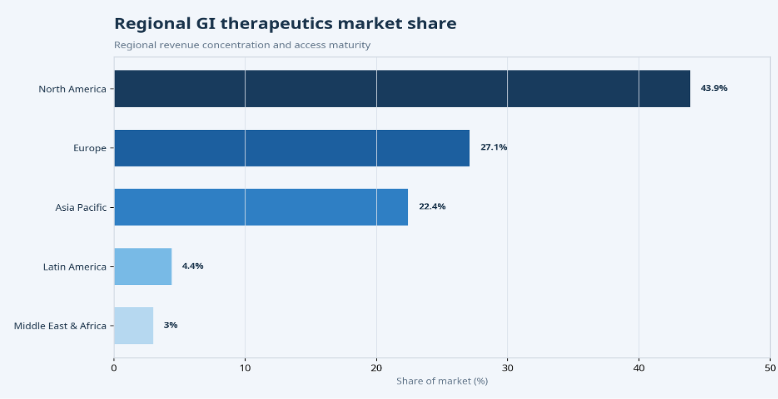
Figure 3. Regional share highlights the concentration of current value in North America and the growing importance of Europe and Asia Pacific.
Country-Level GI Therapeutics Market Statistics
Country-level statistics are most useful when they explain how patient burden turns into treated market value. The section should compare demand, reimbursement, specialist access, pharmacy coordination, and biologic availability by country rather than treating every region as one blended market.
Country-level analysis should also separate patient volume from realized commercial value. A country can have a large population and rising digestive symptoms but still produce lower revenue if diagnosis, specialist access, reimbursement, and pharmacy coverage are limited.
The useful country question is not only which market is largest. It is which markets combine disease burden, treatment access, payer support, and prescription infrastructure well enough to support sustained therapy uptake.
| Country / market | Key statistic or signal | Why it matters |
|---|---|---|
| United States | 60 to 70 million people affected by digestive diseases | Largest single-country demand pool; strongest specialty and payer complexity |
| United Kingdom | USD 5.30 billion forecast for 2026 | NHS-led chronic care market with IBD and colorectal pathways |
| Germany | USD 4.78 billion forecast for 2026 | Large pharmaceutical base and specialist-care infrastructure |
| France | USD 3.53 billion forecast for 2026 | Meaningful European value pool with specialist access |
| China | Projected 7.8% CAGR through 2036 | Patient-volume growth tied to diagnosis and hospital expansion |
| India | Projected 7.2% CAGR outlook | Large diagnosed and untreated population; affordability shapes uptake |
| Brazil | Projected 6.7% CAGR through 2036 | Strong Latin American growth signal for GERD, IBD, and specialty care |
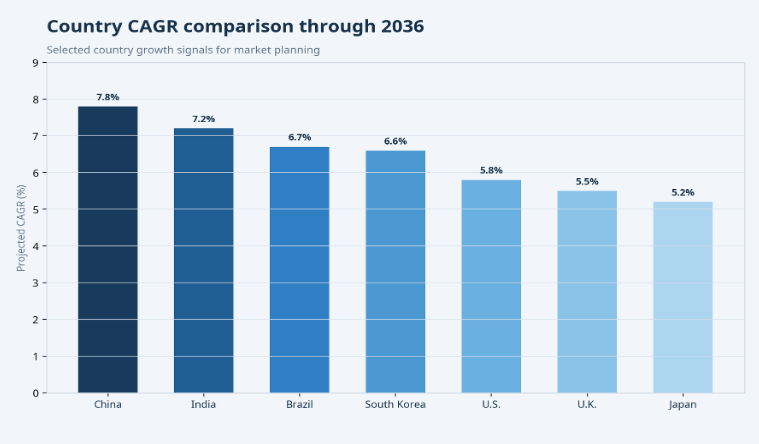
Figure 4. Country CAGR comparison shows why China, India, South Korea, and Brazil deserve separate market planning rather than a single regional footnote.
Distribution Channel and Access Trends
Distribution channels reveal the difference between everyday digestive therapy and advanced specialty care. Retail pharmacies are central to GERD, constipation, diarrhea, and chronic refill behavior. Hospital pharmacies and specialty pharmacies become more important when patients require biologics, injectable formulations, oncology support, or severe disease management.
Several channel statistics show how the market reaches patients:
• Retail pharmacies held 46.6% of the global gastrointestinal therapeutics market in one 2024 split and are projected to reach USD 34.6 billion by 2034.
• Hospital pharmacies accounted for 45.21% in one distribution view, reflecting acute care, complex cases, oncology support, and inpatient or infusion-linked therapies.
• Specialty channels matter most where biologics, injectables, pancreatic enzymes, and advanced IBD therapies require authorization and monitoring.
| Channel | Best fit | Market importance |
|---|---|---|
| Retail pharmacy | GERD, constipation, diarrhea, repeat chronic medicines | Supports high-volume access and everyday therapy use |
| Hospital pharmacy | Severe GI disease, oncology support, inpatient complications | Important for acute care and complex disease management |
| Specialty pharmacy | Biologics, biosimilars, advanced IBD therapy | Controls high-value access, adherence, and payer coordination |
| Online pharmacy | Repeat prescriptions and convenience-driven refills | Smaller today but useful for chronic therapy continuity |
| Gastroenterology clinics | Diagnosis, treatment initiation, monitoring, escalation | Connects patients to specialist therapy pathways |
Biologics, Biosimilars, and Specialty GI Innovation
Specialty innovation is the part of the GI therapeutics market most likely to change competitive dynamics. Biologics and biosimilars have already become a major revenue pool, with USD 19.6 billion generated in 2024 and USD 36.1 billion projected by 2034. Their 6.4% CAGR indicates that advanced therapy is growing faster than some broad-market estimates.
The specialty-care layer changes how the market should be valued:
• Biologics can raise market value even when the treated population is smaller than reflux or constipation populations.
• Biosimilars can improve access while also pressuring branded revenue, so volume growth and price movement need to be read together.
• Microbiome and personalized-treatment approaches are still selective, but they show how GI therapy is moving toward more targeted disease control.
The reason is clinical. IBD patients may require long-term control of inflammation, prevention of relapse, hospitalization reduction, surgery avoidance, and quality-of-life improvement.
That creates demand for anti-TNF therapies, interleukin inhibitors, JAK inhibitors, immunomodulators, corticosteroid-sparing approaches, and biosimilars. As more patients are diagnosed and escalated to advanced treatment, specialty pharmacy and payer management become more important.
Biosimilars and microbiome innovation add another layer to specialty GI strategy:
• Biosimilars can widen access when payer systems, physicians, and patients are comfortable with switching or initiation.
• They also create revenue pressure for originator brands and raise the importance of outcomes, support, formulation, delivery, and evidence.
• Microbiome-based therapeutics remain specialized, but one projection shows a 4.33% CAGR through 2031.
• This points to a broader shift from symptom relief to disease-modifying and ecosystem-based treatment concepts.
novation is also changing how value is measured:
• Traditional GI medicines are often evaluated through symptom relief, affordability, and repeat use.
• Advanced GI therapies are judged through remission rates, steroid-sparing effects, and safety monitoring.
• Hospitalization reduction, surgery avoidance, and persistence on therapy also shape specialty value.
• Growth is strongest when the health system can support diagnosis, access, monitoring, adherence, and outcomes evidence.
A closer strategic read of the data should therefore treat innovation as a commercial and clinical bridge. Newer therapies can increase market value, but they also raise the need for payer evidence, patient-selection tools, specialist education, and longer-term monitoring. Growth in advanced GI therapeutics is strongest when the health system can support that full care pathway.
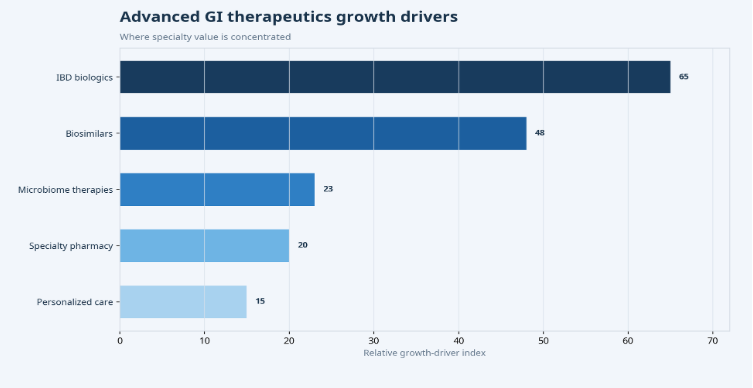
Figure 5. Advanced therapy and innovation metrics show how value is moving toward biologics, biosimilars, injectables, microbiome approaches, and specialist-led treatment pathways.
What the Statistics Mean for Market Stakeholders
For pharmaceutical manufacturers, the statistics point to two different operating models:
• Mature categories require volume, distribution, brand trust, and cost control.
• Specialty categories require evidence, access strategy, payer engagement, adherence support, and clinical positioning.
• Treating the whole GI market as one product landscape can weaken investment priorities.
• Recurrent reflux may need a different pathway from persistent abdominal pain or inflammatory symptoms.
• Colorectal cancer risk changes the urgency of referral and screening.
• IBD cost, IBS prevalence, and colorectal cancer mortality show that GI symptoms should not always be treated as low-risk or temporary.
• Biologics and biosimilars can improve outcomes but can also increase pharmacy budgets if unmanaged.
• Underdiagnosis or delayed treatment may raise downstream costs through emergency visits, hospitalization, surgery, and productivity loss.
• The market value is tied to patient outcomes, not just drug spending.
For regional market teams, the data makes localization unavoidable. North America rewards specialty access and payer execution. Europe requires biosimilar and reimbursement planning. Asia Pacific rewards access expansion, diagnosis, and distribution. Latin America and MEA require affordability, hospital partnerships, and gradual access building. The same product can have very different commercial logic across these regions.
For manufacturers, payers, and providers, these challenges do not all carry the same weight. Mature markets may be more exposed to patent expiry, biosimilar substitution, prior authorization, and pricing negotiation.
Faster-growing markets may have stronger patient-volume potential but weaker diagnostic coverage, uneven specialist access, and affordability barriers. That is why the same GI therapy can require different market assumptions by country.
The most practical way to read the challenge data is to separate demand barriers from access barriers. Demand barriers include underdiagnosis, delayed referral, symptom normalization, and low screening. Access barriers include reimbursement limits, out-of-pocket cost, fragmented distribution, and limited specialty care. Both can restrict growth, but they require different strategic responses.
Market Challenges, Pricing Pressure, and Access Gaps
The market is growing, but the statistics should not be read as a guarantee of equal patient access:
• Advanced therapies can expand revenue while increasing payer scrutiny.
• Biosimilars can widen access while compressing branded prices.
• Diagnosis growth can expand treatment demand while exposing specialist shortages.
• The most practical approach is to separate demand barriers from access barriers.
• High biologic cost can slow advanced therapy uptake even when clinical need is clear.
• Reimbursement delays, prior authorization, and step therapy can delay treatment escalation.
• Underdiagnosis, low screening, fragmented distribution, and limited specialty care can prevent high-burden patients from reaching appropriate therapy.
• Adherence gaps matter because many GI therapies require ongoing treatment and monitoring.
| Challenge | Why it matters | Likely impact |
|---|---|---|
| High biologic cost | Limits access and increases payer review | Slower specialty adoption without strong reimbursement |
| Underdiagnosis | Patients remain untreated or treated only for symptoms | Lower realized demand despite high disease burden |
| Patent expiry | Reduces branded exclusivity | More biosimilar and generic competition |
| Reimbursement pressure | Affects advanced therapy uptake | More price negotiation and step therapy |
| Antibiotic resistance | Complicates infection treatment | Need for better protocols and stewardship |
| Adherence gaps | Chronic symptoms return or disease control weakens | More relapse, monitoring, and recurring care |
GI Therapeutics Market Diagnostic
A useful diagnostics table turns the statistics into a planning tool. Each metric should answer a market question and point to an owner, whether that owner is a brand team, market access team, medical affairs group, payer strategy group, or regional commercial team.
| Problem area | Core signals to measure | Useful market question |
|---|---|---|
| Disease burden | Prevalence, diagnosis rate, treatment rate | Is demand rising because more patients are being diagnosed and treated? |
| Specialty growth | Biologic share, biosimilar uptake, IBD escalation | Are advanced therapies expanding market value? |
| Access | Reimbursement, affordability, pharmacy availability | Can patients actually receive newer therapies? |
| Regional expansion | Country CAGR, healthcare investment, distribution depth | Which markets are moving fastest and why? |
| Competition | Biosimilars, generics, patent expiry | Where is pricing pressure increasing? |
| Outcomes | Adherence, relapse, hospitalization, surgery avoidance | Are therapies reducing long-term disease burden? |
90-Day GI Therapeutics Market Intelligence Plan
| Timing | What to do | Output |
|---|---|---|
| Days 1-30 | Map disease burden, market size, therapy classes, channels, and current access limits | Baseline opportunity map by disease area and region |
| Days 31-60 | Compare regions, countries, distribution channels, and reimbursement barriers | Priority market list with patient and access logic |
| Days 61-90 | Review pricing, biosimilars, biologics, innovation, and patient outcomes | Strategic opportunity scorecard for commercial planning |
Metrics Pharma and Healthcare Leaders Should Track
The final scorecard should be specific enough to locate opportunity without becoming a vanity dashboard. Market size and CAGR are useful, but they do not explain access, clinical need, or product mix by themselves.
A balanced scorecard should connect commercial indicators with patient-access indicators. Market size and CAGR show scale, but diagnosis rate, treatment rate, reimbursement coverage, and biologic access show whether that scale can turn into actual therapy use.
The best metric set should also separate mature products from specialty therapies. A retail-heavy PPI category needs different tracking from an IBD biologic category that depends on specialist referral, payer approval, monitoring, and long-term adherence.
| Metric | Why it matters |
|---|---|
| Market size | Total commercial opportunity and category scale |
| CAGR | Growth pace, but should be compared with access and disease burden |
| Disease prevalence | Explains the underlying patient base |
| Diagnosis rate | How much of the patient pool is addressable |
| Treatment rate | Measures actual therapy use rather than theoretical need |
| Biologic adoption | Tracks specialty market growth and IBD escalation |
| Biosimilar penetration | Pricing pressure and access expansion |
| Regional market share | Identifies where current value is concentrated |
| Country growth rate | Shows expansion markets that may deserve deeper investment |
| Pharmacy channel share | Explains how treatments reach patients |
| Reimbursement coverage | Affects uptake and affordability |
| Hospitalization and relapse rates | Show whether treatment is reducing long-term burden |
Gastrointestinal Therapeutics Market Statistics FAQ
What is the gastrointestinal therapeutics market?
The gastrointestinal therapeutics market includes medicines used to treat or manage digestive disorders such as GERD, IBD, IBS, constipation, diarrhea, peptic ulcer disease, GI infections, pancreatic insufficiency, and oncology-linked digestive symptoms. It includes both high-volume symptom-control drugs and high-value specialty therapies.
How big is the gastrointestinal therapeutics market?
GMI estimated the market at USD 42.5 billion in 2024 and forecast USD 74.8 billion by 2034. Other publisher estimates vary because they define the category differently, with 2025 estimates ranging from about USD 41.94 billion to USD 80.6 billion.
What is driving GI therapeutics market growth?
Growth is driven by chronic digestive disease burden, higher diagnosis rates, aging populations, GERD and IBS prevalence, IBD biologic use, biosimilar adoption, expanding healthcare access in Asia Pacific, and better specialist care in mature markets.
Which disease areas dominate the market?
IBD is a major value driver, with one segmentation placing it at 56.2% market share. GERD and acid-related disorders create broad volume, while IBS, peptic ulcer disease, GI infections, colorectal cancer support, and pancreatic enzyme therapy add additional demand pools.
Why is IBD important in this market?
IBD is important because it combines chronic disease burden with high-value treatment. CDC estimates 2.4 million to 3.1 million U.S. adults with IBD, and biologics/biosimilars generated USD 19.6 billion in 2024 with a forecast of USD 36.1 billion by 2034.
Which region leads the gastrointestinal therapeutics market?
North America leads in several market views. One 2025 regional split placed North America at 42.32% of global revenue, supported by high spending, diagnosis rates, specialist access, and biologic adoption.
Which region is growing fastest?
Asia Pacific is one of the strongest growth regions because of large patient populations, improving healthcare access, and expanding diagnosis. Fact.MR projects 7.8% CAGR for China and 7.2% for India through 2036.
How are biologics changing GI therapeutics?
Biologics are shifting the market toward specialty care, especially in IBD. They increase treatment value, require more payer management, and create demand for specialty pharmacy coordination, monitoring, and patient support.
What role do biosimilars play?
Biosimilars can reduce cost pressure and widen access to advanced therapies, especially in IBD. They also create stronger competition for originator biologics and make real-world outcomes, patient support, and access strategy more important.
Why does country-level analysis matter?
Country-level analysis matters because disease burden alone does not determine market value. Diagnosis, reimbursement, specialist access, affordability, distribution, and prescribing practice can change the realized opportunity in each country.
What are the biggest barriers in the GI therapeutics market?
The main barriers are high biologic cost, reimbursement delays, underdiagnosis, patent expiry, biosimilar competition, adherence gaps, antibiotic resistance, and unequal access in emerging markets.
Which metrics should pharma leaders track?
Leaders should track market size, CAGR, prevalence, diagnosis rate, treatment rate, biologic adoption, biosimilar penetration, regional share, country CAGR, pharmacy channel share, reimbursement coverage, relapse, and hospitalization.
concentrated in hospitals or specialty centers. A balanced dashboard keeps the article’s statistics tied to actual treatment availability rather than headline market size alone.
Final Takeaway
Gastrointestinal therapeutics should be read as a portfolio market, not a single digestive-drug category. The statistics show why the market has both volume and specialty value: GERD, IBS, constipation, diarrhea, and acid-related disorders create broad recurring demand, while IBD, pancreatic enzyme therapy, oncology-linked support, biologics, and biosimilars create more complex treatment pathways. That mix makes the category commercially durable, but it also means one blended market average can hide very different operating realities.
The most practical conclusion is that GI therapeutics should be planned as a portfolio of access pathways. The same article can discuss reflux drugs, biologics, pancreatic enzymes, and oncology-linked support, but market decisions should separate routine volume from specialist-managed value.
For stakeholders, the winning strategy is not only to follow the largest forecast number. It is to identify where diagnosis, reimbursement, physician confidence, pharmacy access, and patient adherence convert disease burden into durable treatment demand.
The most useful reading is that growth depends on both disease burden and treatment access. A large patient pool only becomes market value when patients are diagnosed, referred, reimbursed, treated, monitored, and supported through the right channel. This is why North America leads on spending and specialty access, Europe is shaped by biosimilar and reimbursement discipline, and Asia Pacific carries the strongest patient-volume expansion story. Country-level data matters because the same therapy can face different access, pricing, and adoption conditions in each market.
For pharmaceutical manufacturers, payers, providers, and regional teams, the practical goal is to separate high-volume demand from high-value specialty demand. Mature categories need distribution reach, affordability, repeat use, brand trust, and adherence. Specialty GI categories need specialist education, payer evidence, patient monitoring, escalation pathways, and durable outcomes. The strongest strategies will not treat PPIs, laxatives, biologics, biosimilars, pancreatic enzymes, and oncology-support medicines as if they follow the same commercial logic.
The final market signal is therefore not simply that gastrointestinal therapeutics is growing. It is that growth quality depends on diagnosis, access, affordability, innovation, and measurable patient benefit. Markets that connect symptoms to diagnosis, diagnosis to therapy, therapy to reimbursement, and reimbursement to long-term outcomes will convert digestive-disease burden into durable therapeutic value more reliably than markets that only show a large patient base.


