Agriculture is where food supply, land use, labor, commodity markets, livestock, fertilizer, climate risk, technology, and food security meet. The market is not measured only by farm revenue or crop output. It is measured by how much food the world produces, how much land and water that production requires, how many people depend on farming for work, how exposed food systems are to input costs and climate shocks, and whether production translates into affordable food access.
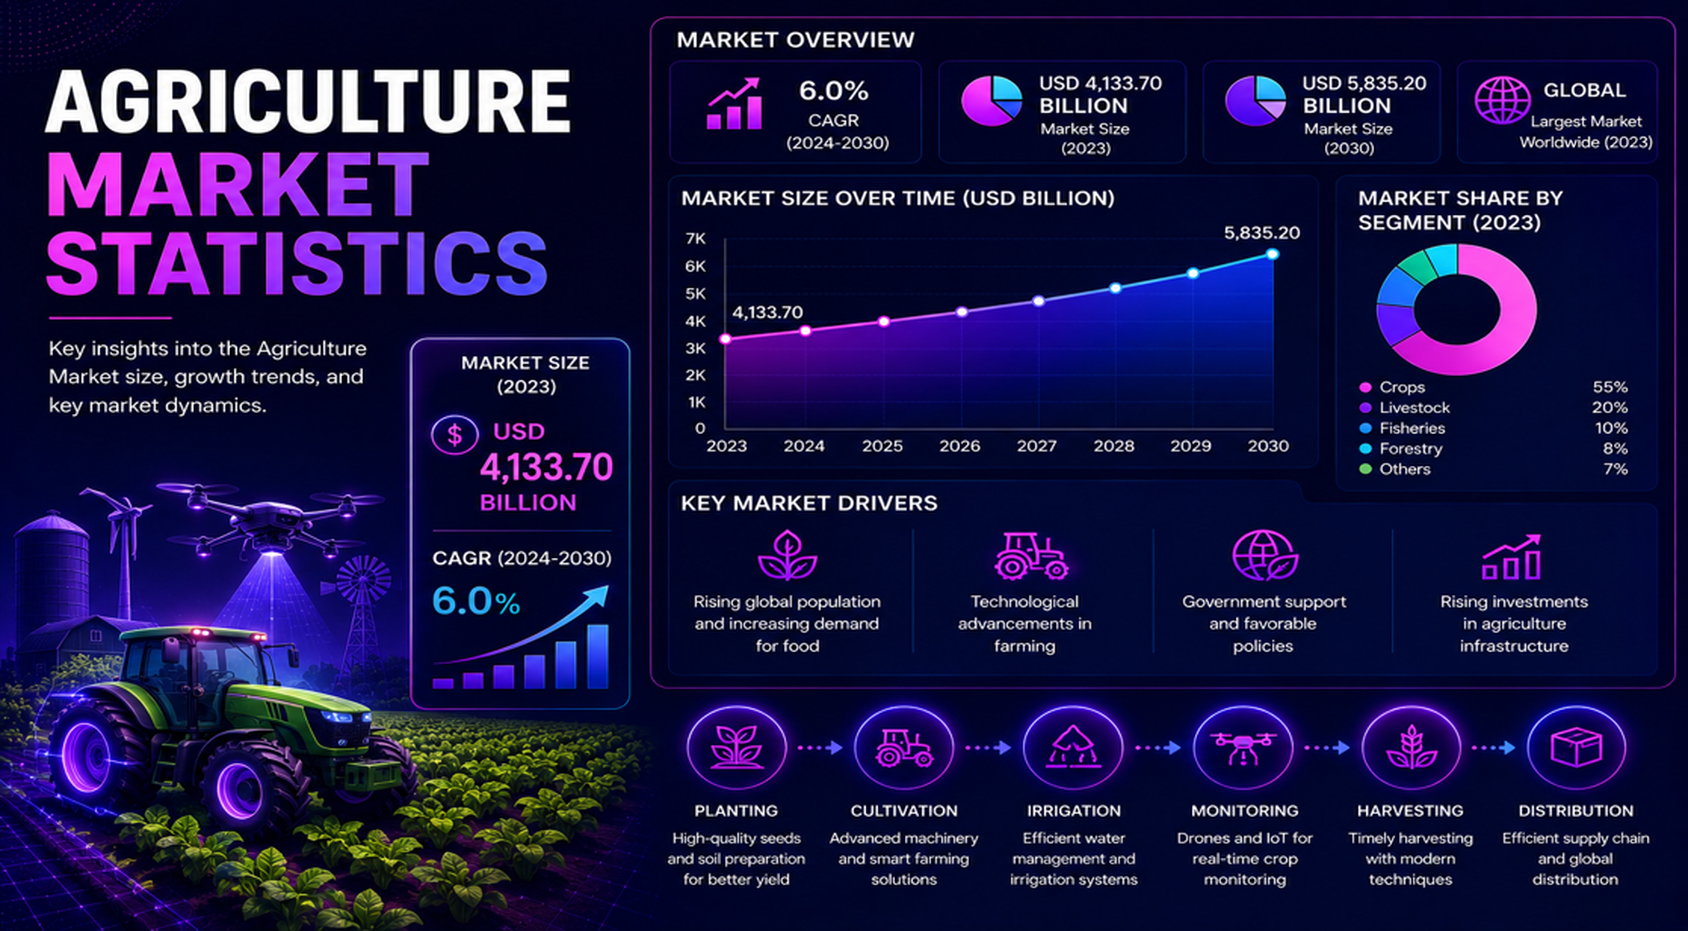
The strongest agriculture statistics show why the sector deserves its own market scorecard. FAO data places global agricultural value at $3.8 trillion in 2022 after an 89% real increase over two decades, while global primary crop production reached 9.9 billion tones in 2023. Agriculture employed 26% of the global workforce in 2022, down from 40% in 2000, showing how productivity, mechanization, urbanization, and rural income changes are reshaping the sector.
Executive Agriculture Market Benchmarks
An executive reading separates market scale from market pressure. Output and value show how large agriculture is, while food prices, fertilizer exposure, rural employment, and climate risk show where the sector is most vulnerable. Together, these indicators show which parts of the market require the closest attention.
For agribusiness leaders, these benchmarks provide an initial market scorecard. If production is rising while yields are flat, growth may be coming from more land rather than better productivity. If value is rising while food affordability weakens, the market may be profitable for some actors but stressful for households. If employment remains high while value per worker is low, mechanization, finance, storage, and market access become the practical questions.
The numbers that define the agriculture market
- FAO reports global agricultural value reached $3.8 trillion in 2022 after rising 89% in real terms over two decades.
- Global primary crop production reached 9.9 billion tone in 2023, up 3% from 2022 and 27% higher than in 2010.
- Agriculture employed 26% of the global workforce in 2022, compared with 40% in 2000.
- Global primary crop production reached 9.6 billion tone in 2022, which was 56% higher than in 2000.
- Global cereal production increased by 61 million tone between 2022 and 2023, equal to 2% growth.
- Maize, wheat, and rice accounted for 91% of global cereal production in 2023, showing how concentrated the staple grain base remains.
- Sugar cane production was above 2 billion tone in 2023, making it one of the largest agricultural commodities by physical volume.
- Fruit and vegetable production reached 2.1 billion tone in 2023, up 1% from 2022.
- Oil palm fruit, soybeans, and rapeseed reached 893 million tone in 2023.
- Chicken, pig, and cattle meat production reached 321 million tone in 2023, while total global meat production reached 361 million tone in 2022.
- Inorganic fertilizer use reached 185 million tone of nutrients in 2022, with nitrogen representing 58% of nutrient use.
- Global pesticide use increased by 70% between 2000 and 2022.
- The midpoint estimate for undernourishment in 2023 was 733 million people, about 152 million above 2019.
- OECD-FAO projections show global production of agricultural and fish commodities expanding by about 14% through 2034.
- By 2034, 22% of calories consumed globally are expected to be traded across borders, compared with 17% twenty years earlier.
Agriculture market readout
The headline data points to five connected systems: production volume, land use, labor, input intensity, and food security. A country can produce large crop volumes but still face low yields, water stress, import dependence, or food-price pressure. That is why agriculture statistics should be read as a system rather than as isolated production rankings.
Why Agriculture Carries Global Market and Food-Security Stakes
Agriculture is different from many markets because its importance cannot be measured only by sales value. Crop output, food access, rural employment, water use, soil health, input supply, and trade stability all affect the market. A strong agriculture benchmark therefore needs economic, physical, labor, input, and resilience indicators.
Market-size and food-system benchmarks
- The world produced 9.9 billion tone of primary crops in 2023, making agriculture one of the largest physical-production systems in the global economy.
- Agricultural value reached $3.8 trillion in 2022, but the value figure does not include the full downstream food, logistics, processing, retail, and input economy.
- Agriculture employed 26% of the global workforce in 2022, showing why farm productivity and rural income remain central development issues.
- The FAO Food Price Index averaged 127.2 points in 2025, 4.3% higher than in 2024.
- Vegetable oil prices rose 17.1% across 2025, dairy prices increased 13.2%, and meat prices rose 5.1%.
- Cereal prices declined 4.9% in 2025, while sugar prices ended the year down 17%, showing how commodity categories can move in opposite directions.
- FAO raised its estimate for 2025 global cereal production to a record 3.023 billion metric tones.
- The global cereal stocks-to-use ratio was projected at 31.8% for 2025/26, a key food-system buffer indicator.
- Global production of agricultural and fish commodities is projected to expand by about 14% through 2034.
- Output of meat, dairy products, and eggs is projected to increase by 17% through 2034.
- Total inventories of cattle, sheep, pigs, and poultry are projected to expand by 7% through 2034.
- Global cereal production is projected to grow at an average annual rate of 1.1%, while cereal yields are projected to rise by 0.9% per year.
- Harvested cereal area is projected to expand by only 0.14% annually, meaning productivity growth will matter more than land expansion.
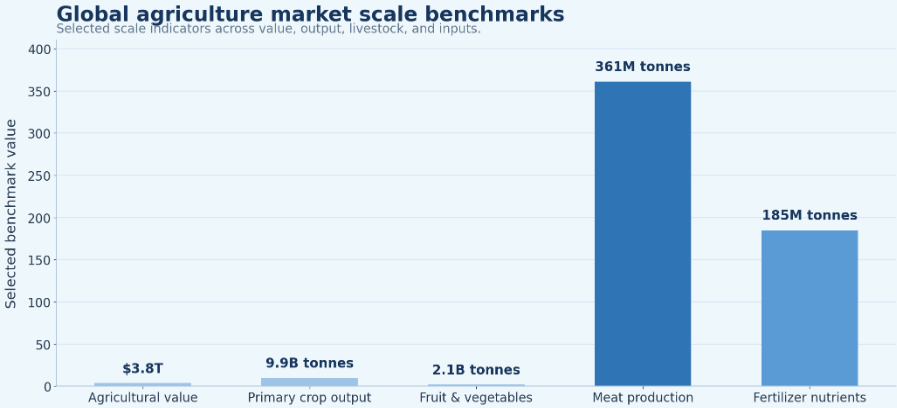
Figure 1. Agriculture market scale should be reviewed through value, production volume, labor, inputs, and food security because the sector affects both economic output and basic food availability.
Global Agriculture Production: Where the Market Stands
Global agriculture production functions as a supply map. Crops provide food, feed, fiber, sugar, oils, and industrial raw materials, while livestock converts feed and pasture into meat, milk, eggs, and other animal products. These flows have different economics, risks, and policy responses across staple grains, high-value horticulture, meat, dairy, and export crops.
Production also needs a time lens. A single record harvest can ease prices for one season, but long-term market strength depends on yield improvement, storage, water reliability, disease control, transport links, and the ability to move output from farms to processors and consumers without large losses.
Production volume is the first layer of agriculture analysis. It shows the amount of food, feed, fiber, and raw material being produced. But production volume alone does not show productivity, market value, nutrition quality, or resilience, so the statistics need to be interpreted with yield, land, labor, trade, and input data.
Production-volume benchmarks
- Global primary crop production reached 9.9 billion tone in 2023.
- Primary crop production increased 3% from 2022 to 2023, adding momentum after weather, input-cost, and supply-chain disruptions in recent years.
- Primary crop production was 27% higher in 2023 than in 2010, showing the long-term expansion of physical output.
- Global cereal production increased by 61 million tone between 2022 and 2023.
- Maize, wheat, and rice represented 91% of total cereal production in 2023.
- World production of sugar crops increased by 122 million tone between 2022 and 2023.
- Sugar cane production was above 2 billion tone in 2023, while sugar beet production reached 281 million tonnes.
- Fruit and vegetable production reached 2.1 billion tone in 2023.
- Oil palm fruit, soybeans, and rapeseed reached 893 million tone in 2023.
- Chicken, pig, and cattle meat production reached 321 million tone in 2023.
- Global meat production reached 361 million tone in 2022 and was 55% higher than in 2000.
- The production numbers show that crops, livestock, fruits, vegetables, oils, and animal products should be analyzed as related systems because feed demand, land use, fertilizer use, and trade all connect them.
| Metric | Latest benchmark | Why it matters |
|---|---|---|
| Global primary crop production | 9.9 billion tone in 2023 | Physical food and raw-material scale |
| Agricultural value | $3.8 trillion in 2022 | Direct economic contribution |
| Cereal production | Record 3.023 billion metric tone estimated for 2025 | Food-security backbone |
| Global meat production | 361 million tone in 2022 | Livestock-market scale |
| Fertilizer nutrient use | 185 million tone in 2022 | Input intensity and cost exposure |
Production readout
Agriculture production should be separated from agriculture value. High output does not automatically mean high income. Prices, yield, quality, processing, export access, labor productivity, crop losses, and climate damage determine how much value the sector captures from physical production.
Crop Market Statistics: Cereals, Oilseeds, Fruits, and Vegetables
Crop statistics are strongest when staple crops and commercial crops are separated. Cereals carry food-security weight, while oilseeds, sugar crops, cotton, fruits, vegetables, coffee, cocoa, and palm oil often shape export revenue, feed demand, processing margins, and global commodity prices.
Crop-production benchmarks
- The United States produced around 389 million tone of maize in 2023, keeping it among the largest maize producers in the world.
- China produced roughly 289 million tone of maize in 2023.
- Brazil produced about 132 million tone of maize in 2023, reinforcing its role in feed and export supply.
- China produced roughly 137 million tone of wheat in 2023, while India produced about 111 million tone and Russia about 92 million tones.
- China produced roughly 209 million tone of paddy rice in 2023.
- India produced about 196 million tone of paddy rice in 2023, while Bangladesh produced around 59 million tones.
- Brazil produced roughly 153 million tone of soybeans in 2023, ahead of the United States at about 113 million tone and Argentina at about 48 million tones.
- Brazil produced around 782 million tone of sugar cane in 2023, while India produced about 490 million tone and China about 109 million tones.
- China produced roughly 94 million tone of potatoes in 2023, while India produced about 60 million tone and Ukraine about 21 million tones.
- China and India each produced more than 5 million tone of cotton lint in 2023, while the United States produced about 2.8 million tones.
- Brazil produced roughly 3.4 million tone of green coffee in 2023, while Vietnam produced around 1.8 million tonnes.
- Côte d’Ivoire produced roughly 2.2 million tone of cocoa beans in 2023, while Ghana produced about 0.65 million tones.
- Indonesia produced around 250 million tone of oil palm fruit in 2023, while Malaysia produced about 93 million tones.
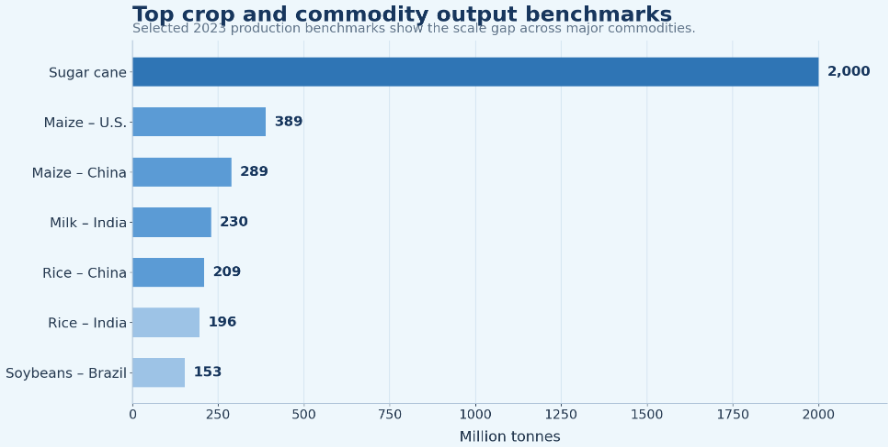
Figure 2. The largest crop categories show why agriculture market analysis should separate food staples from commercial crops, because each group has different trade, price, yield, and food-security implications.
Crop interpretation
Crop output has different market roles. Maize, rice, and wheat explain calorie supply and feed demand. Soybeans, palm oil, cotton, coffee, cocoa, and sugar crops explain export revenue, processing demand, and exposure to global commodity cycles.
Livestock, Dairy, Poultry, and Animal Product Statistics
Livestock is both a protein market and an input-demand market. Meat, milk, eggs, and poultry depend on feed crops, land, water, animal health, processing capacity, cold chains, and consumer income. That makes livestock statistics central to agriculture market analysis.
Livestock and animal-product benchmarks
- Global meat production reached 361 million tone in 2022 and increased by 55% between 2000 and 2022.
- Chicken, pig, and cattle meat production reached 321 million tone in 2023.
- China produced roughly 58 million tone of pork in 2023, making it the central country in global pork statistics.
- China produced around 24 million tone of poultry meat in 2023, while the United States produced about 23 million tons.
- The United States produced roughly 12.3 million tone of beef and veal in 2023.
- Brazil produced about 10.6 million tone of beef and veal in 2023.
- India produced roughly 230 million tone of milk in 2023, making it the largest milk producer among the countries compared here.
- The United States produced about 103 million tone of milk in 2023.
- Pakistan produced roughly 65 million tone of milk in 2023, showing the importance of dairy in South Asian agriculture.
- OECD-FAO projections show meat, dairy, and egg output increasing 17% through 2034.
- Global inventories of cattle, sheep, pigs, and poultry are projected to expand by 7% through 2034.
| Segment | Key metric | Market role |
|---|---|---|
| Beef and cattle | U.S. 12.3 million tonnes; Brazil 10.6 million tonnes | Land, feed, water, and emissions intensive |
| Pork | China 58 million tonnes | Major protein market, especially in Asia |
| Poultry | China 24 million tonnes; U.S. 23 million tonnes | Fast-growing and feed-efficient protein segment |
| Dairy | India 230 million tonnes; U.S. 103 million tonnes | Large nutrition, income, and cold-chain category |
| Eggs and other animal products | Projected growth with livestock output | Affordable protein and household nutrition |
Livestock readout
Livestock statistics should be reviewed with feed, land, water, emissions, and income data. Poultry can scale quickly because it is relatively efficient, while beef and dairy often carry larger land and emissions footprints. Livestock is therefore a market-growth story and a sustainability story at the same time.
Agricultural Land, Arable Land, and Farm Structure
Land defines the production base, but it does not define productivity by itself. Agriculture statistics need to separate agricultural land, arable land, pasture, permanent crops, irrigation, farm size, and land per worker.
Land-use benchmarks
- China’s agricultural land represents about 54.7% of its land area, according to the land-use indicators used here.
- India’s agricultural land represents about 60.4% of land area, showing the country’s large farming footprint.
- Brazil’s agricultural land represents about 28.3% of land area, with major crop, livestock, and pasture systems.
- The United States has about 44.4% of land area classified as agricultural land.
- Pakistan’s agricultural land represents about 47.1% of land area, while Bangladesh’s agricultural land reaches about 70.6%.
- Australia’s agricultural land share is around 46.8%, but the market is heavily shaped by extensive livestock, grain exports, and climate variability.
- Agricultural land data should be read with irrigation, yields, mechanization, and crop mix because land alone does not show production efficiency.
| Land signal | What it measures | Why it matters |
|---|---|---|
| Agricultural land | Total land used for farming and grazing | The production base |
| Arable land | Land available for annual crops | Staple-crop potential |
| Permanent crops | Tree crops and long-term crop area | Horticulture and plantation footprint |
| Pasture | Livestock land base | Grazing-market scale |
| Irrigated land | Water-supported production | Yield and water dependency |
Land-use interpretation
A country with large agricultural land can still have low yields if water, inputs, seeds, storage, finance, or extension services are weak. A smaller land base can produce high market value when irrigation, mechanization, logistics, processing, and export channels are strong.
Agricultural Labor, Rural Employment, and Productivity
Labor statistics show whether agriculture is mainly a commercial output sector, a livelihood system, or both. High agricultural employment can indicate rural dependence, but it can also reveal low value added per worker when productivity is weak.
Labor and productivity benchmarks
- Agriculture employed 26% of the global workforce in 2022, down from 40% in 2000.
- India’s agriculture employment share is about 42%, showing why farming remains central to rural livelihoods and household income.
- Pakistan’s agriculture employment share is about 37%, while Vietnam’s is about 28% and China’s is about 22%.
- Brazil’s agriculture employment share is around 9%, showing a more commercialized and mechanized production model than many emerging markets.
- The United States agriculture employment share is about 1.4%, but the country remains a major crop, livestock, and export producer because of productivity, mechanization, capital intensity, and logistics.
- Sub-Saharan Africa has many country averages where more than half of employment remains linked to agriculture.
- Labor statistics should be compared with value added, yields, mechanization, rural wages, and landholding structure.
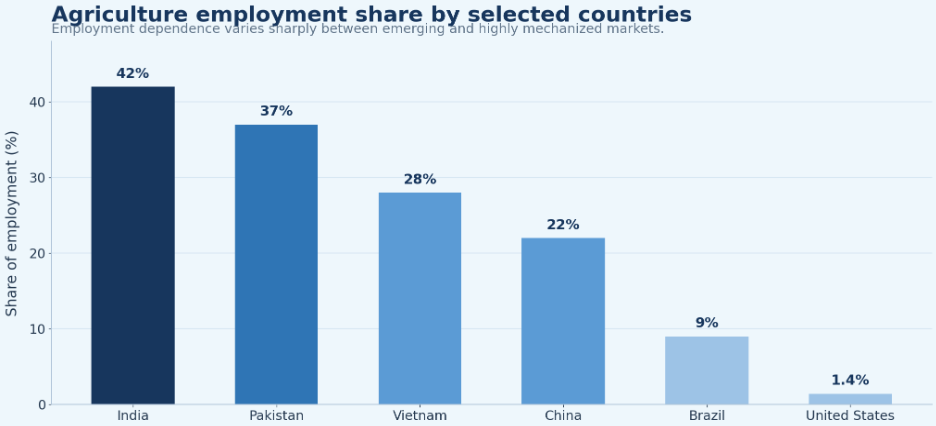
Figure 3. Agriculture employment shares show why the market has different meanings by country: in some economies agriculture is mainly a commercial output sector, while in others it remains a major livelihood system.
Fertilizer, Irrigation, Machinery, and Input Use
Input use is where agriculture growth becomes both more productive and more exposed. Fertilizer, irrigation, machinery, seed technology, pesticides, fuel, and advisory systems can raise yields, but they also expose farmers to price volatility, credit constraints, import dependence, and regulation.
Farm input benchmarks
- Inorganic fertilizer use reached 185 million tone of nutrients in 2022.
- Nitrogen accounted for 58% of inorganic fertilizer nutrients used in 2022.
- Inorganic fertilizer nutrient use increased 37% compared with 2000.
- Global pesticide use increased by 70% between 2000 and 2022.
- Fertilizer use is one of the clearest links between agriculture productivity and input-cost risk.
- Cereal yield is projected to increase by 0.9% per year, while harvested cereal area is projected to expand by only 0.14% annually.
- Sub-Saharan Africa cereal yields remain far below high-income-region yields, showing large productivity potential but also input, irrigation, infrastructure, and finance constraints.
- In South Asia, high land pressure makes yield growth and irrigation efficiency especially important.
- Mechanization matters because it can raise output per worker, reduce harvest losses, and support timely planting and harvesting.
- Input access should be measured with fertilizer use, irrigation, seed quality, machinery, crop protection, extension services, and credit access rather than fertilizer alone.
| Input area | Core metric | Market meaning |
|---|---|---|
| Fertilizer | 185 million tone of nutrients; 58% nitrogen share | Yield support and cost pressure |
| Irrigation | Irrigated land share and water withdrawals | Water security and yield stability |
| Machinery | Mechanization or tractors per worker | Labor productivity and harvest timing |
| Pesticides | Use by crop or hectare | Pest control and regulation exposure |
| Seeds and advisory | Improved seed and information access | Yield and resilience potential |
Input-cost readout
Inputs are not just technical variables. They are market variables. When fertilizer, fuel, seed, machinery, or crop-protection costs rise, farmers may reduce application, delay planting, cut yields, or pass costs into food prices. A strong agriculture scorecard tracks both input use and input affordability.
Agriculture Trade, Exports, and Commodity Flows
Agricultural trade connects production regions with food-demand regions. A country can be a major producer and still import specific foods, feed ingredients, fertilizer, or vegetable oils. That makes trade statistics useful for both commercial opportunity and food-security exposure.
Agriculture trade benchmarks
- By 2034, 22% of calories consumed globally are expected to be traded across borders.
- Twenty years earlier, 17% of calories consumed globally were traded across borders, showing rising reliance on international flows.
- Brazil’s soybean, beef, sugarcane, coffee, and maize statistics show why it anchors Latin American agricultural exports.
- The United States remains central to maize, soybeans, beef, dairy, cotton, and poultry trade flows.
- Russia’s wheat production, at roughly 92 million tone in 2023, keeps it central to grain-market risk and export flows.
- India’s rice, wheat, sugarcane, milk, and cotton output makes it both a domestic food-security market and a commodity-policy influence.
- Indonesia and Malaysia matter because oil palm fruit output shapes edible oil markets and food-processing costs.
- Coffee and cocoa illustrate how smaller physical volumes can still carry large export and price importance for specific countries.
- Food import dependence should be analyzed with cereal stocks, local production, income, currency risk, and price controls.
- Fertilizer trade exposure can create production risk even in countries that are strong in crop output.
| Trade signal | What to compare | Why it matters |
|---|---|---|
| Export value | Country export earnings by crop and livestock category | Commercial agriculture strength |
| Import dependence | Food imports versus domestic supply | Food-security exposure |
| Grain trade | Wheat, maize, and rice flows | Staple-market risk |
| Oilseed and vegetable oil trade | Soybean, palm oil, rapeseed, and edible oil flows | Feed and food industry exposure |
| Fertilizer trade | Import reliance and nutrient prices | Input-price vulnerability |
Trade readout
Trade strength and food security are not the same. Export-oriented agriculture can create income and foreign exchange, but food affordability still depends on domestic staple supply, prices, storage, transport, import capacity, and household purchasing power.
Regional Agriculture Market Intelligence
Regional agriculture data is especially important because global averages hide very different realities. Asia-Pacific combines huge food demand with large farm populations. Europe combines high productivity with regulation and sustainability goals. North America depends on mechanization, scale, exports, and logistics. Latin America is central to soybeans, beef, sugar, fruit, and feed markets. Africa and the Middle East require a stronger food-security and water-stress lens.
Regional agriculture data reveals differences that global averages can hide, including land availability, labor dependence, crop mix, yields, water stress, mechanization, export exposure, and food-security pressure.
Asia-Pacific
- China’s agriculture, forestry, and fishing sector accounts for about 7.1% of GDP, while agriculture accounts for about 22% of employment.
- India combines major crop output with high labor dependence; agriculture accounts for about 42% of employment and about 16% of GDP in the indicators used here.
- China and India dominate rice, wheat, cotton, milk, and broad food-demand statistics, making them distinct anchors of the Asia-Pacific agriculture market.
- Southeast Asia contributes rice, palm oil, coffee, aquaculture, rubber, tropical fruit, and plantation crops, with Indonesia, Vietnam, Thailand, and Malaysia carrying different market roles.
- Australia’s agriculture is smaller by population share but important in grains, livestock, and exports because of scale, logistics, and global commodity exposure.
Europe
- Europe is not the largest region by agricultural labor, but it has high productivity, strong food standards, and major export sectors.
- France, Germany, Spain, Italy, and the Netherlands matter because they combine crops, livestock, dairy, horticulture, wine, processing, and trade.
- European agriculture is shaped by subsidies, climate regulation, sustainability rules, fertilizer costs, energy prices, and food-quality standards.
- Cereal yields in Europe are far above many low-income regions, showing the impact of technology, input access, mechanization, and infrastructure.
North America
- The United States has a low agriculture employment share of about 1.4%, but it remains a major producer of maize, soybeans, beef, poultry, dairy, and cotton.
- Canada plays a major role in grains, oilseeds, pulses, livestock, and export supply chains.
- Mexico matters for horticulture, food exports, grains, livestock, and its integration with North American food supply chains.
- North America is best understood as a high-productivity agriculture region where mechanization, logistics, research, and agribusiness integration drive output.
Latin America
- Brazil is the regional anchor because it produced roughly 153 million tone of soybeans, 132 million tone of maize, 782 million tone of sugar cane, and 10.6 million tone of beef and veal in 2023.
- Argentina remains important in soybeans, grains, meat, and export flows.
- Chile, Peru, Colombia, and Central America show the importance of fruits, specialty crops, coffee, horticulture, and export-oriented farming.
- Latin America is an export-led agriculture region where commodity prices, land use, deforestation pressure, logistics, and global food demand shape the market.
Middle East and Africa
- Sub-Saharan Africa has many economies where agriculture remains above the global average as a share of GDP and employment.
- More than half of employment in Sub-Saharan Africa is still linked to agriculture in many country averages.
- Cereal yields in Sub-Saharan Africa remain far below high-income-region yields, showing major productivity potential and a large input, water, storage, and infrastructure gap.
- Egypt’s agriculture depends heavily on irrigation and cereal supply, while South Africa has a more commercial agriculture structure than many regional peers.
- The Middle East and North Africa require a food-security lens because water scarcity and import dependence are central market constraints.
| Region | Agriculture market pattern | Market interpretation |
|---|---|---|
| Asia-Pacific | Large food demand, major crop output, high rural labor | China and India define global food and input demand |
| Europe | High productivity, policy support, and strong regulation | Sustainability rules, subsidies, and exports shape the region |
| North America | Mechanized, export-oriented, high-value farming | Technology and scale drive productivity |
| Latin America | Commodity exports and expanding agribusiness | Brazil anchors soybean, beef, sugar, and maize growth |
| Middle East & Africa | Food security, water stress, and livelihood dependence | Agriculture is both an economic and social stability sector |
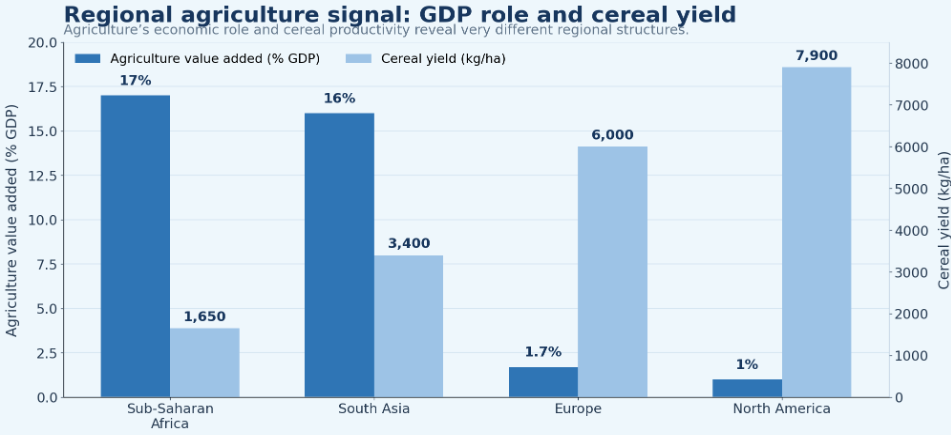
Figure 4. Regional agriculture statistics show why the market should be analyzed by geography, because each region has a different mix of land, labor, yields, export exposure, water risk, and food-security pressure.
Regional interpretation
Regional agriculture performance differs by measure. Asia-Pacific is defined by food-demand scale and crop output. North America is defined by productivity and exports. Europe is shaped by policy, standards, and high-value production. Latin America is driven by commodity supply, while Africa and the Middle East are strongly influenced by food security, water stress, and livelihood dependence.
Country-Level Agriculture Market Statistics
Country-level statistics reveal different sources of market importance. China stands out for food demand, crop output, livestock, and input use. India combines agriculture employment, milk, cereals, and rural livelihoods. The United States is defined by high productivity, corn, soybeans, meat, and exports, while Brazil is central to soybeans, beef, sugarcane, maize, and global commodity supply.
For emerging markets, the interpretation is different. Pakistan, Bangladesh, Nigeria, Egypt, and several African economies show why agriculture cannot be separated from affordability, employment, water access, and rural income. A country may not lead global exports but can still be strategically important because a large share of its population depends on farming or food prices.
Country-level agriculture statistics reflect different forms of market importance: output scale, labor dependence, export role, yield performance, import exposure, food security, and commodity specialization.
Country benchmarks worth separating
- China matters because it is a large crop, livestock, and food-demand market, with about 7.1% of GDP and 22% of employment linked to agriculture indicators.
- India matters because it combines large crop output, the world’s largest milk production benchmark, and about 42% agriculture employment share.
- The United States matters because it produces large crop and animal-product volumes with a very low agricultural employment share, showing high productivity.
- Brazil matters because it anchors soybeans, sugar cane, beef, coffee, maize, and export agriculture in Latin America.
- Indonesia matters because oil palm fruit production, rice, tropical crops, and rural livelihoods shape its agriculture profile.
- Russia matters because its wheat production and export role influence global grain-market risk.
- France and Germany matter because they represent high-productivity European agriculture, food processing, and policy-driven production systems.
- Australia matters because grain, livestock, water variability, and export exposure create a different agriculture profile from population-heavy markets.
- Pakistan matters because wheat, rice, cotton, livestock, milk, irrigation, and farm employment are central to the economy and food security.
- Nigeria matters because agriculture is tied closely to employment, food security, and African market development.
- Bangladesh matters because rice production, land pressure, and food security make agriculture central to household welfare.
- Vietnam and Thailand matter because rice, coffee, seafood, fruit, rubber, and export-oriented agriculture shape Southeast Asian food markets.
| Country | Agriculture strength | Key metric to use |
|---|---|---|
| China | Large crop, livestock, and food-demand market | Production, value, employment |
| India | Large workforce, milk output, grains, and cotton | Employment, milk, wheat, rice |
| United States | High-productivity commercial agriculture | Maize, soybeans, beef, dairy, poultry |
| Brazil | Soybeans, beef, sugarcane, coffee, and maize | Production and export role |
| Pakistan | Wheat, rice, cotton, livestock, and milk | Crop and dairy benchmarks |
| Indonesia | Palm oil, rice, and tropical agriculture | Palm oil fruit and land use |
| Russia | Wheat and grain exports | Wheat output and trade role |
| Nigeria | Large African agriculture workforce | Employment and food security |
Country readout
Country statistics are most useful when they explain why the market matters. China and India explain demand scale. The United States and Canada explain productivity. Brazil and Argentina explain commodity exports. Pakistan, Bangladesh, Nigeria, and Egypt explain the link between agriculture, employment, water, and food security.
Food Security, Prices, and Agricultural Resilience
They show whether the market is delivering affordable food access, not just output. Rising production can coexist with undernourishment when incomes are weak, logistics are poor, imports are expensive, or domestic prices move faster than household purchasing power.
The strongest food-security reading combines availability, access, stability, and nutrition. Cereal stocks can protect against temporary shocks, but they do not solve affordability. Import dependence can support diets when trade is stable, but it can become a risk when currencies weaken, freight costs rise, or exporting countries restrict supply.
Agriculture market strength is not the same as food security. A country can produce major export crops while still facing food affordability issues. Production volume, market value, nutrition access, and household food costs therefore need to be considered separately.
Food-security and price benchmarks
- The midpoint estimate for undernourishment in 2023 was 733 million people.
- That midpoint estimate was about 152 million people above 2019, showing how food access remained under pressure after recent shocks.
- The FAO Food Price Index averaged 127.2 points in 2025.
- The Food Price Index was 4.3% higher in 2025 than in 2024.
- Vegetable oil prices rose 17.1% across 2025, while dairy prices increased 13.2% and meat prices increased 5.1%.
- Cereal prices declined 4.9% in 2025, but that does not automatically mean food affordability improved everywhere.
- Sugar prices ended 2025 down 17%, showing category-specific price movement.
- The global cereal stocks-to-use ratio was projected at 31.8% for 2025/26.
- By 2034, 40% of cereals are projected to be consumed directly by humans and 33% are projected to be used for animal feed.
- Food security should be tracked with production, stocks, import dependence, household income, food prices, logistics, and climate risk together.
| Food-security signal | What it shows | Why it matters |
|---|---|---|
| Undernourishment | Basic food access gap | Humanitarian and affordability pressure |
| Food Price Index | Cost pressure across commodity categories | Household and policy stress |
| Import dependence | Reliance on external supply | Trade vulnerability |
| Cereal stocks | Buffer against shocks | Resilience |
| Crop losses | Climate and pest exposure | Production risk |
Food-security readout
Production and food access are separate market dimensions. More crop output can help supply, but household food security also depends on income, prices, transport, storage, conflict, currency movements, safety nets, and the nutritional mix of available food.
Climate, Water, Emissions, and Sustainability Statistics
Agriculture is both exposed to climate risk and a contributor to environmental pressure. The same systems that produce food also shape water demand, fertilizer emissions, livestock methane, land-use pressure, soil health, and food loss.
Sustainability and climate-risk benchmarks
- Global pesticide use increased by 70% between 2000 and 2022, showing the rising importance of crop protection and regulation.
- Inorganic fertilizer nutrients used in agriculture reached 185 million tone in 2022.
- Nitrogen accounted for 58% of inorganic fertilizer nutrient use, making it central to yield and nitrous oxide concerns.
- Sub-Saharan Africa’s low cereal yields show productivity potential, but productivity gains must be balanced with soil, water, and input sustainability.
- Water stress matters most in irrigated systems, arid regions, and high-value crops that rely on reliable water supply.
- Livestock growth affects feed demand, land use, water, processing, and emissions intensity.
- Food loss and waste should be treated as a market efficiency problem because lost output wastes land, labor, inputs, water, and transport capacity.
- Agriculture’s next growth phase depends on producing more with fewer losses, smarter water use, better soil management, lower emissions intensity, and higher resilience to heat, floods, droughts, and pests.
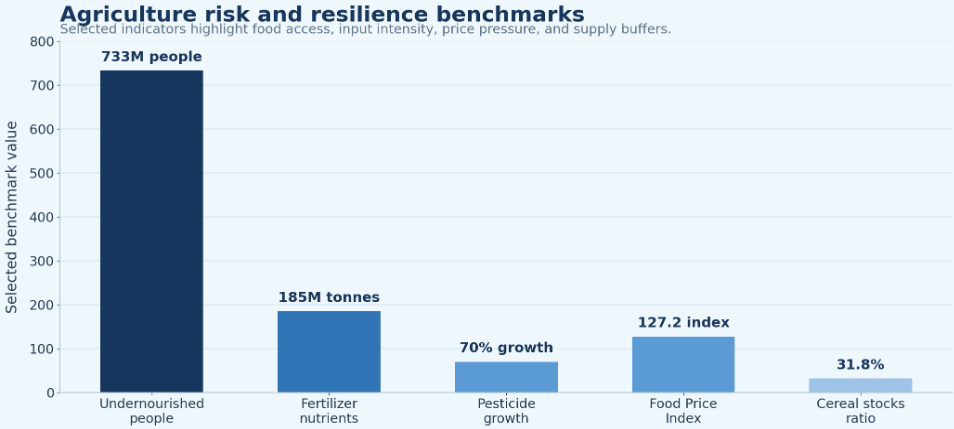
Figure 5. Agriculture sustainability statistics should be reviewed with production data because the same systems that produce food also shape water demand, emissions, soil pressure, input exposure, and climate resilience.
Agriculture Technology, Mechanization, and Digital Farming
Technology is one of the main ways agriculture can raise output without simply adding more land. But technology works best when farmers also have access to finance, extension services, stable markets, good roads, input supply, connectivity, and reliable land records.
Agriculture technology benchmarks
- Mechanization raises output per worker and can reduce losses by improving the timing of planting, harvesting, and transport.
- Precision agriculture can improve fertilizer, water, and pesticide efficiency when field data and equipment access are available.
- Digital advisory tools can improve farmer decisions on weather, pests, input timing, and market prices.
- Irrigation technology can stabilize production when rainfall becomes less reliable.
- Drones and satellite monitoring can improve field visibility, crop stress detection, and insurance verification.
- Automation helps large farms respond to labor shortages and can support more consistent harvesting and crop management.
- Technology adoption should be measured through yield, input efficiency, cost savings, labor productivity, and farmer income rather than adoption counts alone.
| Technology area | What it improves | Market impact |
|---|---|---|
| Mechanization | Labor productivity and field timing | Raises output per worker |
| Precision agriculture | Input efficiency | Reduces waste and cost |
| Digital advisory | Farmer decisions | Improves timing and yield |
| Irrigation technology | Water productivity | Stabilizes production |
| Drones and satellites | Crop monitoring | Improves field visibility |
| Automation | Labor shortage response | Supports large-scale farming |
Technology readout
Technology functions as a productivity system rather than a collection of standalone tools. Its market value is best reflected in yield improvement, loss reduction, water productivity, input savings, credit access, and farm profitability.
Agribusiness, Storage, and Supply Chain Statistics
Agriculture does not stop at the farm gate. The market value of agriculture depends on storage, milling, processing, cold chains, transport, exports, finance, insurance, and retail access. A strong production year can still create weak farmer income when storage losses are high, roads are poor, buyers are concentrated, or input costs rise faster than output prices.
Post-harvest and agribusiness benchmarks
- The global agriculture market should be read with post-harvest loss, storage, and transport indicators because physical output does not automatically reach consumers or processors.
- Cereal markets depend heavily on storage capacity, moisture control, road and rail networks, port access, and export policy.
- Fruit, vegetables, dairy, meat, and fish are more cold-chain sensitive than grains, so their market value depends heavily on refrigeration and logistics.
- High-value horticulture can raise farm income, but it also requires stronger grading, packaging, cold storage, phytosanitary systems, and buyer relationships.
- Livestock and dairy value chains require animal health services, feed supply, cold chains, processing plants, and reliable distribution.
- Fertilizer, seed, machinery, crop protection, feed, and veterinary products make agriculture a major business-to-business market, not only a food-output market.
- A country with strong output but weak processing may export low-value raw commodities instead of capturing more value through milling, packaging, branding, or food manufacturing.
- Agribusiness margins should be analyzed with farmgate prices, input costs, transport costs, storage losses, processing capacity, and export-market access.
| Supply-chain signal | What to measure | Why it matters |
|---|---|---|
| Storage capacity | Grain silos, cold stores, warehouse quality | Reduces losses and improves price timing |
| Processing depth | Milling, dairy, meat, oilseed, and fruit processing | Captures more value beyond raw output |
| Logistics access | Road, rail, ports, and rural collection networks | Links farms to markets |
| Cold chain | Refrigeration for dairy, meat, fruit, and vegetables | Protects quality and reduces waste |
| Market access | Export approvals, buyer networks, quality standards | Turns production into revenue |
Supply-chain interpretation
Agriculture market statistics should not end with production. The most useful market reading follows the crop or animal product from field to buyer. Storage, processing, cold chains, transport, insurance, and export access determine whether production becomes income, whether food remains affordable, and whether farmers can reinvest for the next season.
Yield, Productivity, and Farm Income Signals
Yield is one of the most important agriculture statistics because it separates production growth from land expansion. A country can grow output by bringing more land into farming, raising yields on existing land, reducing losses, improving crop mix, or increasing livestock productivity. Those paths have very different market and sustainability implications.
Yield and income benchmarks worth tracking
- Global cereal yield is projected to rise by 0.9% per year, while harvested cereal area is projected to expand by only 0.14% per year.
- That projection means future cereal supply depends more on productivity improvement than land expansion.
- Sub-Saharan Africa cereal yields remain far below high-income-region yields, which points to productivity opportunity but also structural constraints.
- South Asia’s agriculture markets often face high land pressure, making yield improvement, water management, and input efficiency more important than acreage expansion.
- North America and Europe show how mechanization, research, irrigation, seed systems, storage, and logistics can raise output even with a small agricultural workforce.
- Yield gaps should be analyzed by crop because maize, rice, wheat, soybeans, cotton, fruits, and vegetables have different seed, water, nutrient, pest, and mechanization needs.
- Farm income should be reviewed with yield, output price, input cost, labor cost, credit cost, insurance availability, and market access.
- A yield increase can fail to improve farm income if fertilizer, fuel, seed, labor, rent, or transport costs rise faster than output revenue.
- For policymakers, yield statistics are useful only when linked to farmer profitability, food affordability, environmental pressure, and resilience against climate shocks.
Productivity readout
The best productivity benchmark is not one yield number. It is a chain of indicators: yield per hectare, output per worker, income per farm, post-harvest loss, input cost per tonne, and water use per unit of output. That chain shows whether agriculture is becoming more efficient or only producing more at higher cost.
Agriculture Market Challenges and Production Risks
Agriculture risks fall into two broad groups: seasonal shocks and structural constraints. Climate events, pests, and floods can hurt a single harvest, while water scarcity, soil degradation, weak storage, high input costs, and limited finance can hold back the market for years. Short-term shocks require rapid response, while structural weakness requires longer-term investment and policy reform.
Agriculture risk is rarely caused by one factor. A weak harvest can become a market crisis when it combines with high fertilizer prices, poor storage, import dependence, currency weakness, conflict, export restrictions, or household income pressure.
Agriculture risks worth separating
- Climate shocks can reduce yields, disrupt planting, damage livestock, and increase food-price volatility.
- Water stress limits production in irrigated regions and can reduce the reliability of high-value horticulture, cereals, and livestock systems.
- Fertilizer price volatility matters because nutrient use is closely tied to yield outcomes in many crop systems.
- Labor shortages can increase harvest losses, delay field operations, and raise production costs.
- Land degradation reduces long-term productivity and can force higher input use to maintain output.
- Pest and disease outbreaks affect crops and livestock, with impacts that can move through food supply chains.
- Trade restrictions can protect domestic consumers in the short term but tighten global supply for import-dependent countries.
- Food inflation can create market stress even when global production is adequate, because affordability depends on local income and prices.
- Input import dependence creates risk when fertilizer, fuel, seed, or crop-protection supply is disrupted.
- Storage and logistics gaps can turn production success into post-harvest loss, especially in markets with weak cold chains or poor roads.
| Risk area | Core metric | Likely owner |
|---|---|---|
| Climate shock | Crop losses, drought exposure, flood damage | Farmers, insurers, governments |
| Water stress | Irrigation dependence, water withdrawals | Water authorities and farmers |
| Input cost pressure | Fertilizer and fuel prices | Farmers, suppliers, policymakers |
| Labor pressure | Agriculture employment and wages | Farmers and labor markets |
| Trade disruption | Export bans and import dependence | Governments and traders |
| Food-price pressure | Food inflation and price index movement | Policymakers and retailers |
Risk interpretation
The strongest agriculture risk scorecard combines production, prices, stocks, imports, inputs, climate, water, and logistics. Looking at one metric alone can hide a problem that is building elsewhere in the food system.
Metrics Agriculture Leaders Should Track
The core metrics below provide a practical view of market scale, productivity, input exposure, food affordability, trade, and sustainability for agribusinesses, policymakers, food companies, investors, exporters, and supply-chain teams.
| Metric | Why it matters |
|---|---|
| Agriculture value added | Economic contribution |
| Primary crop production | Total output scale |
| Cereal production | Food-security backbone |
| Crop yield | Productivity |
| Harvested area | Separates expansion from productivity |
| Agricultural land | Production base |
| Irrigated land | Water-supported production |
| Fertilizer use | Input intensity and cost exposure |
| Agriculture employment | Livelihood dependence |
| Value added per worker | Productivity |
| Meat and milk production | Livestock and dairy scale |
| Food Price Index | Affordability pressure |
| Agriculture exports and imports | Trade competitiveness and vulnerability |
| Agriculture emissions and water stress | Sustainability pressure |
Agriculture Market Statistics FAQ
Common questions
What is the global agriculture market size?
FAO places global agricultural value at about $3.8 trillion in 2022, while global primary crop production reached 9.9 billion tone in 2023. The broader food system is larger because it includes processing, logistics, retail, inputs, and food services.
Which country has the largest agriculture sector?
The answer depends on the metric. China, India, the United States, and Brazil are all central, but for different reasons: production scale, labor dependence, productivity, exports, and commodity specialization.
What are the most produced crops in the world?
High-volume crop categories include sugar cane, maize, rice, wheat, potatoes, soybeans, and oil palm fruit. Maize, wheat, and rice accounted for 91% of global cereal production in 2023.
Why is cereal production important?
Cereals are the backbone of food security, animal feed, and grain trade. FAO estimated 2025 global cereal production at a record 3.023 billion metric tone and projected a 31.8% stocks-to-use ratio for 2025/26.
How important is livestock in agriculture?
Livestock is central to meat, dairy, eggs, feed demand, land use, cold chains, and emissions. Global meat production reached 361 million tone in 2022, and meat, dairy, and egg output is projected to grow 17% through 2034.
Which regions dominate agriculture production?
Asia-Pacific dominates food-demand scale and crop output, North America leads in high-productivity commercial agriculture, Latin America is export-led, Europe is policy- and standards-driven, and Africa and the Middle East are strongly tied to food security and water risk.
What are the biggest risks facing agriculture?
The main risks are climate shocks, water stress, fertilizer prices, labor pressure, pest and disease outbreaks, food-price volatility, trade disruption, and logistics gaps.
Why does agriculture technology matter?
Technology can improve yield, input efficiency, water productivity, monitoring, mechanization, and labor productivity, but it works best when farmers also have credit, connectivity, extension services, and market access.
Which metrics matter most for agriculture market analysis?
The most useful scorecard combines value added, crop output, cereal production, yields, land, labor, fertilizer, livestock output, food prices, exports, imports, climate risk, and food-security indicators.
Final Takeaway
Use the statistics as a benchmark, not as a scoreboard. A large harvest, high export value, or high agriculture share of employment has different meaning depending on yields, input costs, farmer income, storage losses, food prices, water stress, and trade exposure. The practical goal is not simply more production; it is more resilient production that creates value without weakening food access or exhausting natural resources.
Agriculture market statistics point to one clear conclusion: agriculture is large, essential, and deeply uneven. The sector feeds the world, employs millions, supports rural economies, supplies raw materials, and shapes global trade. But market strength differs sharply depending on whether the data is measured through value, output, yield, labor productivity, exports, food prices, or food security.