The U.S. pet food market covers dog food, cat food, treats, dry food, wet food, fresh and refrigerated food, freeze-dried food, prescription diets, therapeutic nutrition, functional treats, premium formulas, value formulas, and pet specialty nutrition. It is one of the most reliable recurring-spend categories inside the broader pet care economy because pets eat every day and owners build feeding routines around trust, price, health, convenience, and brand familiarity.
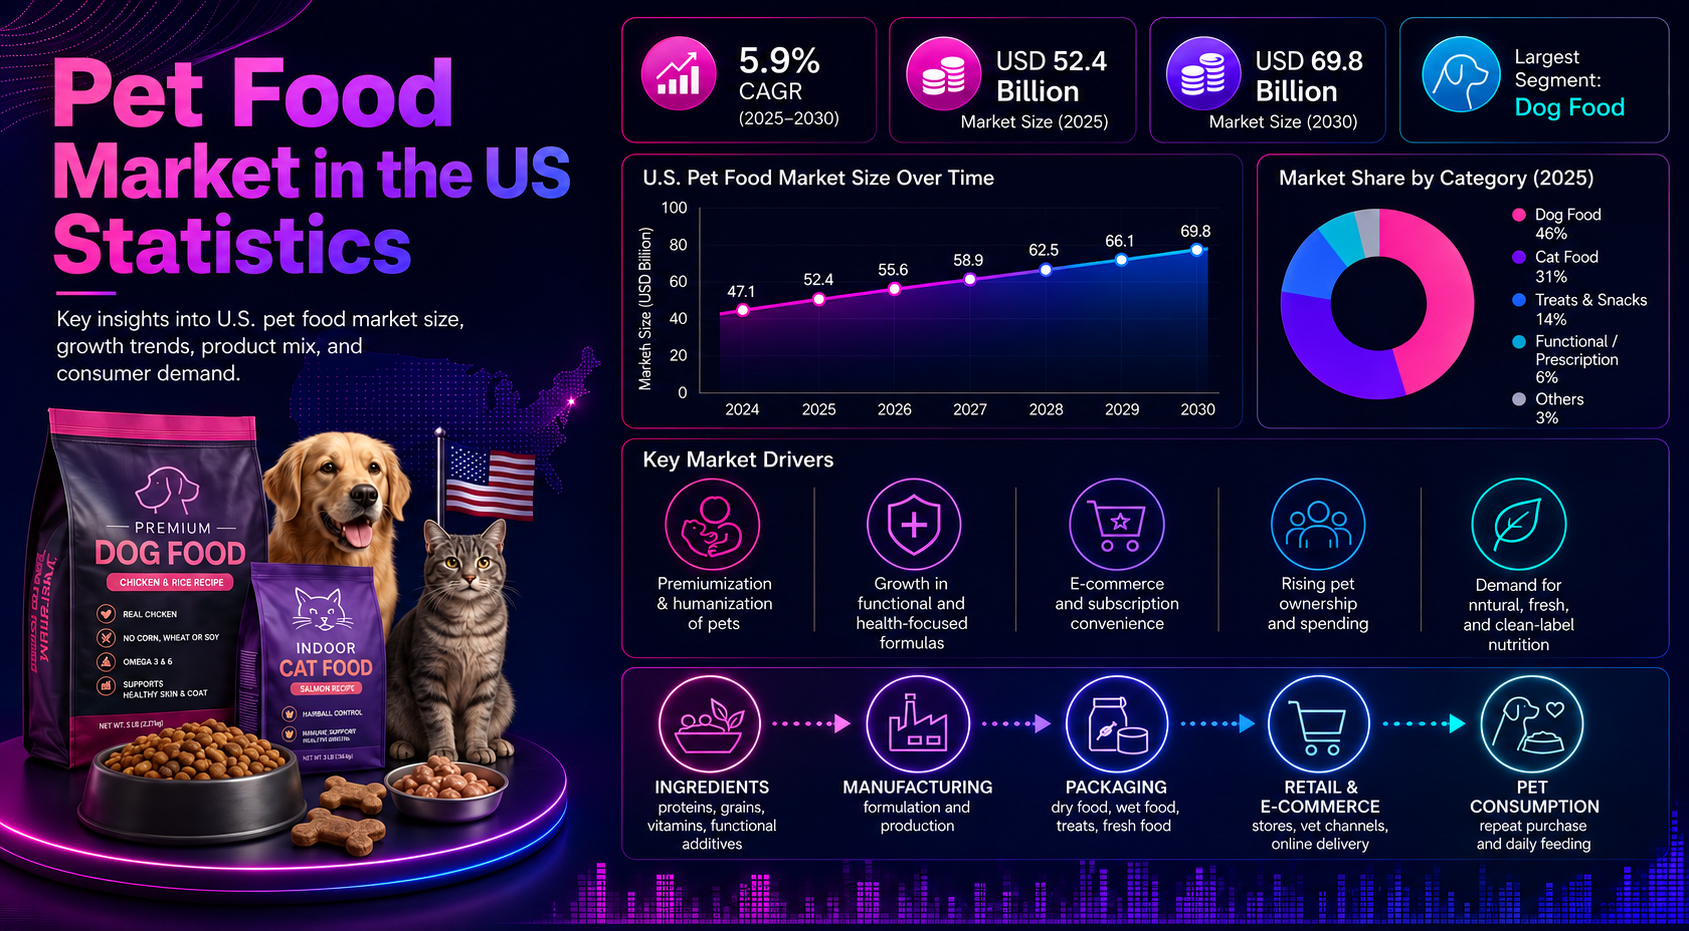
Pet Food Processing reported U.S. pet food and treats reached $65.8 billion in 2024, while APPA projected pet food and treats at $67.8 billion in 2025 and $78 billion by 2030. IMARC estimates the U.S. pet food market at $46.90 billion in 2025 and projects $62.10 billion by 2034. The difference between these benchmarks reflects scope: some sources measure pet food only, while others include treats, broader dog/cat food, or total pet industry spending.
The strongest way to read U.S. pet food statistics is to separate market size, pet ownership, dog food, cat food, format mix, premiumization, health claims, retail channels, regional demand, export markets, and repeat-purchase behavior. A dry dog food bag, wet cat food multipack, calming treat, fresh subscription plan, and prescription diet may all sit in the same market, but each one grows through a different buying reason.
Executive US Pet Food Benchmarks
The headline benchmarks show a large, recurring market anchored by household pet ownership, daily feeding needs, treats, premiumization, and health-focused nutrition.
The numbers that define the US pet food market
• Total U.S. pet industry sales reached $152 billion in 2024, up from $147 billion in 2023.
• Pet food and treats reached $65.8 billion in 2024.
• Pet food and treats represented 43.3% of total U.S. pet industry sales in 2024.
• APPA projected pet food and treats at $67.8 billion in 2025 and $78 billion by 2030.
• APPA’s current industry statistics project pet food and treats at $69.7 billion for 2026.
• Euromonitor data cited by Pet Food Processing places U.S. pet food sales at $57.9 billion in 2024 and $60.39 billion in 2025.
• IMARC estimates the U.S. pet food market at $46.90 billion in 2025.
• IMARC projects the U.S. pet food market to reach $62.10 billion by 2034.
• IMARC expects 3.17% CAGR from 2026 to 2034.
• Dog food sales are projected at $40.9 billion in 2025.
• Cat food sales are projected at $18.1 billion in 2025.
• Dog food is projected to grow 3.9% in 2025, while cat food is projected to grow 5.1%.
• An estimated 94 million U.S. households owned a pet in the 2024–2025 APPA survey period.
• U.S. dog and cat food exports reached $2.52 billion in 2024.
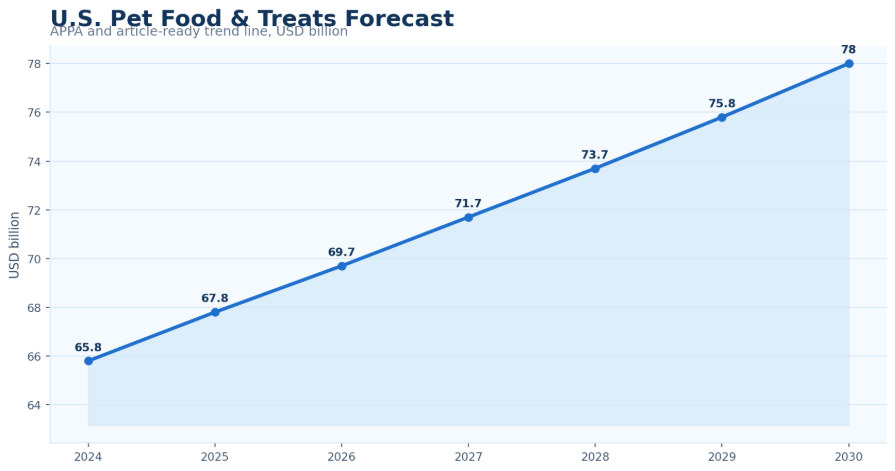
Figure 1. U.S. pet food and treats spending shows how recurring nutrition demand anchors the broader pet industry.
Editorial readout:
Pet food is the largest recurring-spend category inside U.S. pet care. Growth is shaped by ownership, premium food, functional nutrition, treats, prescription diets, fresh food, online channels, and the humanization of pets.
Why US Pet Food Carries Retail Value
U.S. pet food carries retail value because it combines routine necessity with emotional loyalty. Owners may change toys, grooming, accessories, or discretionary services, but food and treats remain a recurring household purchase. That makes pet food one of the most stable parts of the pet economy, even when households become more price-sensitive.
Dog and cat ownership create the foundation, but value growth comes from how owners feed. Larger dogs create bigger food volumes, premium formulas raise spend per pet, wet and fresh formats increase basket value, and treats expand the category into training, bonding, dental health, calming, joint support, skin and coat, and daily rewards.
Health and wellness also change the category. Prescription diets, weight-management formulas, sensitive stomach products, senior nutrition, and functional treats connect pet food with veterinary care and visible pet needs. Online auto ship and subscription models add another layer because pet food is heavy, repeatable, and easy to reorder.
| Value driver | What it shows | Market implication |
|---|---|---|
| Pet ownership scale | Broad household demand base | Supports recurring category sales |
| Repeat purchase | Food and treats are used daily | Makes replenishment behavior central |
| Dog food spending | Large dogs raise feeding volume | Keeps dog food the value anchor |
| Cat food growth | Feline demand is rising faster | Raises importance of wet and health formulas |
| Premiumization | Fresh, functional, natural, and specialty diets | Lifts spend per pet |
| Affordability pressure | Value, club, mass, and private label demand | Protects repeat purchase |
Editorial readout:
U.S. pet food carries retail value because it combines emotional loyalty with routine necessity. Food, treats, and health-focused diets remain recurring purchases even when owners compare prices more carefully.
US Pet Food Market Size and Forecast Statistics
Market-size benchmarks should be read by scope because pet food forecasts vary depending on whether treats, dog and cat food, dry food, fresh food, prescription diets, and broader pet industry categories are included.
Market-size and forecast benchmarks
• Pet Food Processing reported $65.8 billion in U.S. pet food and treats sales for 2024.
• APPA projects pet food and treats at $67.8 billion for 2025 and $78 billion by 2030.
• APPA’s current industry statistics project pet food and treats at $69.7 billion for 2026.
• IMARC estimates the U.S. pet food market at $46.90 billion in 2025.
• IMARC expects the U.S. pet food market to reach $62.10 billion by 2034.
• IMARC’s forecast implies 3.17% CAGR from 2026 to 2034.
• Euromonitor data cited by Pet Food Processing places U.S. pet food sales at $57.9 billion in 2024 and $60.39 billion in 2025.
• Forecast differences reflect scope differences across pet food, pet food and treats, dog and cat food, retail pet food, and total pet industry categories.
| Market scope | What it includes | Use this logic |
|---|---|---|
| Pet food | Core dog, cat, and other pet nutrition | Use for food-only sizing |
| Pet food and treats | Food plus treats and snacks | Best recurring-spend benchmark |
| Dog and cat food | Main companion-animal food categories | Useful for retail and export signals |
| Dry pet food | Shelf-stable kibble and dry formulas | Tracks mainstream feeding routines |
| Wet pet food | Cans, pouches, tubs, and high-moisture formats | Important for cats, seniors, and palatability |
| Total pet industry | Food, vet care, supplies, services, and other categories | Use only for broader context |
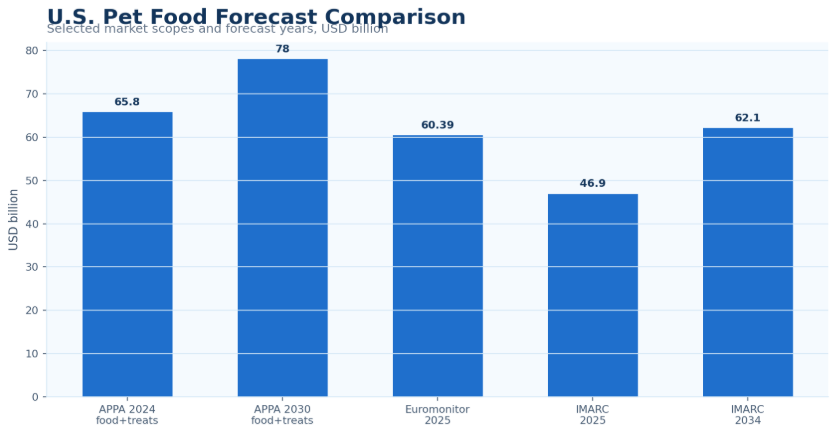
Figure 2. Forecast comparisons show why U.S. pet food statistics should be read by scope, source, and forecast year.
Editorial readout
U.S. pet food market estimates should be read by scope. A pet food-only estimate is not the same as pet food and treats, dog and cat food, or the total pet industry.
Dog Food and Cat Food Statistics
Dog food remains the largest value category because dogs are more common in U.S. households and often consume larger food volumes. Large-breed nutrition, treats, fresh food, premium dry food, joint formulas, and veterinary diets all increase spend per dog.
Cat food growth is important because the 2025 forecast shows cat food growing faster than dog food. Cat food demand is shaped by wet food, palatability, hydration, digestive health, urinary health, indoor cat formulas, smaller homes, and urban-friendly pet ownership.
• Euromonitor data cited by Pet Food Processing projects U.S. dog food sales at $40.9 billion in 2025.
• Cat food sales are projected at $18.1 billion in 2025.
• Dog food is projected to grow 3.9% in 2025.
• Cat food is projected to grow 5.1% in 2025.
• APPA/III data lists 68 million dog-owning U.S. households.
• APPA/III data lists 49 million cat-owning U.S. households.
• IMARC reports dog food accounts for 42.14% of the U.S. pet food market.
• Cat ownership trends matter because cats fit urban living and smaller households.
| Pet type | Demand signal | Market implication |
|---|---|---|
| Dog food | Largest value pool | Scale, large bags, treats, and health formulas matter |
| Cat food | Faster projected growth | Wet food, palatability, and urinary/digestive health matter |
| Dog treats | Training, bonding, calming, dental, joint support | Functional snacks lift basket value |
| Cat treats | Bonding, hairball, dental, calming, palatability | Small-format premium growth |
| Other pet food | Bird, reptile, fish, and small animal nutrition | Specialty and online channels matter |
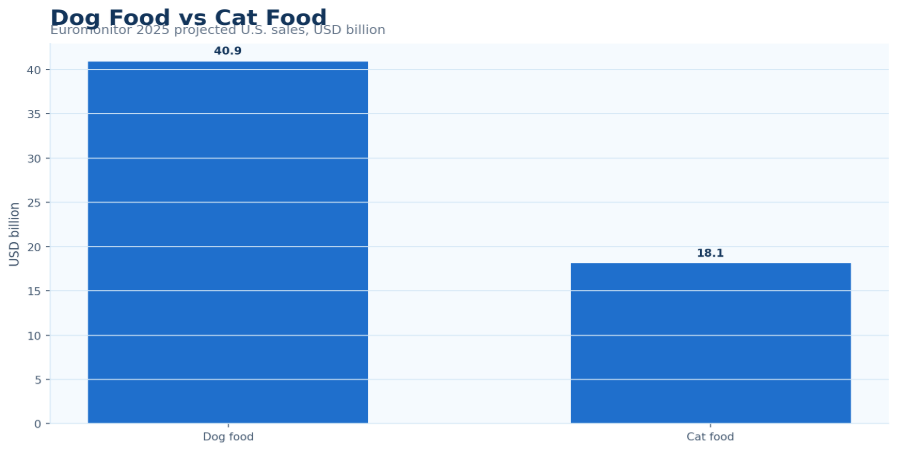
Figure 3. Dog food remains the larger value pool, while cat food growth signals rising importance of feline-focused nutrition.
Editorial readout:
Dog food drives value because dogs are more expensive to feed and support large-format purchases. Cat food growth matters because cats are urban-friendly and closely tied to wet food, palatability, and health-specific formulas.
Product Format Statistics
Format matters because U.S. pet owners rarely buy one food type for every need. Many households combine dry food, wet food, treats, toppers, fresh products, freeze-dried products, and health-specific formulas depending on pet health, price, convenience, and feeding routine.
• IMARC reports dry pet food accounts for 57.18% of the U.S. pet food market.
• Dry food remains important because of price, shelf stability, storage, and routine feeding.
• Wet food is important for palatability, hydration, cats, senior pets, and premium feeding.
• Treats connect pet food to training, bonding, indulgence, dental health, calming, joint support, and functional benefits.
• Pet Food Processing reported Circean multi-outlet sales for dry dog food at $14.2 billion for the cited 52-week period.
• Wet dog food sales were reported at $3.9 billion for the cited period.
• Freeze-dried dog food reached $304 million in the cited Circean period.
• Semi-moist dog food reached $118 million in the cited Circean period.
• Fresh food remains a premium growth area as humanization pushes refrigerated and minimally processed pet food.
| Format | Core use case | Market implication |
|---|---|---|
| Dry food | Daily feeding, value, storage, large bags | Mainstream category anchor |
| Wet food | Palatability, hydration, cats, seniors | Adds premium and health occasions |
| Treats | Training, bonding, dental, calming, joint support | Turns snacks into health add-ons |
| Fresh/refrigerated | Human-grade and minimally processed positioning | Premium and DTC-led growth |
| Freeze-dried | Raw-adjacent premium convenience | Specialty and online channels matter |
| Prescription diets | Therapeutic nutrition | Veterinary trust drives purchase |
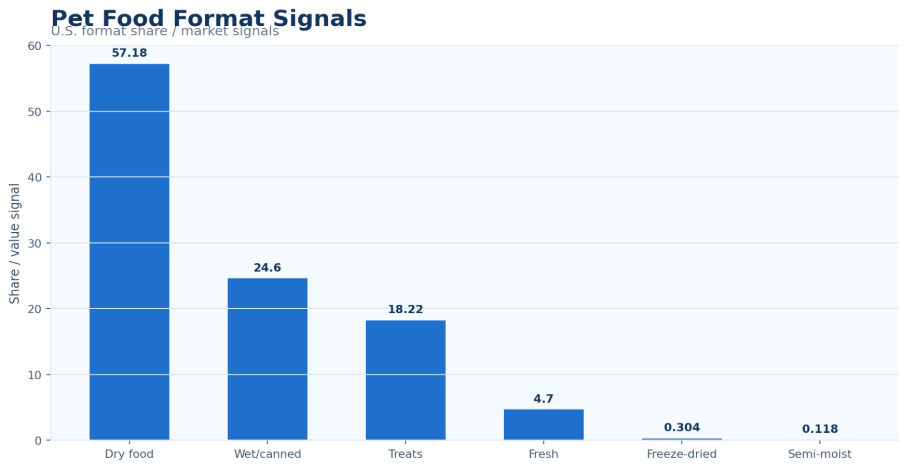
Figure 4. Dry food remains the main format, while treats, wet food, fresh food, and freeze-dried products add premium and functional growth signals.
Editorial readout:
Format strategy matters because owners mix convenience, health, price, palatability, and premium feeding. Dry food anchors the market, while wet, treats, fresh, freeze-dried, and functional products add growth signals.
Health, Functional, and Premium Nutrition Statistics
Health-focused pet food growth is strongest when the benefit is easy to understand and tied to a visible pet need. Weight management, calming, joint support, digestion, skin and coat, dental care, and senior health all turn nutrition into a problem-solving purchase.
| Health signal | Current benchmark | Market reading |
|---|---|---|
| Functional nutrition | $8.5 billion addressable signal by 2034 | Health-led formulas can add premium value |
| Dog calming use | 22% in 2018 to 59% in 2024 | Behavior support is now mainstream |
| Cat calming use | 19% in 2018 to 52% in 2024 | Feline wellness products are gaining attention |
| Dog obesity signal | 12% of owners reported vet obesity concern in 2024 | Weight formulas remain practical |
| Cat obesity signal | 17% of owners reported vet obesity concern in 2024 | Cat weight and activity formulas matter |
| Weight-loss diets | 11% of dog owners and 13% of cat owners reported prescribed diets | Veterinary guidance supports repeat diet purchases |
Editorial readout:
Health-focused pet food works best when the claim solves a visible need. Calming, weight management, digestion, joint support, skin and coat, dental care, and senior formulas should be measured by owner understanding, pet acceptance, and repeat purchase.
Channel and Retail Statistics
Pet food is heavy, routine, and trust-led, so channel strategy matters. Grocery, mass, club, pet specialty, online, DTC, auto ship, veterinary, farm and fleet, dollar, and convenience channels all serve different types of owners.
Online and auto ship are strong because pet food is easy to reorder and often bought on a schedule. Pet specialty and veterinary channels support premium and health-led formulas. Club and mass channels matter for value, large bags, multi-pet homes, and price-sensitive households.
• Pet food remains a repeat-purchase retail category, which gives grocery, mass, club, pet specialty, and online channels strong roles.
• Online and auto ship matter because pet food is heavy, routine, and easy to reorder.
• Pet specialty remains important for premium, functional, breed, life-stage, and veterinary-adjacent formulas.
• Veterinary channels are important for prescription and therapeutic diets.
• Club and mass channels are important for value, large bags, multi-pet households, and affordability pressure.
• DTC and subscription models are important for fresh, personalized, premium, and refrigerated pet food.
| Channel | What it supports | Pet food implication |
|---|---|---|
| Grocery and mass | Routine pantry replenishment | Scale and price visibility |
| Club | Bulk bags and multi-pet households | Strong value and large-format fit |
| Pet specialty | Premium, functional, breed/life-stage formulas | Education and assortment depth |
| Online/auto ship | Scheduled replenishment and reviews | Convenience and retention |
| DTC/subscription | Fresh, personalized, premium diets | High-value niche growth |
| Veterinary | Prescription and therapeutic diets | Trust-led channel |
Editorial readout
Channel strategy matters because pet food combines a heavy recurring product with a high-trust household purchase. Online improves convenience, while pet specialty and veterinary channels support premium and health-led nutrition.
Regional US Pet Food Market Intelligence
Regional U.S. pet food statistics should not be read only by population. Demand is shaped by household type, dog/cat mix, income, pet specialty retail, online penetration, value pressure, premium nutrition behavior, and local feeding routines.
South
IMARC identifies the South as the largest U.S. pet food region. Large population, suburban households, dog ownership, value retail, and large-format dry food demand support the region. Southern demand should include both mainstream value products and premium formulas.
West Coast
IMARC identifies the West Coast as the fastest-growing region. Growth is supported by premiumization, natural pet foods, fresh food, online and DTC channels, pet humanization, and higher spending households across California, Oregon, and Washington.
Northeast
The Northeast supports premium, urban, online, cat food, wet food, and specialty nutrition demand. Dense markets such as New York, New Jersey, Massachusetts, Pennsylvania, and Connecticut can support specialty channels and smaller-format pet households.
Midwest
The Midwest remains important for value, dry food, large-bag purchases, farm and fleet retail, mainstream kibble, and multi-pet households. Illinois, Ohio, Michigan, Wisconsin, Minnesota, Missouri, and Iowa support a broad pet food base.
Mountain West
The Mountain West connects outdoor lifestyles, large dogs, rural and suburban homes, premium-natural products, and multi-pet households. Idaho, Montana, Colorado, Utah, Arizona, Nevada, and Wyoming add useful regional signals.
| Region | Demand signal | Market implication |
|---|---|---|
| South | Largest domestic region | Mainstream, large-format, value, and premium products matter |
| West Coast | Fastest-growing region | Fresh, premium, natural, online, and DTC demand are stronger |
| Northeast | Urban, premium, cat, wet food, online, specialty | Smaller households and premium channels matter |
| Midwest | Dry food, value, farm/fleet, large bags | Mainstream and value formats remain important |
| Mountain West | Outdoor, large-dog, rural/suburban, multi-pet | Natural and large-format feeding can overlap |
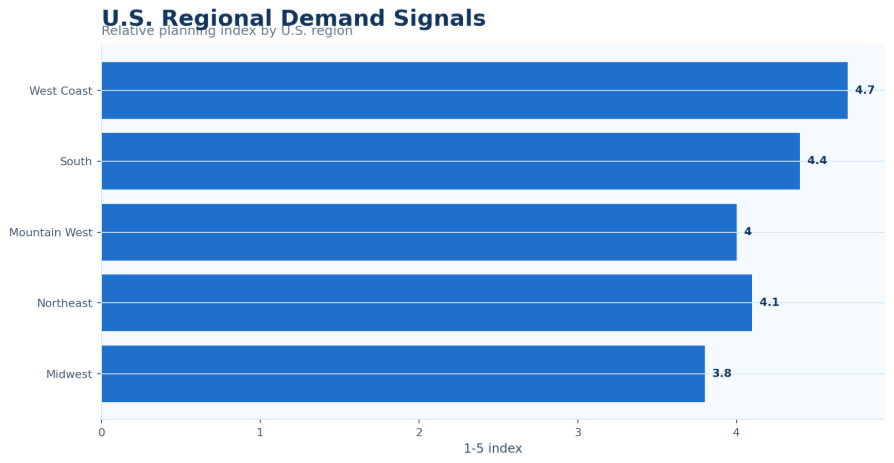
Figure 5. Regional demand signals show why pet food strategy differs between the South, West Coast, Northeast, Midwest, and Mountain West.
Editorial readout:
Region-level pet food demand is shaped by household structure, pet type, income, retail channel, value pressure, and premium nutrition behavior.
Export and Country-Level Signals
Country-level export statistics show that U.S. pet food demand is not only domestic. Canada, China, Mexico, Japan, and Australia help reveal where U.S. dog and cat food can compete through scale, quality, premium positioning, and supply-chain proximity.
• U.S. dog and cat food exports reached $2.52 billion in 2024.
• Canada was the largest listed export market at $1.24 billion.
• China was listed at $297 million.
• Mexico was listed at $235 million.
• Japan was listed at $112 million.
• Australia was listed at $106 million.
• Canada’s export role reflects proximity, trade integration, and similar pet food retail behavior.
• China’s position shows international demand for U.S. pet nutrition, although local competition is increasing.
• Mexico connects U.S. pet food exports to regional North American demand.
• Japan and Australia support premium, regulated, and quality-sensitive export demand.
| Country | Export signal | Market implication |
|---|---|---|
| Canada | $1.24 billion in 2024 | Scale, proximity, and similar retail behavior |
| China | $297 million in 2024 | Premium demand and international competition |
| Mexico | $235 million in 2024 | North American regional trade demand |
| Japan | $112 million in 2024 | Quality-sensitive and regulated premium market |
| Australia | $106 million in 2024 | Premium import demand and trusted supply |
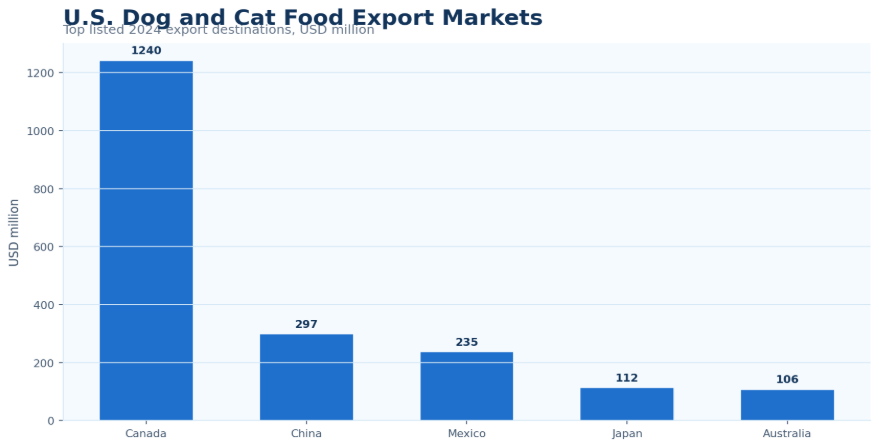
Figure 6. Canada leads listed U.S. dog and cat food export destinations, while China, Mexico, Japan, and Australia add country-level demand signals.
Editorial readout:
Export statistics show that U.S. pet food brands and manufacturers can compete beyond the domestic market when quality, safety, distribution, and pricing fit local demand.
Competitive Landscape and Brand Statistics
U.S. pet food competition is shaped by two forces at once: scale and specialization. Large brands control shelf space, manufacturing capacity, retailer relationships, and household trust. Premium, fresh, functional, and DTC brands create growth at the edges of the category by focusing on ingredients, transparency, personalization, and health benefits.
Large companies compete through mass distribution and portfolio depth. Premium brands compete through natural, limited-ingredient, fresh, frozen, freeze-dried, and humanization-led positioning. Veterinary diet brands compete through trust, clinical outcomes, and condition-specific nutrition. Private label competes on affordability and shelf control.
| Company group | Strength | Strategic signal |
|---|---|---|
| Global leaders | Scale, distribution, brand trust | Defend shelf positions |
| Premium/natural brands | Ingredient quality and transparency | Win through humanization and trust |
| Fresh/DTC brands | Subscription and personalization | Premium retention opportunity |
| Veterinary diet brands | Therapeutic trust | Condition-specific nutrition |
| Treat and snack brands | Bonding, training, dental, calming, joint | Health-led add-on purchases |
| Private label retailers | Affordability and shelf control | Important during value pressure |
Editorial readout:
U.S. pet food competition is not only about brand size. Winning products need trust, palatability, price fit, channel strength, and a clear feeding reason.
Pet Food Growth-Leak Diagnostic
Pet food growth leaks when brands chase premium positioning without solving a real pet or owner need. The strongest growth comes when nutrition, price, trust, channel access, and feeding routine work together.
| Problem area | Core signal | Useful benchmark |
|---|---|---|
| Market scale | Food and treats sales, forecast range | $65.8B in 2024 and $78B by 2030 |
| Pet ownership | Household penetration and pet type | 94M pet-owning households |
| Dog/cat mix | Dog food value and cat food growth | $40.9B dog food; $18.1B cat food |
| Format mix | Dry, wet, treats, fresh, freeze-dried | Dry food share at 57.18% |
| Health claims | Calming, weight, joint, skin/coat, dental | Calming use rose strongly since 2018 |
| Regional fit | South, West Coast, Northeast, Midwest, Mountain West | South largest; West Coast fastest growing |
Editorial readout:
Pet food growth leaks when a product has a premium price but weak trust, unclear benefit, poor channel fit, or limited repeat purchase logic.
90-Day US Pet Food Benchmark Plan
| Timing | What to do | Output |
|---|---|---|
| Days 1–30 | Map pet type, format, price tier, health claim, channel, region, and competitive set. | US pet food benchmark map |
| Days 31–60 | Compare dog food, cat food, treats, dry/wet/fresh food, functional nutrition, and channels. | Opportunity and risk matrix |
| Days 61–90 | Prioritize formats, regions, channels, and claims by repeat purchase, price fit, trust, and access. | Pet food scorecard |
Planning principle:
A practical U.S. pet food benchmark plan should connect household ownership with actual product behavior. The best opportunities are repeatable, trusted, affordable enough, and easy to buy.
Metrics US Pet Food Leaders Should Track
| Metric | Why it matters |
|---|---|
| Food and treats sales | recurring category scale |
| Dog food sales | Tracks the largest value pool |
| Cat food sales | Tracks faster feline growth signals |
| Dry/wet/treats mix | feeding routine and basket add-ons |
| Fresh and freeze-dried growth | Tracks premium humanization |
| Online/auto ship share | convenience and retention |
| Pet specialty/vet share | premium and therapeutic trust |
| Price per pound | affordability pressure |
| Regional growth | where to prioritize |
| Functional claim share | health-led differentiation |
| Repeat purchase | product-market fit |
Editorial readout:
The strongest U.S. pet food scorecard connects market value with owner behaviour. Sales, format mix, dog/cat split, channel mix, health claims, price pressure, and repeat purchase all matter.
Pet Ownership and Spending Behaviour
Pet ownership is the demand floor for U.S. pet food. The APPA/III ownership table lists 68 million dog-owning households and 49 million cat-owning households, while broader APPA reporting places pet-owning households near 94 million in the 2024–2025 survey period. That level of household penetration gives pet food a large recurring base before premium products, treats, or health formulas are even added.
Dog and cat ownership affect the market differently. Dogs create larger food volume because size, breed, age, and activity level shape how much food is needed. Cats create a different type of opportunity because wet food, palatability, hydration, indoor formulas, urinary health, digestive health, and smaller-format purchases matter more. The forecast showing cat food growth at 5.1% in 2025 makes feline nutrition more important than a simple household count suggests.
Spending behavior is also shaped by how owners think about pets. Pet humanization has moved many households toward better ingredients, cleaner labels, fresh or minimally processed products, functional treats, breed and life-stage formulas, and products that solve visible health problems. At the same time, value pressure keeps dry food, club channels, mass retail, private label, large bags, and smaller pack sizes important for budget-sensitive buyers.
• Dog-owning households create the largest food-volume base because dog size and feeding quantity raise total spend.
• Cat-owning households support wet food, palatability, hydration, and indoor health formulas.
• Multi-pet households often need value, bulk buying, and reliable retail access.
• Premium buyers may trade up for fresh, functional, human-grade, breed-specific, or limited-ingredient formulas.
• Price-sensitive households may compare price per pound, promotions, private labels, and large-format dry food.
| Owner behavior | What it changes | Market implication |
|---|---|---|
| Routine feeding | Food is purchased repeatedly | Retention and replenishment matter |
| Treat use | Training, bonding, rewards, and health support | Treats expand the food wallet |
| Health concern | Weight, joint, digestion, skin/coat, dental, calming | Functional nutrition solves visible problems |
| Premium trade-up | Fresh, natural, human-grade, limited ingredient | Raises spend but increases price sensitivity |
| Value pressure | Large bags, private label, club, mass, promotions | Affordability protects repeat purchase |
Editorial readout:
Pet ownership creates the market base, but spending behavior decides the value of each household. The strongest pet food products connect routine feeding with trust, price fit, and a clear benefit.
Pricing, Affordability, and Premiumization Signals
The U.S. pet food market is moving in two directions at once. Premiumization continues through fresh food, human-grade language, functional ingredients, freeze-dried formats, breed-specific formulas, and veterinary-linked nutrition. At the same time, affordability is becoming more important because pet food is a recurring household cost and owners must keep buying it regardless of economic pressure.
This makes price architecture a major market signal. Premium products can grow when they show a clear benefit, but value products protect volume when shoppers trade down. Dry food remains important partly because it balances nutrition, storage, price, and convenience. Wet food, fresh food, toppers, and functional treats can add spend, but they usually need a stronger reason to justify a higher price.
The strongest brands will not treat premium and value as separate worlds. Many owners combine formats: dry food as the base, wet food for palatability, treats for bonding, toppers for variety, and functional products for specific needs. That mixed feeding behavior creates room for premium add-ons while keeping core feeding affordable.
• Dry food protects volume because it is shelf-stable, convenient, and cost-effective.
• Wet food can raise spend through palatability, hydration, and cat-focused feeding routines.
• Fresh and refrigerated food rely on premium trust, humanization, and convenience.
• Functional treats can justify higher pricing when the benefit is visible and easy to understand.
• Private label and value retail matter when pet owners focus more on affordability.
| Pricing signal | What to watch | Action logic |
|---|---|---|
| Premium trade-up | Fresh, human-grade, freeze-dried, functional, natural | Use clear benefit and trust language |
| Value defense | Large bags, private label, mass, club, promotions | Protect repeat purchase and volume |
| Mixed feeding | Dry base plus wet, treats, toppers, fresh add-ons | Build basket value without replacing the core routine |
| Price per pound | Owner comparison across brands and channels | Track affordability by format |
| Health premium | Prescription, therapeutic, functional products | Use evidence and visible pet need |
Editorial readout:
Premiumization raises category value, but affordability keeps households buying. The strongest market position balances better nutrition with repeat-purchase price logic.
Pet Food Market Signal Flow
U.S. pet food statistics are most useful when they move from market size into owner behavior. A figure such as $65.8 billion in 2024 shows the size of pet food and treats, but it becomes more useful when it is tied to dog households, cat households, dry food share, dog food value, cat food growth, treats, health claims, and retail channel behavior.
The market signal begins with ownership. It then moves into pet type, feeding format, claim type, channel, region, and repeat purchase. Dog food is a large value pool, but cat food’s 5.1% projected growth in 2025 highlights a different opportunity. Dry food leads with 57.18% share, but wet food, treats, fresh food, freeze-dried products, and therapeutic diets add higher-value use cases.
The South leads domestic regional demand, the West Coast shows faster growth, and listed export markets such as Canada, China, Mexico, Japan, and Australia show where U.S. pet nutrition can compete internationally. The best reading is not a single headline number; it is the pattern between household demand, feeding behavior, product format, and trust.
• Market size shows category scale, but ownership shows the recurring demand base.
• Dog and cat food statistics explain different feeding economics and growth rhythms.
• Format mix shows how owners combine dry food, wet food, treats, fresh food, and health formulas.
• Channel statistics show where trust, convenience, price, and repeat purchase happen.
• Regional and export signals show where the same product may need a different price, pack, or claim.
Editorial readout:
The strongest pet food benchmark connects market value with feeding behavior. A product wins when it fits a pet need, matches an owner budget, earns trust, and can be purchased again without friction.
Ingredient, Formula, and Claim Strategy
Ingredient strategy is now a core part of the U.S. pet food market. Owners are not only comparing chicken versus beef or dry versus wet. They are also looking at protein quality, digestion, skin and coat, joint support, calming ingredients, weight management, dental benefits, grain-free or grain-inclusive positioning, limited-ingredient formulas, novel proteins, and transparency around sourcing.
Animal protein remains central because palatability and complete nutrition are the foundation of repeat purchase. Chicken, beef, turkey, lamb, salmon, and other fish ingredients all signal familiar nutrition to owners. Plant ingredients, grains, ancient grains, legumes, fiber sources, and vegetable inclusions can support digestion, energy, satiety, and value. The strongest formulas usually balance pet health, owner trust, texture, digestibility, and price.
Functional pet food claims need to be clearer than ordinary premium language. A calming treat is easy to understand when the owner sees anxiety during travel, storms, grooming, or separation. A weight-management formula is easy to understand when a veterinarian flags obesity. A dental treat is easy to understand when breath, chewing, and oral care are visible. A joint-support formula is easy to understand when an older dog has mobility issues.
The commercial challenge is not only adding functional ingredients. The product still needs a credible claim, good palatability, safe formulation, clear feeding instructions, and a channel where owners trust the message. Veterinary diets may work best through veterinary recommendation. Premium fresh products may work through subscription and DTC education. Functional treats may work through pet specialty, online reviews, and visible benefit language.
• Protein quality remains the base signal because pets need complete nutrition and owners connect meat ingredients with trust.
• Digestive formulas work best when prebiotics, probiotics, fiber, or sensitive-stomach language connect with a clear pet need.
• Skin and coat formulas benefit from omega-3, fish oils, and visible improvement signals.
• Joint formulas are strongest for senior dogs, large breeds, mobility concerns, and repeat supplement-style feeding.
• Weight-management diets connect pet food with veterinary guidance, obesity concern, and controlled feeding routines.
• Calming products show how behavioral concerns can become a functional pet nutrition opportunity.
| Formula area | Owner-facing reason | Market implication |
|---|---|---|
| Protein quality | Trust, palatability, complete nutrition | Core repeat-purchase driver |
| Digestive health | Sensitive stomach, stool quality, gut support | Clear functional fit |
| Skin and coat | Visible condition and omega support | Benefit can be seen by owner |
| Joint support | Aging, large breeds, mobility | Senior and therapeutic opportunity |
| Weight management | Obesity and vet advice | Condition-specific repeat demand |
| Calming | Anxiety, travel, storms, separation | Behavior-led benefit |
Editorial readout:
ormula strategy works when the claim solves a visible pet need. The most valuable pet food products make the benefit clear without weakening taste, trust, or repeat-purchase price logic.
Retail Execution and Repeat Purchase Signals
Retail execution is where U.S. pet food statistics turn into sales. A product can have the right claim and still struggle if it is placed in the wrong channel, priced above the owner’s comfort level, or packaged in a way that does not explain the benefit quickly. Because pet food is heavy and recurring, convenience often matters as much as brand message.
Auto ship and online ordering have changed how owners think about replenishment. Once a food works for a pet, the owner may prefer a predictable reorder system rather than repeated in-store shopping. This creates loyalty opportunities, but it also raises expectations for availability, delivery reliability, price comparison, and subscription flexibility.
In-store retail still matters because many owners discover new products on the shelf. Pet specialty can explain premium and functional products better than general retail. Grocery and mass retail can scale mainstream food and treats. Veterinary channels can support prescription and therapeutic diets. Club stores can protect price-sensitive bulk purchases, while farm and fleet stores remain important for large dogs and rural households.
• Repeat purchase is the most important signal because pet food must work for both owner and pet.
• Auto ship supports retention when the product is trusted and feeding routines are stable.
• Pet specialty supports premium formulas, functional treats, and product education.
• Veterinary channels support therapeutic diets and condition-specific nutrition.
• Mass, grocery, and club channels protect scale, value, and routine replenishment.
Editorial readout:
The strongest retail strategy matches the product to the owner’s buying routine. Premium products need education and trust, while mainstream products need availability, value, and easy repeat purchase.
Pet Food Market Signal Flow
Pet food demand should be read through the owner’s routine rather than as a loose set of annual totals. The strongest signal is how a household moves from ownership to feeding format, health need, retail channel, regional demand, and repeat purchase.
| Signal | What to compare | Action logic |
|---|---|---|
| Ownership base | Dog, cat, multi-pet, and household type | Match pack size and feeding routine |
| Format mix | Dry, wet, treats, toppers, fresh, freeze-dried | Build basket value without replacing the core diet |
| Health need | Weight, calming, joint, skin/coat, dental, digestion | Use claims that solve visible pet problems |
| Channel fit | Mass, grocery, club, pet specialty, online, vet | Match price, trust, and explanation needs |
| Regional demand | South, West Coast, Midwest, Northeast, export markets | Adjust assortment, price, and claims by market |
Editorial readout:
The strongest pet food benchmark links household ownership with feeding behavior, product format, health need, channel fit, regional demand, and repeat purchase. A product wins when it solves a visible pet need and stays easy to buy again.
Pet Food Market in the US Market Statistics FAQ
Common questions
• How large is the U.S. pet food market?
The answer depends on scope. Pet food and treats reached $65.8 billion in 2024, while IMARC estimates the pet food-only market at $46.90 billion in 2025.
• How much did Americans spend on pet food and treats?
Pet food and treats reached $65.8 billion in 2024, with APPA projections moving to $67.8 billion in 2025 and $69.7 billion in 2026.
• Is the U.S. pet food market growing?
Yes. Growth is shaped by price pressure, premiumization, functional nutrition, online channels, pet ownership, and recurring feeding routines.
• Which is larger: dog food or cat food?
Dog food remains larger by value, with $40.9 billion projected for 2025, while cat food is projected at $18.1 billion and is growing faster in the cited forecast.
• Which product format leads the U.S. pet food market?
Dry pet food leads, with IMARC reporting 57.18% share. Dry food remains strong because of price, shelf stability, storage, and routine feeding.
• Which U.S. region leads pet food demand?
IMARC identifies the South as the largest U.S. pet food region, supported by population, suburban households, dog ownership, and large-format purchases.
• Which U.S. region is growing fastest?
IMARC identifies the West Coast as the fastest-growing region, supported by premiumization, fresh food, natural pet food, online channels, and pet humanization.
• Which export markets matter for U.S. dog and cat food?
Canada, China, Mexico, Japan, and Australia are key listed export destinations. Canada leads the listed group at $1.24 billion in 2024.
• What metrics should pet food companies track?
Useful metrics include market value, dog/cat split, dry/wet mix, treats, channel mix, premium share, online/auto ship, regional growth, export values, repeat purchase, and health-claim demand.
Final Takeaway
The routine matters most for growth. Brands that protect that loop are better placed to hold share across formats, channels, and regions. That final purchase loop is the clearest sign of durable demand.
The winning product is not only the one with the strongest claim; it is the one that fits the pet, the owner’s budget, the preferred store or delivery path, and the next repeat purchase.
In practice, the retention signal is simple: a pet food product needs a clear role in the household basket. Core food keeps the pet fed, treats support behavior and bonding, health formulas solve specific needs, and channels decide whether the owner can keep the routine going.
The most useful benchmark is whether a pet owner can keep buying the product without hesitation. That depends on taste acceptance, visible pet response, trust in the claim, store or delivery access, pack size, and price fit. When those signals align, pet food moves from a one-time trial into a stable recurring purchase.
Brands should also avoid treating premiumization as the only growth path. Premium products can improve value when the benefit is clear, but value products protect volume when households compare prices more closely. A strong portfolio usually needs both: a dependable core food routine and higher-value add-ons that make sense for specific health, taste, or convenience needs.
That is why the best U.S. pet food reading is a practical one. Market size confirms the size of the opportunity, but owner behavior explains where value is actually created. Dog food, cat food, treats, dry food, wet food, fresh food, prescription diets, and functional snacks all need different claims, different channels, and different price logic.
The clearest market signal is retention. Pet food brands can attract trial with price, flavor, ingredients, or claims, but long-term value depends on pet acceptance, owner trust, pack convenience, and frictionless repeat purchase.
The U.S. pet food market is a recurring-spend category anchored by pet ownership, dog and cat nutrition, treats, dry food, wet food, premiumization, health claims, retail channel shifts, and regional behavior. The market is large, but its real strength is repeat purchase.
The practical goal is not only to know that pet food spending is growing. The stronger benchmark is whether a product fits a real pet need, solves a clear owner problem, sits in the right channel, stays affordable enough for repeat purchase, and earns trust through nutrition, brand reliability, palatability, and visible pet benefits.
Pet food leaders should read the market through both scale and behavior. A large market forecast shows opportunity, but owner loyalty, format fit, pet health needs, price sensitivity, and channel convenience decide which products turn that opportunity into sales.