A research-backed statistics report on self-employed workers, independent contractors, nonemployer businesses, regional labor-market differences, informal work, income quality, and the future of independent earning.
Self-employment is best understood as a spectrum rather than a single labor label. At one end are necessity-driven workers using informal or own-account work to replace limited wage employment. At the other end are independent consultants, creators, tradespeople, and professional service providers who use self-employment as a deliberate business model. The statistics matter because the same headline category can describe both economic vulnerability and high-value independence.
That is why this report gives equal weight to worker counts, business counts, income quality, regional context, and operating discipline. A country with a high self-employment share is not automatically more entrepreneurial, and a country with a lower share is not automatically less dynamic. The real question is whether independent work produces durable income, repeat customers, reliable payments, tax readiness, benefits coverage, and enough pricing power to survive quiet months.
Self-employment is not one simple category. It includes solo business owners, independent contractors, own-account workers, freelance professionals, small employers, platform workers, agricultural workers, informal traders, creators, consultants, and people who combine client work with traditional employment. That variety is exactly why self-employment statistics need careful interpretation. A high self-employment rate can signal entrepreneurial opportunity in one country, limited formal employment in another, and a mature professional-services contractor market somewhere else.
A more useful framing is that self-employment is a labor-market structure, a business model, and a household-risk strategy at the same time. Some people use it to build scalable expertise, sell products, or control their schedule. Others use it because the formal job market is thin, caregiving duties make fixed employment hard, or local work is organized around informal trade and family enterprise. That is why the strongest self-employment statistics are not only headcounts. They also show whether the work produces stable cash, better bargaining power, portable benefits, and durable customer relationships.
The most useful way to read the data is to separate scale from quality. Headcount tells us how many people work outside a standard employee arrangement. Income, benefits, repeat clients, business receipts, social protection, and formality tell us whether that work is economically strong. This report uses benchmark clusters and concise interpretation blocks so the numbers show where self-employment creates flexibility, where it creates risk, and how the pattern differs by region.
Self-Employment Statistics: Key Benchmarks
These headline benchmarks define the scale of self-employment across major economies and data systems. They should not be treated as direct equivalents. A nonemployer business count, an independent-contractor survey, a labor-force self-employment share, and an online gig-work estimate each measure a different slice of independent work.
Core scale and market structure
• OECD defines the self-employment rate to include employers, own-account workers, members of producers’ cooperatives, and unpaid family workers as a share of total employment.
• World Bank and ILO-based indicators track self-employed workers as a percentage of total employment, which makes cross-country comparison possible but does not automatically measure business quality.
• ILO research indicates that almost seven in 10 workers worldwide are self-employed or work in small businesses.
• The World Bank estimates the global online gig workforce at 154 million to 435 million people, depending on measurement method.
• Online gig work represents roughly 4.4% to 12.5% of the global labor force under the World Bank range.
• Eurostat reports self-employed people accounted for 14.2% of total EU employment by persons in 2025.
• Self-employed people accounted for 17.5% of EU hours worked in 2025, above their headcount share.
• Greece had the EU’s highest self-employed share in 2025 at 24.8% of employment.
• Bulgaria followed closely with a 24.6% self-employed share in 2025.
• The UK’s ONS self-employment jobs series declined from 4.693 million in 2019 Q4 to about 4.037 million in 2025 Q4.
• India’s PLFS reported a self-employment share of 56.2% of workers in 2025.
• India’s female self-employment share stood at 64.2% in 2025, far above the male share of 52.0%.
• Brazil had 26.2 million self-employed workers in the quarter ended January 2026.
• Brazil’s informal workforce totaled 38.5 million people in the November 2025-January 2026 period.
• Mexico’s self-employment share was 31.35% of total employment in 2023.
• Pakistan’s self-employment share was 57.11% of total employment in 2023.
• Canada had nearly 2.7 million self-employed workers in 2023, equal to 13.2% of the employed population.
• Australia had 1.1 million independent contractors in August 2025, equal to 7.6% of all employed people.
• Census NES-D counted 30.4 million U.S. nonemployer businesses in 2023.
• MBO Partners reported 5.6 million U.S. independent workers earning more than $100,000 annually in 2025.
• One 2025 U.S. estimate placed full-time self-employment near 16.8 million people, or about 10.3% of the workforce.
The headline story is not simply that self-employment is growing everywhere. It is that independent work is distributed across very different economic realities. In the United States, nonemployer business receipts and high-income independent workers show a sizeable professional and entrepreneurial layer. In India, Brazil, Mexico, and parts of Africa, high self-employment shares also reflect informal work, household enterprise, and limited access to formal jobs. A serious statistics article has to keep those meanings separate.
How to Read Self-Employment Statistics Correctly
Self-employment data is easy to misread because the label is broad. Some datasets count people. Others count businesses. Some ask about a worker’s main job, while others include side income. Platform studies often count registered or active online workers, while official labor-force surveys use narrower employment classifications. The result is that a country can appear to have millions of self-employed workers in one source and a different independent-worker figure in another without either source being wrong.
Measurement rules that matter
• A self-employed worker can be an employer, an own-account worker, a member of a cooperative, or an unpaid family worker under OECD-style definitions.
• A freelancer is usually a narrower term for a person selling services independently, often project by project.
• An independent contractor is usually defined by work arrangement and legal classification rather than by business size.
• A nonemployer business is a business with no paid employees, which can include many solo owners but does not equal a worker count.
• A gig worker may be self-employed, but gig work can also be temporary, platform-mediated, informal, or supplemental.
• A high national self-employment share can reflect opportunity, necessity, agricultural work, informality, tax structure, family enterprise, or professional contracting.
• Survey-based independent-worker counts usually run higher than official main-job contractor counts because they include side workers and mixed-income earners.
• Business-registration datasets can show more entities than labor-force datasets because one person can own more than one entity or maintain a business with low annual activity.
• Income comparisons must account for unpaid labor, benefits, pension contributions, tax obligations, equipment costs, platform fees, and unpaid client-acquisition time.
• Regional comparisons should separate formal solo businesses from informal self-employment, especially in economies where wage employment is limited.
This measurement caution is not a technical footnote. It changes the interpretation of every number in the report. A rise in high-income independent consultants means something different from a rise in low-paid own-account work. A large nonemployer business count means something different from a high informal employment rate. The strongest self-employment analysis therefore combines headcount, income quality, business receipts, benefits access, and regional context.
The distinction is especially important for readers comparing self-employment with freelancing. A freelance designer with recurring retainers, a tax-registered plumbing business, a small farmer, a street vendor, an app-based driver, and a self-employed lawyer all carry independent-work characteristics. But they face different pricing power, capital needs, legal obligations, business records, customer acquisition costs, and exposure to downturns. Treating them as one market hides the practical decision points that matter most.
Global Self-Employment Scale and Regional Differences
Globally, self-employment sits at the intersection of entrepreneurship, labor-market flexibility, informality, and social protection. In higher-income economies, self-employment often includes consultants, tradespeople, creators, independent professionals, small employers, and platform workers. In lower-income and emerging markets, it often includes own-account retail, agriculture, family enterprise, informal services, and household production. The same label covers both opportunity and necessity.
Global and regional indicators
• ILO research shows self-employed workers and micro-enterprises account for more than 80% of employment in South Asia.
• TheGlobalEconomy reports Africa’s average self-employment share at 63.51% across 51 countries in 2023.
• Central African Republic had a 94.54% self-employment share in 2023, the highest among the African countries covered in that dataset.
• Libya had a 15.09% self-employment share in 2023, the lowest among the African countries covered.
• Latin America and the Caribbean still show high informality, with OECD reporting a benchmark near 55% informal employment across 27 countries.
• The online gig-work market is global, but the World Bank’s 154 million to 435 million estimate includes very different worker types and activity levels.
• South Asia’s high self-employment share is heavily tied to household enterprise, agriculture, informal services, and constrained wage-employment options.
• In developed markets, self-employment shares are usually lower, but business receipts, rates, and professional-service income can be much higher.
• Regional self-employment comparisons should therefore be read as labor-structure indicators, not entrepreneurship rankings.
The global pattern makes one point clear: self-employment is not a single modernization story. Digital platforms, remote work, and AI tools are making some independent work more scalable. At the same time, millions of people remain self-employed because local labor markets do not provide enough stable wage jobs. Both realities can exist in the same global category.
How regional self-employment should be interpreted
Regional comparisons become much more useful when they are tied to the reason self-employment exists in that market. In a high-income professional-services economy, self-employment may signal consulting capacity, flexible contracting, or small-business ownership. In an emerging economy with limited formal wage jobs, a high self-employment share may instead point to informality, household enterprise, or weak social protection. Both patterns are economically important, but they require very different business and policy responses.
• In developed markets, the most useful questions are often about income stability, client concentration, tax compliance, retirement saving, and whether solo firms can move from one-off projects to repeat revenue.
• In emerging markets, the same headline statistic needs to be read alongside informality, access to bank accounts, digital payment adoption, social insurance coverage, and the availability of formal business registration.
• In platform-heavy markets, self-employment data should separate people using platforms as supplemental income from workers who depend on platforms as their primary source of earnings.
• In professional and technical categories, the most important indicator is not only the number of independent workers but whether those workers can command premium rates, protect margins, and build repeatable customer pipelines.
This regional lens prevents treating every self-employed worker as if they are following the same path. A consultant in London, a nonemployer business owner in the United States, a platform worker in South Asia, and an informal street trader in Latin America may all appear in self-employment datasets, but the financial systems around them are completely different. The strongest use of the statistics is to identify which forms of independent work are becoming more productive and which still need better protection, payment access, and business infrastructure.
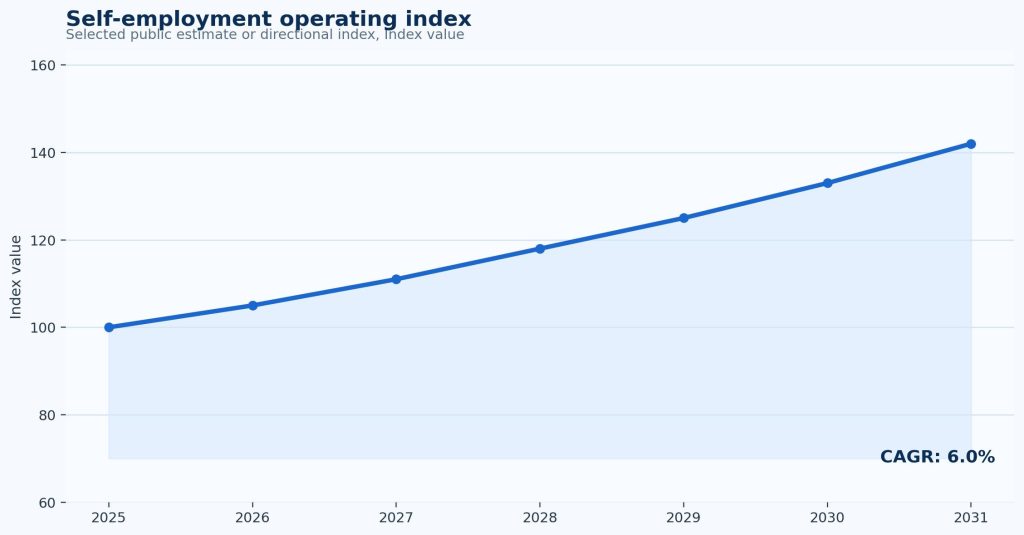
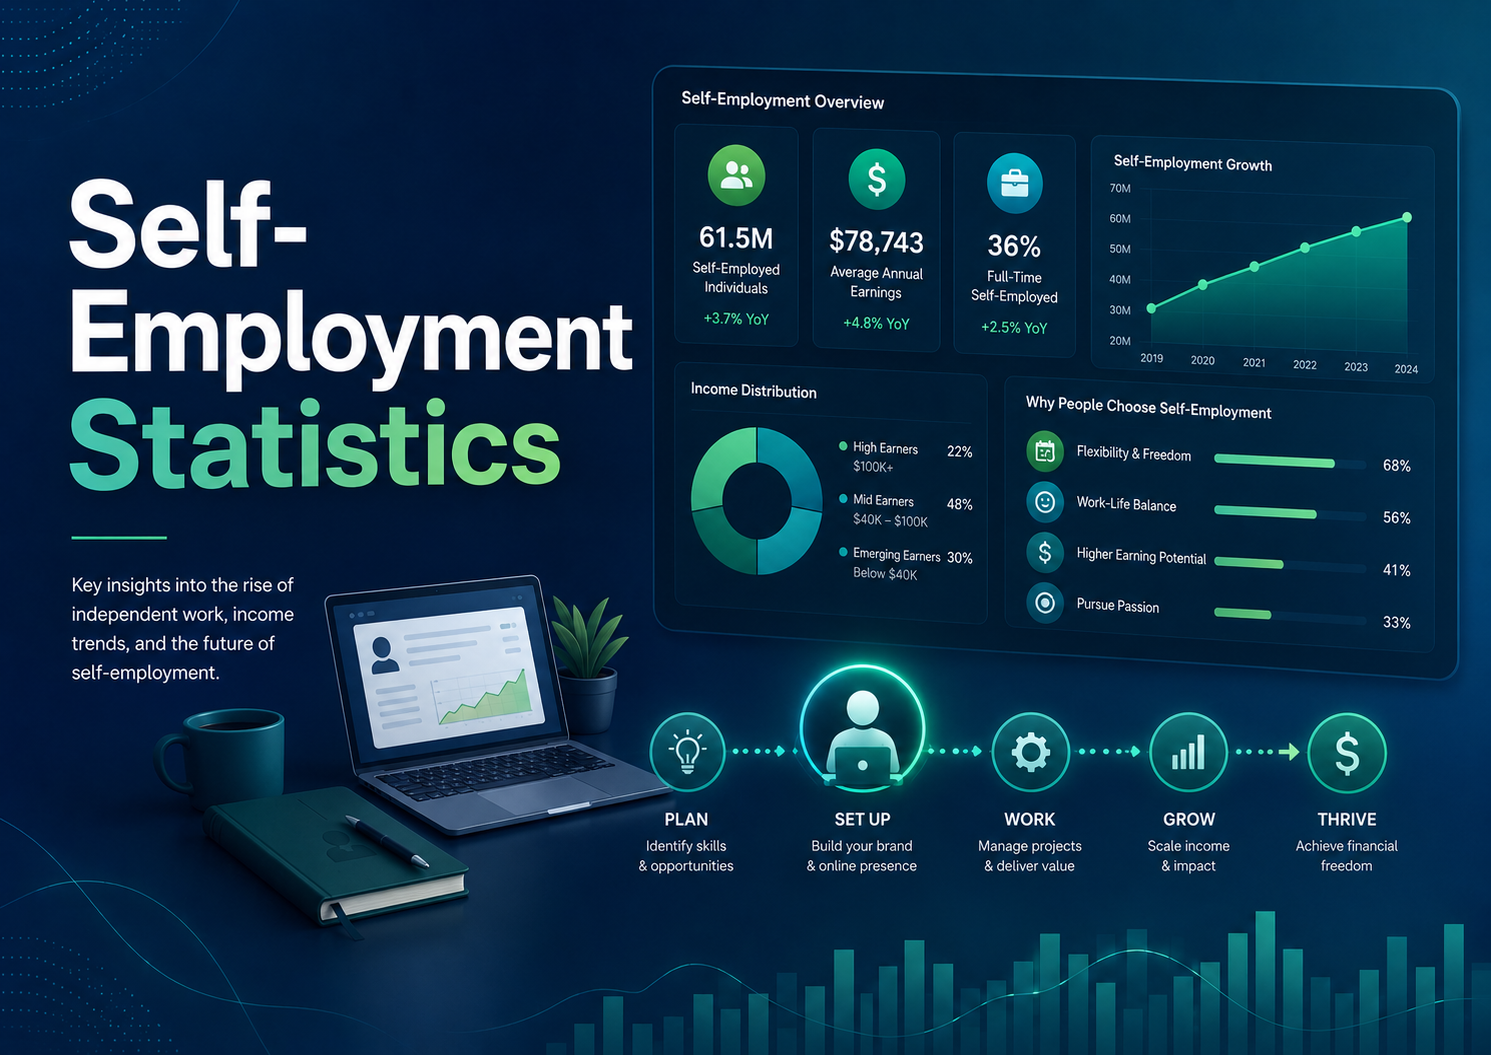
Figure 1. Self-employment operating index shows the directional expansion of independent-work activity and should be read as a planning signal rather than a single official headcount.
United States Self-Employment and Nonemployer Businesses
The United States shows why worker counts and business counts need to be read together. Official labor statistics can capture people whose main job is self-employment or independent contracting. Census nonemployer data captures solo businesses without paid employees. Independent-work surveys capture a broader market of consultants, freelancers, creators, contractors, and people combining multiple income streams. Together, these datasets show a large and economically meaningful independent-work sector.
U.S. self-employment and business-count benchmarks
• Census NES-D counted 30.4 million U.S. nonemployer businesses in 2023.
• Nonemployer businesses are firms with no paid employees, making the dataset one of the clearest windows into solo-business activity.
• A 2025 estimate placed U.S. full-time self-employment at 16.77 million, up slightly from 16.74 million in 2024.
• Another estimate placed U.S. self-employment near 16.8 million, or roughly 10.3% of the workforce.
• MBO Partners reported 72.7 million U.S. adults in independent-work arrangements in 2024.
• MBO’s independent-worker count rose from 38.2 million in 2020 to 72.7 million in 2024, a roughly 90% increase.
• BLS found 11.9 million people were independent contractors on their sole or main job in July 2023, equal to 7.4% of total U.S. employment.
• MBO reported a record 5.6 million U.S. independent workers earning more than $100,000 annually in 2025.
• The number of U.S. independents earning more than $100,000 rose from 4.7 million in 2024 to 5.6 million in 2025, a nearly 19% increase.
• High-income independent work shows the upside of the category, but it should not be used as the typical outcome for all self-employed workers.
The practical takeaway is that the U.S. independent-work sector has two very different faces. One face is a high-income professional market where independent consultants, creators, technical specialists, skilled tradespeople, and business owners can build substantial income. The other is a mixed-income market where self-employed people carry their own taxes, benefits, retirement planning, marketing costs, and income volatility. Strong analysis needs both perspectives.
What U.S. businesses should track
• Client concentration: the share of revenue tied to the largest client or customer account.
• Repeat revenue: the percentage of annual income coming from recurring clients, contracts, retainers, or repeat buyers.
• Effective hourly income: net income after unpaid sales time, administration, taxes, tools, insurance, and platform fees.
• Cash runway: the number of months the business can operate if client work slows.
• Retirement and benefits coverage: whether the self-employed person is replacing employer-provided health, retirement, and leave benefits.
• Business entity activity: whether a nonemployer business is generating meaningful receipts or simply exists as a low-activity entity.
What the U.S. data means for planning is that self-employment sits between labor statistics and small-business statistics. A worker count tells us how many people operate outside employee arrangements. A nonemployer business count tells us how many solo entities exist. Receipt and income data tell us whether those entities are economically meaningful. The healthiest analysis uses all three layers instead of relying on a single headline figure.
This also matters for software, payments, and invoicing decisions. A self-employed person may start with simple payment links and spreadsheets, but growth usually creates a need for cleaner estimates, invoices, expense records, tax categories, recurring billing, client history, and payment follow-up. Better administration does not create demand by itself, but it prevents successful independent work from becoming disorganized as client volume grows.
Europe and the United Kingdom
Europe and the United Kingdom show a more regulated and mature view of self-employment. The region includes solo professionals, family businesses, small employers, tradespeople, creative workers, legal and accounting contractors, consultants, and platform workers. The headline self-employment share is useful, but the deeper story is in country differences, hours worked, pensions, regulation, and sector mix.
European self-employment benchmarks
• Eurostat reported a 14.2% EU self-employment share by persons in 2025.
• Self-employed people accounted for 17.5% of EU hours worked in 2025, above the 14.2% headcount share.
• Greece had the EU’s highest self-employed share at 24.8% in 2025.
• Bulgaria had a self-employed share of 24.6% in 2025.
• Italy remained one of the EU’s higher self-employment markets, reflecting the role of small firms, family businesses, and professional work.
• Nordic and some large Western European labor markets tend to show lower self-employment shares because formal employee arrangements are more common.
• The gap between the EU headcount share and hours-worked share suggests self-employed people often work longer or more variable hours than their employment share alone implies.
• Country-level self-employment rates need to be read alongside social insurance, taxation, pension rules, industry structure, and labor-market regulation.
United Kingdom signals
• The ONS self-employment jobs series declined from 4.693 million in 2019 Q4 to about 4.037 million in 2025 Q4.
• IPSE reported the solo self-employed contributed £366 billion to the UK economy in 2024.
• UK self-employment is closely tied to consulting, trades, professional services, creative work, personal services, and small local businesses.
• The UK data also highlights a retirement and pension issue because many self-employed workers must replace employer pension contributions on their own.
• Older self-employed workers often stay independent for flexibility, but the arrangement can expose savings, pension, and income-protection gaps.
Europe’s lesson is that self-employment can be economically sophisticated even when the headline share is modest. The more important questions are whether the worker has pricing power, pension coverage, reliable demand, and protection against income interruption. For businesses hiring self-employed professionals, the key issue is not only cost flexibility; it is continuity, compliance, and the ability to maintain quality across independent contributors.
The hours-worked gap in the EU is a useful reminder that workload and worker count are not the same thing. If self-employed people account for a larger share of hours than of persons, the business question becomes whether those hours are productive, fairly priced, and financially protected. A solo professional can work many hours and still under-earn if too much time is spent on sales, travel, admin, revisions, unpaid consultations, or late-payment follow-up.
The UK decline from the pre-pandemic peak also shows that self-employment can contract when tax rules, demand patterns, labor-market conditions, and risk preferences change. Some workers return to employment for stability. Others remain independent because they value autonomy or can command strong rates. The useful metric is not whether self-employment is always rising; it is whether the people who choose it have enough income quality and protection to make the model sustainable.
India, South Asia, and Emerging-Market Self-Employment
India and South Asia show a very different self-employment structure from North America or Western Europe. A large share of workers are self-employed, but that does not always mean formal entrepreneurship. It can include household enterprise, own-account work, agriculture, informal services, and low-margin local activity. This is why the quality of self-employment matters as much as the share of workers in the category.
India and South Asia benchmarks
• India’s PLFS reported the self-employment share declined from 57.5% in 2024 to 56.2% in 2025.
• India’s self-employment share moved from 58.2% in 2023 to 57.5% in 2024 and 56.2% in 2025.
• India’s male self-employment share was 52.0% in 2025.
• India’s female self-employment share was 64.2% in 2025, far above the male share.
• Female self-employment in India fell from 66.5% in 2024 to 64.2% in 2025, but remained very high.
• Average male self-employment earnings in India rose from ₹16,893 in 2024 to ₹17,914 in 2025, about 6.0% growth.
• Average female self-employment earnings in India rose from ₹5,861 in 2024 to ₹6,374 in 2025, about 8.8% growth.
• Despite faster percentage growth, the female earnings level remained far below the male earnings level.
• ILO research says self-employed workers and micro-enterprises account for more than 80% of employment in South Asia.
• Pakistan’s self-employment share was 57.11% of total employment in 2023.
The gender pattern is especially important. A high female self-employment share can reflect enterprise activity, but it can also reflect limited access to stable paid jobs, household constraints, unpaid family work, or low-margin microenterprise. For policy and business planning, the key question is whether self-employment is raising income, building assets, increasing control over work, and improving access to social protection.
The earnings gap in India is one of the clearest examples of why self-employment needs a quality lens. A higher female self-employment share may look positive if it is read only as participation, but the income numbers show that many women are concentrated in lower-paid activity. That can reflect social constraints, unpaid care work, limited mobility, lack of capital, weak market access, or work that is formally counted but economically thin. Good policy would therefore measure not only entry into self-employment but also earnings growth, business survival, formalization, access to finance, and control over income.
Why emerging-market self-employment needs a quality lens
• Rising self-employment is positive when it creates higher income, asset ownership, business growth, and bargaining power.
• Rising self-employment is more fragile when it reflects a shortage of formal jobs or low-paid necessity work.
• A self-employed worker with one small local activity, no savings buffer, and no social insurance faces a different risk profile from a formal independent consultant.
• Digital tools can improve market access, payments, invoicing, and records, but they do not automatically turn low-margin work into secure income.
• The strongest policy metrics combine headcount with income, social protection, working hours, gender gaps, business survival, and access to finance.
Latin America, Brazil, Mexico, and Informality
Latin America is one of the most important regions for understanding the overlap between self-employment and informality. In many countries, self-employment is a major part of the labor market, but the strength of that work depends heavily on formal registration, tax compliance, access to benefits, payment reliability, and whether workers can move from survival activity into stable business income.
Regional and country indicators
• OECD reports informal employment near 55% across 27 Latin American and Caribbean countries.
• Brazil had 26.2 million self-employed workers in the quarter ended January 2026.
• Brazil’s informal workforce totaled 38.5 million people in the November 2025-January 2026 period.
• Brazil’s labor informality rate was 37.5% in the November 2025-January 2026 period, its lowest since the quarter ending July 2020.
• Mexico’s self-employment share was 31.35% of total employment in 2023.
• One Mexico labor-market report placed independent workers at a record 16.6 million in Q3 2025.
• Latin American self-employment often includes retail trade, transportation, personal services, household enterprise, local food, construction, and informal work.
• A falling informality rate can be positive, but the absolute number of informal workers still matters for tax coverage, benefits, and income security.
• Digital payments, e-invoicing, mobile banking, and platform work can improve records, but they can also expose small earners to new compliance and fee pressures.
Working for oneself can create independence, but it can also mean carrying all income risk without the protections normally attached to formal employment. The most valuable progress is not only more self-employment; it is better-quality self-employment with clearer records, stronger customer demand, safer payment flows, and more predictable income.
Canada, Australia, and Other Developed Markets
Canada and Australia provide useful comparison points because their self-employment shares are lower than many emerging-market rates, but the work is often more formalized. These markets show how independent work overlaps with professional contracting, skilled trades, small local businesses, gig work, and non-employing business structures.
• Canada had nearly 2.7 million self-employed workers in 2023, representing 13.2% of the employed population.
• Statistics Canada research found an average of 624,000 mainly self-employed working-age Canadians had gig work as a main job from October to December 2022.
• That gig-work figure represented about 27% of mainly self-employed working-age Canadians during the measurement window.
• Australia had 1.1 million independent contractors in August 2025.
• Independent contractors represented 7.6% of all employed people in Australia in August 2025.
• Australia’s non-employing business base is important because many self-employed people operate as registered businesses without staff.
• In developed markets, the key policy issues often include retirement savings, insurance, contractor classification, tax compliance, and income volatility rather than only access to work.
The practical lesson from these markets is that formal systems reduce some risks but do not eliminate them. A self-employed worker may have stronger contract rights, digital records, or banking access, while still needing to fund insurance, retirement, tax reserves, downtime, and client acquisition personally.
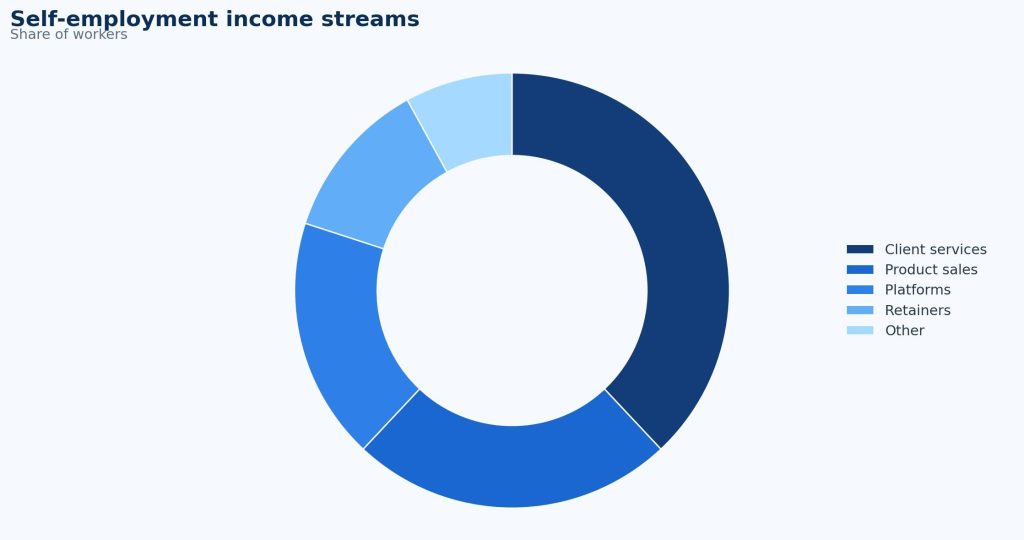
Figure 2. Self-employment income streams highlights why independent workers often need multiple revenue channels rather than relying on one client, platform, or product line.
Income Quality, Benefits, and Financial Risk
The most important self-employment question is not “how many people work for themselves?” It is “what kind of economic position does that work create?” Income quality determines whether self-employment becomes a durable business model or a fragile substitute for wage employment. A worker can be counted as self-employed while having very different levels of pricing power, savings, benefits, and client stability.
Income-quality signals
• MBO’s 5.6 million U.S. independents earning more than $100,000 show that self-employment can support high-income careers.
• The increase from 4.7 million to 5.6 million $100k+ U.S. independents in one year shows growth at the top end of the independent-work market.
• India’s 2025 male self-employment earnings average of ₹17,914 and female average of ₹6,374 show why headcount must be paired with income quality.
• The gender earnings gap in Indian self-employment shows that a high self-employment share does not automatically mean equal opportunity.
• OECD’s roughly 55% informal-employment benchmark for Latin America and the Caribbean shows how self-employment can overlap with limited social protection.
• Brazil’s 37.5% informality rate shows improvement, but the 38.5 million informal-worker count still signals a major protection gap.
• UK self-employed workers face pension and retirement-planning challenges because they do not receive employer pension contributions in the same way employees do.
• Independent workers must often self-fund health insurance, retirement savings, paid leave, professional tools, marketing, training, taxes, and income gaps.
• Client concentration is one of the largest hidden risks: a self-employed worker with one dominant client may have employee-like dependency without employee-like protection.
• Platform dependence can create the same problem when pricing, ranking, visibility, fees, and access to customers are controlled by the platform.
Income quality is also about timing. Employees usually receive predictable pay periods, while self-employed workers may face delayed invoices, seasonal demand, late client payments, upfront supply costs, and irregular project cycles. A strong independent business therefore needs a cash buffer, tax reserve, repeat customer base, and realistic pricing model. Without those controls, a high gross revenue number can still produce weak net income.
The self-employed income checklist
• Gross revenue: the total amount invoiced, sold, or received before costs.
• Net income: gross revenue minus tools, platform fees, materials, taxes, insurance, travel, software, and unpaid admin time.
• Effective hourly income: net income divided by all working time, including sales, admin, revisions, travel, client calls, and collections.
• Repeat-revenue share: the percentage of income from repeat clients, retainers, subscriptions, or recurring buyers.
• Concentration risk: the share of annual income tied to the top one, three, or five customers.
• Benefits replacement: the amount needed to replace health coverage, pension contributions, paid leave, disability coverage, and other employee benefits.
• Runway: the number of months the worker can cover personal and business expenses if demand slows.
Where income quality breaks down first
The income-quality problem usually appears before a self-employed worker notices it in annual profit. A strong month of gross revenue can hide unpaid quoting time, late invoices, platform fees, equipment costs, tax liabilities, and the cost of replacing a lost client. For that reason, self-employed income should be analyzed as a business system rather than a paycheck replacement.
• Client concentration is often the first warning signal. A self-employed worker with one dominant client may have high revenue but limited resilience if that client pauses work, changes procurement rules, or delays payment.
• Effective hourly income can be much lower than the visible project rate when unpaid sales calls, revisions, administration, travel, learning time, software, taxes, and payment chasing are included.
• Benefits gaps change the real comparison with employment. A worker who earns more gross income independently may still be worse off if they underfund health coverage, retirement saving, paid leave, or insurance.
• Seasonality matters because many self-employed workers do not earn evenly across the year. A strong annual total can still create cash stress if revenue arrives in uneven bursts.
• Pricing power separates durable independent businesses from fragile self-employment. Workers with specialized expertise, repeat buyers, strong referrals, and measurable outcomes can usually protect margins better than workers competing only on speed or hourly cost.
Self-employment can create autonomy and high earnings, but only when the worker has enough control over pricing, customer selection, payment terms, and workload. Without those controls, self-employment can become a form of income volatility with business responsibilities but limited business leverage.
Who Is Self-Employed: Gender, Age, Migration, and Life Stage
Self-employment is shaped by life stage as much as by industry. Some workers choose independence for flexibility, professional autonomy, caregiving compatibility, retirement transition, or higher earnings. Others enter self-employment because formal jobs are scarce, schedules are rigid, or local labor markets do not match their needs. Gender, age, migration status, and household responsibilities all change what self-employment means.
A lifecycle lens also helps explain why two self-employed people with the same annual revenue can have very different risk profiles. A younger worker may have lower fixed costs but less savings, fewer referrals, and a thinner portfolio. A mid-career professional may have stronger expertise and networks but higher family expenses. An older worker may value flexibility but also needs retirement security and health-cost planning. These trade-offs make self-employment a financial-planning issue as much as a work-style choice.
Demographic signals and interpretation
• India’s 64.2% female self-employment share in 2025 was much higher than the 52.0% male share.
• India’s female self-employment earnings average of ₹6,374 remained far below the male average of ₹17,914.
• High female self-employment in emerging markets can reflect entrepreneurship, but it can also reflect unpaid family work, household constraints, or limited wage-employment access.
• Older workers in developed economies may use self-employment as a bridge into retirement, but pension and savings adequacy become critical.
• Migrant workers in OECD economies often have higher self-employment rates in some sectors because self-employment can bypass credential barriers or formal hiring obstacles.
• Younger self-employed workers may use platforms, creator tools, and freelance marketplaces more heavily, but they may also have less savings and weaker client networks.
• Mid-career professionals often have stronger rates, networks, and specialization, which can make self-employment more financially viable.
• Caregiving responsibilities can make flexible independent work attractive, but flexibility only helps if the work produces sufficient and predictable income.
These differences matter because a single self-employment policy cannot serve every group equally. A high-skill consultant may need better tax planning and retirement tools. A low-income own-account worker may need access to finance, social protection, business registration, and safer payment channels. A caregiver may need flexible contracts and predictable payment timing. The stronger the data segmentation, the more useful the policy or business response becomes.
Platforms, AI, and the Future of Independent Work
Platforms and AI are changing parts of self-employment, but they are not replacing the older forms of independent work. Local shops, trades, household services, agriculture, informal vending, personal services, professional consulting, and solo businesses remain central. The new layer is that more self-employed people can find clients, sell products, automate administration, accept payments, and deliver services digitally.
Platform and technology signals
• The World Bank’s 154 million to 435 million online gig-worker estimate shows the scale of platform-mediated work.
• Online gig work can represent 4.4% to 12.5% of the global labor force depending on how active workers are defined.
• Platform work can expand market access, but platforms can also control visibility, pricing pressure, ratings, fees, and customer relationships.
• AI tools can help self-employed workers draft proposals, summarize meetings, create content, code, analyze data, manage invoices, and reduce administrative work.
• AI can also commoditize simple execution tasks, making domain expertise, client strategy, judgment, and implementation quality more important.
• The next wave of self-employment will likely split between low-margin task work and higher-value independent services that combine skill, trust, and business process knowledge.
• Digital payments, invoicing software, and tax tools matter because they turn informal client work into better records and easier financial management.
• Remote work expands client geography, but it also exposes self-employed workers to global price competition.
The AI story should be read carefully. It is not simply good or bad for self-employed workers. For specialists who use AI to improve output, speed, research, design, coding, administration, or analysis, it can increase leverage. For workers selling repeatable low-skill tasks, it can reduce pricing power. The long-term advantage will likely belong to self-employed people who combine tools with relationships, specialization, business judgement, and reliable delivery.
The strongest position for independent workers is usually not competing only on task speed. It is combining specialized knowledge, strong client communication, reliable delivery, and tools that reduce low-value admin. AI can make a proposal draft faster, but it cannot replace a trusted relationship with a client who needs judgment, confidentiality, industry context, and accountability. This is why self-employed workers should track not only the number of leads they receive, but also close rate, average project value, repeat-client share, and how much of their work is defensible against automation.
Platforms create a similar trade-off. They reduce the difficulty of finding clients, collecting payment, and building initial reputation, but they can also weaken direct customer ownership. A platform worker who gets all demand from one marketplace may be exposed to algorithm changes, fee adjustments, search ranking shifts, and account suspensions. A more resilient independent business usually combines platform visibility with direct relationships, referrals, owned records, and repeat-client systems.
Why Records, Payments, and Tax Planning Matter
Self-employment becomes more durable when the administrative layer is treated as part of the business rather than as paperwork after the fact. The recurring priorities in the existing chart–stable income, more clients, tax planning, payments, and records–are not separate tasks. They are connected. Better records make tax planning easier. Faster payment improves cash stability. Clear invoices reduce disputes. Accurate client history improves repeat sales and pricing decisions.
For small independent businesses, weak records can hide the difference between revenue and income. A worker may know how much money arrived in the bank account but not how much was absorbed by software, supplies, travel, insurance, platform fees, taxes, equipment, or unpaid time. That creates pricing mistakes. It can also make financing, tax filing, and long-term planning harder because the business cannot prove its real performance.
A practical self-employment system does not need to be complex at the beginning. It should answer a few important questions every month: which clients paid, which invoices are late, which services are most profitable, which expenses are growing, how much tax should be reserved, and how much work is already booked for the next cycle. Those answers turn self-employment from reactive income generation into a managed business model.
How Self-Employment Business Models Change the Economics
Self-employment is more useful to analyze when it is broken into business models. The financial risks of a local tradesperson, online freelancer, solo consultant, creator, platform driver, independent retailer, and small professional practice are not the same. Each model needs different metrics.
Business-model patterns
• Solo professional services: usually depends on hourly rates, retainers, referrals, client concentration, and expertise depth.
• Skilled trades and local services: depends on local demand, scheduling, materials, travel time, repeat customers, and payment reliability.
• Platform marketplace work: depends on ratings, platform fees, visibility, demand volatility, and algorithmic rules.
• Creator and product-led work: depends on audience, distribution, product margins, advertising, subscriptions, and platform risk.
• Retail and microenterprise: depends on inventory, location, payments, supplier costs, local purchasing power, and working capital.
• Consulting and advisory work: depends on specialization, trust, project scope, recurring clients, and the ability to price outcomes rather than only time.
• Agricultural and household enterprise work: often overlaps with family labor, seasonality, informality, and limited access to formal finance.
How independence turns into a durable business system
The difference between self-employment as a job substitute and self-employment as a business is usually visible in the operating system behind the work. A durable independent business has a clear offer, repeatable pricing, reliable records, predictable collection habits, and a plan for replacing lost demand. A fragile independent arrangement may depend on one platform, one client, one seasonal channel, or one person’s unpaid administrative capacity.
A self-employed person does not need to become a large company to build business discipline. Even a solo operator can separate personal and business accounts, issue consistent invoices, track unpaid balances, measure repeat-client share, reserve money for tax, and review which services produce the best effective hourly return. Those habits turn independent work from a series of disconnected jobs into a measurable commercial activity.
For businesses hiring self-employed talent, the same distinction matters. A company that treats independent workers as interchangeable short-term capacity may save money in the short run but lose continuity, quality control, and institutional knowledge. A company that builds a trusted contractor bench can use self-employed specialists strategically while still maintaining documentation, confidentiality, approval rules, and payment reliability.
This business-model lens prevents bad comparisons. A platform driver may need utilization, fuel cost, vehicle cost, and platform-fee metrics. A solo consultant needs proposal conversion, realization, retainer share, and client diversification. A small retailer needs inventory turnover, payment acceptance, margins, and cash flow. All are self-employed, but the operating math is different.
The model also changes what “growth” means. For a solo consultant, growth may mean higher retainers and fewer low-value projects. For a tradesperson, growth may mean better scheduling, faster deposits, and higher repeat-customer share. For a creator, growth may mean audience ownership and product diversification. For a platform worker, growth may mean reducing dependence on one marketplace. Self-employment is healthiest when the worker knows which version of growth fits the economics of the work.
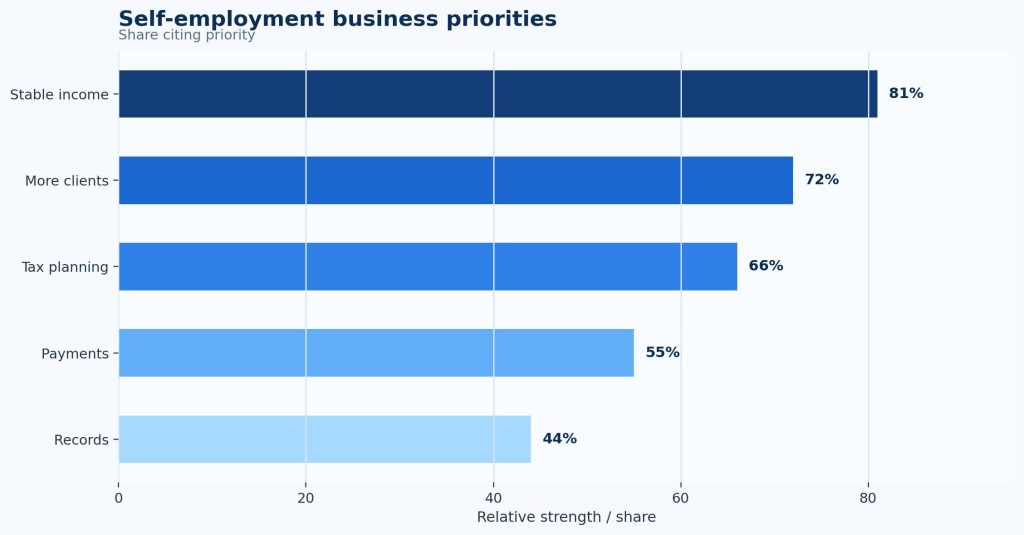
Figure 3. Self-employment business priorities shows why stable income, client growth, tax planning, payments, and records are practical management issues rather than secondary administration.
What Businesses and Self-Employed Workers Should Track
The best use of self-employment statistics is not only describing the labor market. It is improving decisions. Workers need metrics that show whether independence is creating sustainable income. Businesses need metrics that show whether independent contractors and solo providers are helping capacity without weakening quality, compliance, or continuity.
Metrics for self-employed workers
• Monthly net income after taxes, tools, insurance, materials, platform fees, subcontractors, and unpaid time.
• Client concentration, especially the percentage of revenue from the largest client.
• Repeat-revenue share from retainers, subscriptions, recurring buyers, or repeat contracts.
• Pipeline coverage, measured as booked work or expected revenue for the next 30, 60, and 90 days.
• Effective hourly income after administration, marketing, sales calls, revisions, travel, and collections.
• Invoice aging and late-payment exposure.
• Tax reserve as a percentage of income.
• Benefits replacement funding for health coverage, pension, paid leave, disability coverage, and emergency savings.
• Customer acquisition cost in time and money.
• Rate progression by service line, client type, region, and experience level.
Metrics for businesses using self-employed talent
• Contractor concentration by department, client, project, or workflow.
• Quality and rework rates by independent provider or project type.
• Continuity risk where one contractor holds critical knowledge.
• Classification and compliance risk by country or worker type.
• Cost comparison against employee teams after onboarding, management, rework, and handoff costs.
• Cycle time from hiring need to contracted work started.
• Retention of trusted independent providers over multiple projects.
• Data security, confidentiality, and access-control compliance for external workers.
• Payment speed, invoice clarity, and dispute rates with independent providers.
For both sides, the goal is to turn independence into a managed system. A self-employed worker who tracks only gross revenue may miss tax, benefits, and client-risk pressure. A company that tracks only contractor cost may miss quality, continuity, or compliance risk. The most useful dashboards connect income, reliability, risk, and repeatability.
The same principle also applies to businesses that work with self-employed professionals and contractors. While companies gain flexibility by hiring independent workers, that flexibility should not create unmanaged dependency. If a contractor controls important client knowledge, source files, technical systems, or customer relationships, the business should have proper documentation, secure access controls, clear handoff procedures, and well-defined project scopes in place. Using organized tools such as a google docs invoice template can further streamline contractor payments and communication, helping businesses maintain continuity while giving independent workers clearer expectations and faster, more reliable payments.
FAQ
What is self-employment?
Self-employment generally means working for oneself rather than as an employee. Depending on the source, it can include employers, own-account workers, independent contractors, freelancers, unpaid family workers, cooperative members, platform workers, and nonemployer business owners.
How many self-employed workers are there?
There is no single global count because countries define self-employment differently. ILO research indicates that almost seven in 10 workers worldwide are self-employed or work in small businesses, while the World Bank estimates 154 million to 435 million people work through online gig platforms.
What percentage of EU workers are self-employed?
Eurostat reports that self-employed people accounted for 14.2% of EU employment by persons in 2025 and 17.5% of hours worked.
How large is self-employment in India?
India’s PLFS reported a 56.2% self-employment share in 2025, including 52.0% for men and 64.2% for women.
Is self-employment the same as freelancing?
No. Freelancing is usually a narrower service-based form of independent work. Self-employment also includes own-account workers, small employers, local business owners, informal traders, independent contractors, and family enterprise workers.
What is the biggest risk for self-employed workers?
The biggest risk is usually not independence itself. It is unstable income without enough protection: too few clients, late payments, weak benefits, limited savings, tax surprises, platform dependence, or low pricing power.
How to Use These Self-Employment Statistics in Practice
The practical value of self-employment statistics is not only in counting independent workers. The better use is to diagnose what kind of independent work is being measured and what support system it needs. For a policymaker, that may mean separating high-income independent professionals from informal workers without social protection. For a business, it may mean deciding when an external specialist is a strategic capability rather than a cheap substitute for hiring. For a self-employed worker, it may mean measuring whether independence is creating real business equity or only replacing a wage with irregular project income.
A strong self-employment dashboard should therefore combine scale metrics with quality metrics. Headcount, business counts, and platform participation show the size of the category. Net income, repeat revenue, client concentration, invoice aging, benefits coverage, and tax reserves show whether the category is financially healthy. The second group is often more important for real-world decisions.
The same logic applies to country comparisons. A high self-employment share can indicate vibrant small-enterprise activity, but it can also reveal limited wage employment or persistent informality. A lower share can mean stronger formal employment, but it can also hide fast growth in side businesses, nonemployer firms, and platform-mediated supplemental work. The best interpretation always asks what kind of self-employment is growing, who benefits from it, and which financial safeguards are missing.
Final Takeaway
Self-employment statistics show a labor market that is both flexible and uneven. The category includes high-income independent professionals, small business owners, online platform workers, local service providers, informal earners, creators, and household enterprises. That diversity is why the best interpretation goes beyond headcount.
The strongest self-employment systems combine autonomy with economic durability. For workers, that means repeat clients, fair pricing, clear records, tax reserves, benefits planning, and income diversification. For businesses, it means using independent talent without creating hidden compliance, quality, or continuity problems. For policymakers, it means separating opportunity-driven entrepreneurship from necessity-driven informal work. The numbers matter most when they help readers understand which kind of self-employment is growing and whether that growth is improving income security.