Food acidulants are small formulation ingredients with a large commercial role across beverages, confectionery, dairy, bakery, sauces, processed foods, and ready meals. They control acidity, improve tartness, support preservation, stabilize pH, strengthen flavor delivery, and help manufacturers keep taste consistent when products move across factories, climates, and distribution channels.
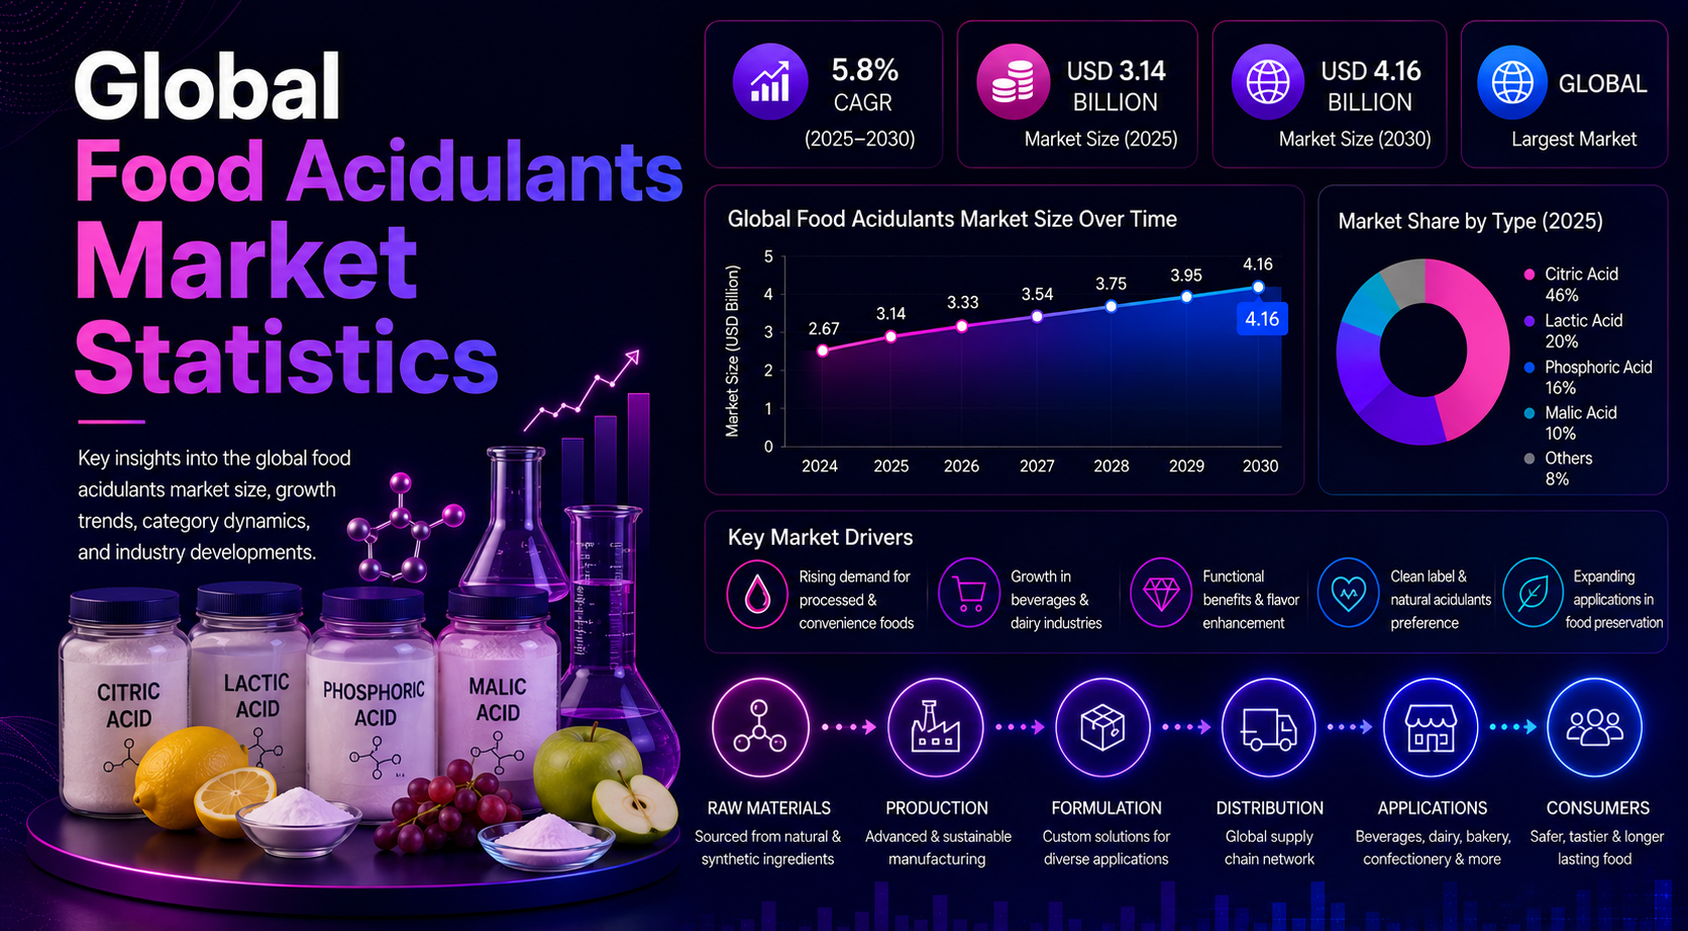
The strongest statistics show why the market deserves its own scorecard. Mordor Intelligence places the food acidulants market at USD 3.73 billion in 2026 and projects a 4.47% CAGR to 2031, while other market models put the category above USD 5.87 billion in 2025 or above USD 10.16 billion by 2034. Citric acid remains the broadest-use acidulant, Asia-Pacific is modeled to grow at 7.1% through 2032, and global citric acid trade reached USD 2.18 billion in 2024.
Food acidulants demand is shaped by market size, acid type, application category, regional consumption, country-level production, and sourcing exposure. The useful question is not only how large the market is, but which acidulants, applications, regions, and supply patterns are changing the economics of food formulation.
Executive Food Acidulants Benchmarks
These statistics show the scale of the market, the importance of citric acid, the role of beverages and processed foods, the growth of regional demand, and the sourcing exposure developed by citric acid trade.
The numbers that define the food acidulants market
• The headline numbers show a market that is moving steadily rather than explosively. Mordor Intelligence estimates food acidulants at USD 3.73 billion in 2026 and USD 4.64 billion by 2031, while Market Data Forecast uses a broader model of USD 5.87 billion in 2025 and USD 7.74 billion by 2033.
• Several forecasts point in the same direction even when their market boundaries differ. Future Market Insights places sales at USD 2,573.7 million in 2023 and USD 4,357.7 million in 2034, while Global Market Insights uses a higher 2023 base of USD 5.5 billion and a USD 10.16 billion outlook for 2032.
• The strongest regional growth signal comes from Asia-Pacific, where one model moves from USD 1.86 billion in 2024 to USD 3.22 billion by 2032 at a 7.1% CAGR. That growth reflects packaged foods, beverages, modern retail, and China’s ingredient supply role.
• North America remains a large mature demand base. Market Data Forecast values the regional market at USD 2.69 billion in 2024 and projects USD 4.51 billion by 2033, with demand linked to beverages, sauces, snacks, dairy, bakery, and convenience foods.
• Citric acid is the clearest volume signal in the category. IMARC estimates global citric acid volume at 3.03 million tons in 2025 and 3.78 million tons by 2034, showing how one acidulant can anchor beverage, confectionery, dairy, and processed food systems.
• Higher-growth ingredient niches also matter. Mordor forecasts lactic acid at a 7.78% CAGR from 2026 to 2031 and malic acid at a 9.18% CAGR over the same period, which points to demand from fermented foods, fruit flavors, sour confectionery, and functional beverages.
• Phosphoric acid remains more concentrated than citric acid, but it still matters because cola-style beverages and selected processed foods rely on strong acidity control. Custom Market Insights expects beverage phosphoric acid demand to maintain a 4.8% CAGR to 2034.
• Trade data makes the market more practical for buyers. OEC reports global citric acid trade of USD 2.18 billion in 2024, and China exported 1.24582 billion kg of citric acid that year, representing 46.8% of total export value in the OEC dataset.
• The market should be read through function as much as value. A small amount of acidulant can influence taste, pH, microbial stability, shelf life, processing behavior, and label positioning across millions of finished food and beverage units.
• The most useful benchmark view separates demand into acid type, application category, region, country, and supply-chain exposure. That approach avoids treating food acidulants as one blended ingredient market when the commercial logic differs sharply by use case.
Editorial readout
The headline statistics point to five market forces: beverage formulation, processed-food shelf life, acid-type selection, regional packaged-food growth, and citric acid sourcing exposure. A useful market view should separate demand by application, acid type, region, country, and supply-chain risk rather than treating food acidulants as one blended ingredient category.
Why Food Acidulants Matter in the Food System
Food acidulants sit between flavor chemistry and food safety. In a beverage, the same ingredient family can shape tartness, balance sweetness, lower pH, support microbial stability, and make a flavor profile feel more natural. In a sauce, dairy system, bakery product, or ready meal, acidity can influence preservation, texture, gelling, color stability, and shelf-life behavior.
This makes acidulants different from many other food additives. Their commercial value is not measured only by volume. It is measured by how well they help a product taste consistent, stay stable, travel through distribution, satisfy labeling expectations, and fit into a cost-controlled formulation.
Food system functions behind acidulant demand
• Acidulants are used for pH control, which affects flavor, preservation, microbial control, protein behavior, and product stability.
• Beverage manufacturers use acidulants to create tartness, support fruit profiles, balance sweeteners, and stabilize ready-to-drink formulations.
• Confectionery manufacturers use citric, malic, fumaric, and tartaric acid systems to deliver sourness and maintain flavor intensity.
• Bakery and leavening systems use acid components to manage reaction timing, texture, and finished-product consistency.
• Dairy and fermented foods rely on acidity control to support taste, texture, and microbial performance.
• Sauces, dressings, pickles, and condiments use acidity for flavor sharpness and shelf-stable preservation.
• Clean-label reformulation does not remove acidulants; it changes which acids, source narratives, and label names manufacturers prefer.
In practical terms, acidulants sit between ingredient chemistry and consumer behavior. A formulation team may use them to lower pH, but the shopper experiences that decision as brighter fruit flavor, cleaner sourness, stable color, better shelf life, or a beverage that tastes consistent from the first bottle to the last. That makes demand hard to understand through one market-size figure alone.
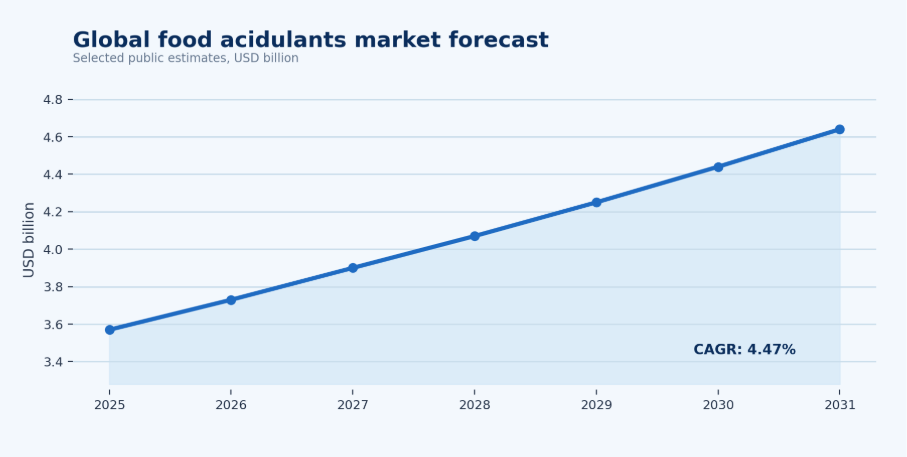
Figure 1. Food acidulants market growth should be reviewed together with processed food, beverage, and regional consumption trends because small formulation shifts can affect high-volume ingredient demand.
Global Market Size and Forecast
Market-size statistics for food acidulants vary because research firms define the boundary differently. Some estimates focus only on food-grade acidulants, while others include adjacent acid systems or broader ingredient uses. The useful interpretation is not to force every source into one number. The better approach is to compare direction, growth rate, and application logic.
Market-size and growth benchmarks
• Mordor’s narrower food acidulants model starts at USD 3.57 billion in 2025 and USD 3.73 billion in 2026, then reaches USD 4.64 billion by 2031. This is a moderate-growth view of the category.
• Market Data Forecast uses a larger market boundary, placing the market at USD 5.87 billion in 2025 and USD 6.08 billion in 2026 before reaching USD 7.74 billion by 2033.
• Future Market Insights shows a longer demand arc, moving from USD 2,573.7 million in 2023 to USD 4,357.7 million by 2034, with the forecast CAGR improving from the historical 4.9% pace to 5.4%.
• Global Market Insights gives the strongest upside case, forecasting a 6.3% CAGR from 2024 to 2032. Persistence Market Research sits closer to the middle with a 5.3% CAGR from 2026 to 2033.
• The range between forecasts is useful rather than confusing. It shows that broader definitions, beverage inclusion, industrial overlap, and regional modeling can shift the headline market size even when the direction remains positive.
• For strategy, the better question is not which single forecast is perfect. The better question is whether beverage launches, packaged food growth, clean-label reformulation, and trade flows are increasing the need for acidulant functionality.
| Market signal | Primary metric | Likely owner |
|---|---|---|
| Market size | Base-year value, forecast value, and CAGR by model | Strategy, finance, category teams |
| Acid type mix | Citric, lactic, malic, phosphoric, acetic, and fumaric use | R&D, formulation, procurement |
| Application demand | Beverage, confectionery, bakery, dairy, sauce, and ready-meal use | Product, category, sales |
| Regional exposure | North America maturity, Europe regulation, Asia-Pacific growth | Commercial, regional leadership |
| Supply concentration | Citric acid export share, import dependence, supplier geography | Procurement, risk, operations |
How to use the market-size data
The market-size benchmark is a warning light, not the whole diagnosis. A practical dashboard separates total value from acid type, application, country demand, and sourcing exposure. That keeps teams from responding to a global CAGR with generic growth assumptions when the real opportunity may sit in beverages, clean-label reformulation, Asia-Pacific growth, or citric acid trade concentration.
Citric, Phosphoric, Lactic, Malic, Acetic, and Fumaric Acid Statistics
Acidulant demand should be read by ingredient type because each acid plays a different formulation role. Citric acid is the broad-use workhorse, phosphoric acid is closely tied to carbonated beverage systems, lactic acid links food with fermentation and clean-label positioning, while malic, fumaric, acetic, and tartaric acids are more application-specific.
Citric acid statistics
• Citric acid is the broadest-use acidulant in the market. IMARC estimates volume at 3.03 million tons in 2025 and 3.78 million tons by 2034, which reflects its use in beverages, confectionery, fruit preparations, jams, dairy systems, and processed foods.
• The value side tells the same story. Market Research Future estimates the citric acid market at USD 3.98 billion in 2025 and forecasts USD 6.18 billion by 2035 at a 4.51% CAGR from 2026 to 2035.
• Citric acid also has a strong manufacturing signal. IMARC reports the citric acid production market grew at a 7.8% CAGR from 2019 to 2024, supported by fermentation scale and recurring food, beverage, pharma, and industrial demand.
• For food companies, citric acid matters because it is familiar, functional, and versatile. It can deliver tartness, support pH control, help preserve product quality, and fit many consumer-facing ingredient labels.
Lactic acid statistics
• Lactic acid is a faster-growing acidulant signal because it connects food, fermentation, preservation, and adjacent industrial demand. A 7.78% CAGR model places the market at USD 3.63 billion in 2025 and USD 5.69 billion by 2031.
• Other trackers show a similar direction even with different boundaries. Spherical Insights forecasts a 7.67% CAGR from 2025 to 2035, while Marcantel estimates an 11.49% CAGR from 2025 to 2030 because bioplastics and industrial uses expand the demand pool.
• In food applications, lactic acid is important for dairy, fermented foods, bakery, meat preservation, plant-based products, and clean-label acidity systems.
• The commercial reading is that lactic acid is not only an acidulant. It also carries a fermentation narrative that can help product teams balance functionality, label preference, and taste.
Malic acid statistics
• Malic acid is smaller than citric acid but highly relevant where fruit-forward tartness matters. Mordor forecasts malic acid growth at 9.18% CAGR from 2026 to 2031.
• Other market views are more moderate, with Grand View Research forecasting a 5.2% CAGR from 2025 to 2030 and Fact.MR projecting a 5.5% CAGR from 2025 to 2035.
• The human signal behind those forecasts is simple: sour candies, gummies, powdered drinks, fruit beverages, and nutraceutical formats often need acidity that feels sharper and longer-lasting than ordinary sweetness balancing.
Phosphoric, acetic, fumaric, and related acidulants
• Phosphoric acid remains closely tied to cola-style carbonated beverages and selected processed foods. Custom Market Insights expects beverage phosphoric acid demand to maintain a 4.8% CAGR to 2034.
• Acetic acid and vinegar-derived systems are more practical in sauces, pickles, dressings, marinades, condiments, and shelf-stable acidic foods, where flavor sharpness and preservation need to work together.
• Fumaric acid is useful when manufacturers need strong acidity, low solubility, and good performance in bakery, dry mixes, tortillas, confectionery, and powdered beverage systems.
• Tartaric acid and citrus-derived systems matter in fruit preparations, beverages, confectionery, wine-linked applications, and natural-positioned flavor systems. These acids are more specialized, but they help formulators fine-tune texture, taste, and label expectations.
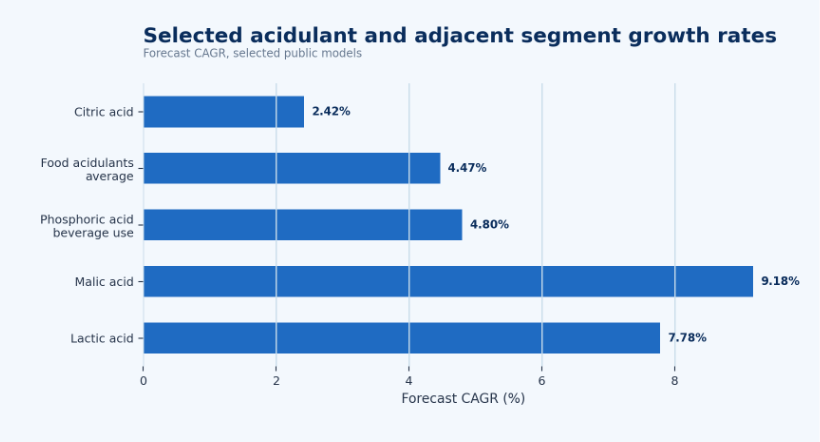
Figure 2. Selected acidulant growth rates show faster expansion in malic and lactic acid while the overall food acidulants market maintains steady growth.
Acid type interpretation
The strongest acidulant insight is functional fit. Citric acid carries broad beverage and processed-food demand, lactic acid connects to fermentation and clean-label systems, malic acid supports sharper fruit profiles, phosphoric acid remains tied to cola-style beverages, and acetic or fumaric systems solve more specific preservation, bakery, and texture problems.
Food Acidulants by Application
Application data explains the market better than market value alone. A beverage brand buying acidulants has different priorities from a bakery manufacturer, dairy processor, sauce producer, confectionery brand, or ready-meal company. The main question is not only which acid is growing. The stronger question is which product category needs acidity, flavour balance, preservation, texture control, or processing stability.
Application benchmarks worth separating
• Beverages are the clearest demand center because acidulants influence tartness, sweetness balance, microbial stability, flavour brightness, and pH control. A small formulation change can repeat across millions of bottles, cans, sachets, or ready-to-drink servings.
• Carbonated soft drinks use acidulants for sharpness and pH control, with phosphoric acid especially associated with cola-style products. Fruit drinks, sports drinks, energy drinks, and RTD teas more often rely on citric and malic acid systems.
• Confectionery demand is shaped by sour gummies, hard candies, fruit chews, powdered candies, and sugar-acid coating systems. In this category, the statistic that matters most is not only market size; it is how frequently sour flavor formats rotate through new launches.
• Bakery demand is more technical. Acidulants help manage leavening systems, tortillas, dry mixes, cakes, dough behavior, and shelf-life extension, so performance often matters more than a visible ingredient claim.
• Dairy and fermented foods use acidity to manage flavor, texture, protein behavior, and culture performance. This makes acidulants important in both traditional dairy and plant-based alternatives.
• Sauces, dressings, condiments, pickles, and marinades depend on acidulants for flavor sharpness and shelf-stable preservation. Ready meals and processed foods use them to keep flavor and safety consistent after heating, packaging, and distribution.
• Nutraceutical gummies, powders, and effervescent products add another demand layer because acidulants can deliver both taste and functional performance in formats where flavor masking is difficult.
| Formulation decision | What to compare | Why it matters |
|---|---|---|
| Use citric acid | Beverage volume, pH target, flavor profile, sourcing exposure | It is the broadest-use acidulant but is highly visible in trade data. |
| Use lactic acid | Fermentation positioning, dairy use, plant-based systems, label fit | It can support clean-label and fermented-food narratives. |
| Use malic acid | Fruit profile, sourness intensity, confectionery performance | It can improve sharpness in fruit beverages and sour candy. |
| Use phosphoric acid | Cola flavor, acidity control, consumer perception, regulation | It remains useful in carbonated beverages but needs careful positioning. |
| Blend acids | Taste, shelf life, cost, supply, and processing behavior | Blends often solve flavor and preservation issues better than one acid alone. |
Application rule
Application demand should not be managed as a checklist of food categories. The better question is which acidulant improves profitable product performance in a specific beverage, confectionery, dairy, bakery, sauce, or ready-meal system while meeting label, cost, shelf-life, and sourcing requirements.
Regional Food Acidulants Market Intelligence
Regional data is one of the highest-value parts of food acidulants analysis. Global averages can hide large differences in processed food consumption, beverage habits, additive regulation, feedstock costs, import dependence, and formulation preferences. The market should be measured by region because acidulant demand rarely moves in one uniform global pattern.
North America
• North America is a mature but valuable market. It was valued at USD 2.69 billion in 2024, and MarketDataForecast projects it will move from USD 2.85 billion in 2025 to USD 4.51 billion by 2033 at a 5.91% CAGR.
• The United States drives much of the demand because beverages, sauces, snacks, bakery, dairy, and processed foods all use acidulants for taste, preservation, and pH control.
• Canada appears not only as a consumption market but also as a supply signal, with IndexBox listing Canadian citric acid export volume at about 121 thousand tons in 2024.
• Mexico matters in two ways: it is a large soft drink and packaged food market, and it received 75,285,200 kg of citric acid from China in 2024. That makes it a useful bridge between regional demand and global sourcing.
Europe
• Europe should be read through regulation, clean-label expectations, bakery traditions, dairy processing, confectionery, and beverage innovation. The region does not behave like one uniform formulation market.
• Germany functions as a food processing and ingredient distribution hub, with relevance across bakery, beverages, sauces, confectionery, and dairy.
• Belgium shows how intra-European distribution supports the ingredient market. It exported USD 110.67 million of citric acid in 2024, including USD 23,570.21 thousand to Germany, USD 8,558.43 thousand to France, and USD 4,060.78 thousand to the United Kingdom.
• The practical takeaway is that European acidulant demand depends on country-level product habits as much as regional averages. Bakery, dairy, beverage, and additive-labeling expectations can change the preferred acid system from one market to another.
Asia-Pacific
• Asia-Pacific is the strongest growth story in the article. Global Market Insights projects the regional market to rise from USD 1.86 billion in 2024 to USD 3.22 billion by 2032 at a 7.1% CAGR.
• China is central because it is both a food and beverage market and a global supply base. It exported 1.24582 billion kg of citric acid in 2024, making Chinese output a direct sourcing issue for international buyers.
• India and Japan show the region’s demand depth. China shipped USD 83,560.68 thousand of citric acid to India in 2024, equal to 131,719,000 kg, and USD 39,607.87 thousand to Japan, equal to 48,943,500 kg.
• India, Indonesia, Vietnam, Thailand, and the Philippines add future demand through packaged foods, beverages, dairy, sauces, snacks, and modern retail growth. This is why Asia-Pacific should be treated as both a consumption and supply-chain region.
Latin America
• Latin America demand is tied to carbonated drinks, juices, sauces, confectionery, bakery, dairy, and processed foods. Brazil and Mexico are the largest practical demand centers for most ingredient suppliers.
• Mexico is the clearest trade signal. China exported USD 52,730.59 thousand of citric acid to Mexico in 2024, equal to 75,285,200 kg, showing how beverage and packaged food demand connects to imported acidulants.
• Smaller countries still matter for distribution planning. China shipped salts and esters of citric acid worth USD 2,274.75 thousand to Colombia, USD 2,146.14 thousand to Chile, and USD 1,874.82 thousand to Argentina in 2024.
• The regional reading is that Latin America should not be reduced to one number. Soft drinks, sauces, confectionery, local cards of trade, and import channels vary by country.
Middle East and Africa
• Middle East and Africa demand starts from a smaller base but is supported by packaged food, beverages, sauces, dairy, and import-led ingredient supply.
• The Gulf is a practical import market. China shipped salts and esters of citric acid worth USD 2,164.92 thousand to the United Arab Emirates and USD 951.41 thousand to Saudi Arabia in 2024.
• African trade signals are also visible. China shipped USD 1,646.12 thousand of salts and esters of citric acid to Nigeria, USD 1,594.01 thousand to Egypt, and USD 1,215.04 thousand to Ghana in 2024.
• Hot-climate beverage consumption, urban retail expansion, and processed food imports make regional distribution and local manufacturing capacity important for long-term acidulant planning.
| Region | Food acidulants market implication |
|---|---|
| North America | Mature processed-food and beverage demand, with clean-label pressure and steady need for reliable imported and domestic ingredients. |
| Europe | Regulation, bakery traditions, dairy systems, and clean-label reformulation shape acidulant choice by country. |
| Asia-Pacific | Production scale, beverage growth, packaged-food expansion, and China-linked citric acid supply make the region central. |
| Latin America | Soft drinks, sauces, confectionery, bakery, and processed foods support acidulant demand, especially in Brazil and Mexico. |
| Middle East and Africa | Packaged food, hot-climate beverage demand, urban retail, and import exposure support long-term growth from a smaller base. |
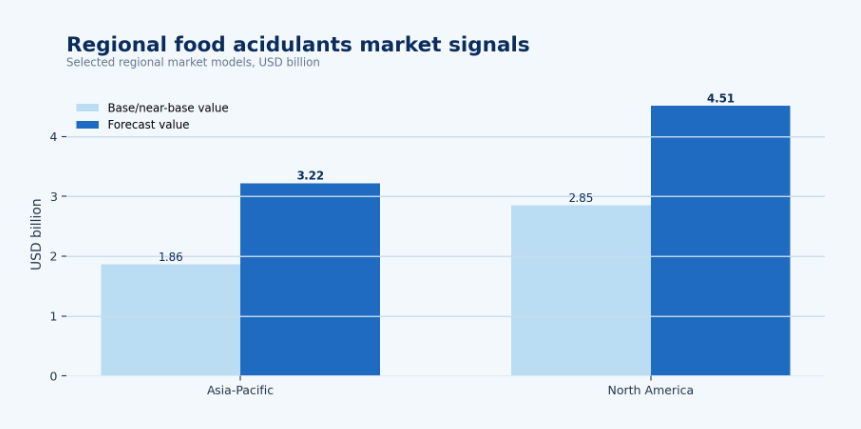
Figure 3. Regional food acidulants market signals compare selected base and forecast values for Asia-Pacific and North America, highlighting different growth and scale profiles.
Country-Level Food Acidulants Statistics
Country-level statistics keep the market view from becoming too general. Food acidulants are global ingredients, but their demand is developed locally by beverage brands, confectionery makers, dairy processors, bakeries, sauces, condiments, and ready-meal manufacturers. Trade data also shows which countries influence supply and pricing.
Major producing, trading, and consumption countries
• China is the largest supply signal in the dataset. It exported USD 847.94 million of citric acid in 2024 and 1.24582 billion kg in volume, while OEC places its export share at 46.8% of global citric acid value.
• Index Box shows the same concentration from another angle, placing China near 71% of global citric acid export volume in 2024. For ingredient buyers, this means citric acid is not only a formulation input but also a sourcing-risk category.
• Canada, Thailand, Germany, Belgium, and the Netherlands form the next layer of supply. Canada exported about 121 thousand tons in 2024, Thailand represented 4.8% of global export volume, Germany exported about 75 thousand tons, Belgium about 56 thousand tons, and the Netherlands about 45 thousand tons.
• India is a major demand signal because it received 131,719,000 kg of citric acid from China in 2024. That volume reflects packaged food, beverage, dairy, sauces, and modern retail expansion.
• Japan is a mature demand market, receiving 48,943,500 kg of citric acid from China in 2024. Its role is less about explosive growth and more about high-spec food, beverage, confectionery, and processed food usage.
• Russia and Mexico show how trade demand extends beyond the largest developed food markets. Russia imported USD 48,539.40 thousand of citric acid from China in 2024, while Mexico received 75,285,200 kg.
• Pakistan offers a smaller but clear example of import dependence, with USD 28.47 million of citric acid imports in 2023, including USD 28,051.97 thousand from China.
| Country signal | What it may reveal |
|---|---|
| China dominates citric acid exports | Global buyers should track supply concentration, pricing, freight, and supplier diversification. |
| United States remains a large food market | Demand is tied to beverages, sauces, bakery, dairy, snacks, and imported acidulant supply. |
| India imports large citric acid volumes | Packaged-food and beverage expansion can convert trade flows into application demand. |
| Germany and Belgium act as European hubs | Regional distribution and food-processing networks matter as much as end-market consumption. |
| Mexico and Brazil anchor Latin America | Soft drinks, confectionery, sauces, and processed foods create category-level acidulant demand. |
Citric Acid Trade and Supply Chain Statistics
Citric acid trade is the clearest supply-chain window in the dataset. Food acidulants are often discussed as formulation ingredients, but procurement teams also need to understand production concentration, import exposure, feedstock costs, and distribution routes. This is especially important when a small ingredient affects thousands of finished SKUs.
Trade and sourcing benchmarks
• OEC reports global citric acid trade of USD 2.18 billion in 2024, down from USD 2.41 billion in 2023. The 9.45% value decline shows that ingredient trade can move differently from long-term food demand when prices, freight, and sourcing conditions change.
• China remains the key export anchor. It shipped USD 847.94 million of citric acid in 2024 and 1.24582 billion kg by volume, making Chinese fermentation capacity a central part of global food acidulant supply.
• India, Mexico, Russia, and Japan are major destination signals for Chinese citric acid. In 2024, China shipped USD 83.56 million to India, USD 52.73 million to Mexico, USD 48.54 million to Russia, and USD 39.61 million to Japan.
• Belgium shows the distribution-hub side of the market, exporting USD 110.67 million of citric acid in 2024 to destinations including Germany, the Netherlands, France, the United States, and the United Kingdom.
• Canada, Thailand, Germany, Belgium, and the Netherlands appear as secondary export signals beside China. They do not remove China’s importance, but they give buyers alternative lanes to monitor.
• The supply-chain point is straightforward: citric acid availability depends on fermentation capacity, sugar and starch economics, food-grade quality requirements, and international logistics. Procurement teams should track these factors beside market demand.
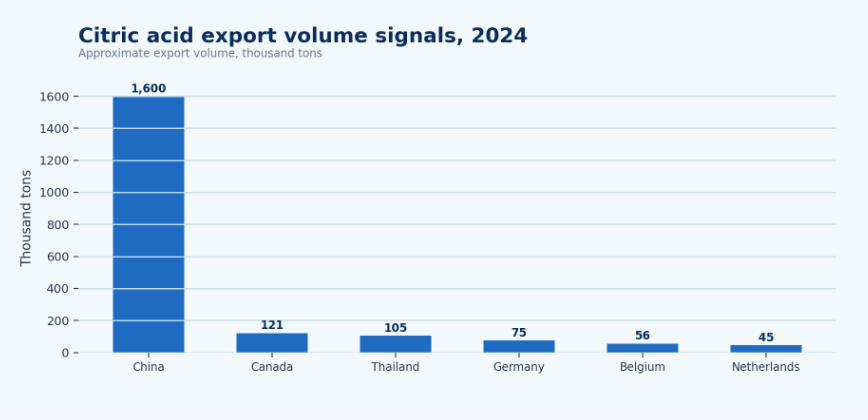
Figure 4. Citric acid export volume signals show China’s dominant supply position relative to other major exporting countries, reinforcing the importance of sourcing concentration.
Supply-chain interpretation
Food acidulants are usually discussed as formulation ingredients, but trade data shows that sourcing risk matters. Citric acid supply is especially tied to fermentation capacity, export flows, and feedstock economics. For food manufacturers, acidulant planning should include functionality, labeling, supply continuity, import exposure, and price volatility.
Clean Label and Reformulation Trends
Clean-label pressure is not the same as acidulant reduction. Consumers may prefer shorter ingredient lists and familiar names, but manufacturers still need pH control, flavoUr balance, shelf-life protection, and food safety. The reformulation opportunity is strongest when acidulants support function while fitting the product story.
Reformulation benchmarks and signals
• Citric acid often benefits from familiarity because consumers recognize it from citrus fruits and common food labels.
• Lactic acid benefits from fermentation associations and is relevant to dairy, fermented foods, bakery, and plant-based formulations.
• Vinegar and acetic acid systems can support clean-label positioning in sauces, dressings, marinades, and pickled products.
• Malic acid can support fruit-forward flavor systems where manufacturers want a stronger apple-like tartness.
• Phosphoric acid remains functional in carbonated beverage systems but may face more consumer-perception questions than citric or lactic acid in certain categories.
• Clean-label reformulation increases the need to evaluate acid source, label name, dosage, sensory balance, and shelf-life performance together.
• Regulatory expectations differ by market, so Europe, North America, Asia-Pacific, Latin America, and the Middle East should not be treated as one label environment.
Manufacturing and Feedstock Statistics
Manufacturing context explains why acidulant prices and availability can move even when food demand looks stable. Citric and lactic acids are heavily tied to fermentation economics, while feedstock availability, energy, logistics, food-grade quality standards, and capacity utilization shape delivered costs.
Feedstock and manufacturing context
• Citric acid and lactic acid production are closely tied to fermentation capacity and carbohydrate feedstocks such as sugar, starch, corn, molasses, or other fermentable substrates.
• Food-grade acidulants require stricter quality, documentation, and compliance than many industrial uses, which affects supplier qualification and procurement planning.
• Large-scale citric acid production benefits from fermentation efficiency and plant scale, which helps explain why supply concentration matters.
• Energy, freight, container availability, and port performance can affect delivered cost even when ingredient demand is steady.
• The same acid may be used in food, beverage, pharma, industrial, and bioplastic applications, so adjacent sector demand can influence availability.
• Ingredient buyers should compare acidulant cost trends with sugar, corn, starch, and logistics trends rather than treating acid price as isolated.
What Is Driving Food Acidulants Demand?
Demand growth is easiest to understand through category behavior. The same food acidulant market can be pulled by beverage launches, sour confectionery, shelf-stable sauces, clean-label dairy, convenience meals, and growing packaged food consumption in emerging markets.
Demand signals worth tracking
• Packaged food growth supports acidulants because shelf-life, flavor stability, pH control, and processing consistency become more important as distribution expands.
• Ready-to-drink beverages support citric, malic, phosphoric, and lactic acid systems because acidity affects taste, preservation, and sweetness balance.
• Energy drinks, sports drinks, fruit beverages, and functional beverages can increase acidulant complexity because flavor masking and stability matter.
• Sour confectionery, gummies, and powdered candies support citric, malic, fumaric, and tartaric acid demand.
• Bakery and tortilla systems use acidulants for leavening control, shelf life, and texture management.
• Dairy and plant-based foods use acidity to manage flavor, texture, preservation, and protein behavior.
• Sauces, dressings, condiments, and pickled foods require acidulants to support sharpness and microbial stability.
• Urbanization and modern retail expansion in Asia-Pacific, Latin America, and the Middle East increase demand for stable packaged foods and beverages.
• Clean-label pressure creates demand for acidulants that can maintain performance while fitting a more familiar ingredient narrative.
Food Acidulants Market Risks and Constraints
Growth is not automatic. Food acidulants have broad utility, but the market is exposed to feedstock costs, supply concentration, ingredient-label perception, regulatory differences, quality standards, and changing consumer attitudes toward highly acidic foods and drinks.
Risks worth separating
• Raw material volatility can affect fermentation-derived acidulants when sugar, corn, starch, molasses, or energy costs change.
• Supply concentration creates procurement risk when a large share of citric acid exports is connected to one country or a narrow set of producers.
• Import dependence matters for countries that do not have enough local food-grade acidulant capacity.
• Regulatory requirements can change additive labeling, maximum use levels, purity standards, and allowed applications.
• Consumer perception can differ across acidulants, with citric and lactic acid often read differently from phosphoric acid in some product categories.
• Over-acidification can create taste problems, enamel perception concerns, or formulation imbalance in beverages and confectionery.
• Food manufacturers must balance flavor, pH, preservation, label expectations, cost, and supply reliability rather than optimizing only one variable.
The risk picture is not negative for the market; it simply shows where management discipline is needed. Strong demand can still be weakened by raw material volatility, sourcing concentration, regulatory changes, clean-label pressure, taste limits, or inconsistent food-grade quality. A mature buyer will therefore track both demand growth and the operational risks that can affect delivered cost and formulation performance.
The practical opportunity is to treat acidulants as performance ingredients, not commodity additives. Suppliers that provide technical support, regional documentation, sensory guidance, and reliable food-grade supply can capture value even when buyers are controlling costs. Food brands that manage acidulants carefully can improve taste, stability, shelf life, and label acceptance without relying only on preservatives or heavy sweetness.
| Risk signal | What it may reveal |
|---|---|
| Feedstock costs rise | Fermentation-derived acidulants may face pricing pressure from sugar, starch, corn, molasses, energy, and logistics. |
| Supply is concentrated | Procurement risk increases when a large share of citric acid exports comes from a limited supplier base. |
| Regulation changes | Additive approvals, purity rules, labeling, or use limits may alter formulation choices by country. |
| Consumer perception shifts | Citric, lactic, acetic, malic, and phosphoric acid can be read differently by shoppers and brands. |
| Taste balance fails | Over-acidification can damage flavor, texture, and repeat purchase even when technical targets are met. |
Food Acidulants Market Diagnostic
The most useful structure is a diagnostic model that connects statistics to action. That keeps the market view focused on practical questions instead of becoming a long list of numbers.
| Problem area | Core signals to measure | Useful benchmark |
|---|---|---|
| Market growth | Market value, CAGR, application demand | Mordor projects USD 3.73 billion in 2026 and USD 4.64 billion by 2031. |
| Acid type mix | Citric, lactic, malic, phosphoric, acetic, and fumaric use | Citric acid volume is modeled at 3.03 million tons in 2025 and 3.78 million tons by 2034. |
| Applications | Beverages, confectionery, bakery, dairy, sauces, ready meals | Beverages and processed foods remain the clearest high-volume demand centers. |
| Regional exposure | Asia-Pacific growth, North America maturity, Europe regulation | Asia-Pacific is modeled at 7.1% CAGR from 2024 to 2032. |
| Supply chain | Export share, import dependence, feedstock cost, supplier geography | China exported 1.24582 billion kg of citric acid in 2024. |
| Reformulation | Clean label, acid source, dosage, pH target, shelf life | Acidulants must balance label expectations, flavor, preservation, and cost. |
This model connects each metric to a business question. Is the market growing because beverages are expanding? Is demand tied to citric acid or a more specialized acid? Is growth concentrated in Asia-Pacific, North America, or a specific country? Is procurement risk coming from trade concentration? Those questions make the statistics usable for product, procurement, and strategy teams.
90-Day Food Acidulants Market Review Plan
Statistics become useful when they are translated into a measurement plan. A practical food acidulants review can follow a 90-day cycle rather than a broad market-research exercise.
| Timing | What to do | Output |
|---|---|---|
| Days 1-30 | Capture the baseline by acid type, application, region, country, trade flow, and forecast model. | A clear map of where demand, supply, and pricing exposure sit. |
| Days 31-60 | Compare high-confidence opportunities such as beverages, clean-label systems, citric acid imports, and Asia-Pacific demand. | A short list of commercial and sourcing priorities. |
| Days 61-90 | Review feedstock, regulation, trade, and formulation risks so growth assumptions do not ignore cost or supply pressure. | A repeatable scorecard for profitable ingredient planning. |
Planning principle
The best food acidulants teams do not chase every benchmark. They compare external statistics against their own product mix, supplier base, regional sales, formulation needs, and risk tolerance, then prioritize the signals with high volume, clear ownership, and measurable financial impact.
Metrics Food Ingredient Leaders Should Track
The final scorecard should be detailed enough to locate the market signal without becoming a vanity dashboard. These metrics are the minimum useful set for a mature food acidulants review.
| Metric | Why it matters |
|---|---|
| Global food acidulants market value | the total demand opportunity and the size of the addressable ingredient category. |
| CAGR by source | expected growth pace and helps compare forecast models. |
| Acid type share and growth | whether demand is concentrated in citric acid or shifting toward lactic, malic, phosphoric, or other acids. |
| Application demand | where ingredient volume is consumed across beverages, confectionery, bakery, dairy, sauces, and processed foods. |
| Regional growth rate | here future demand is strongest and where local strategy should differ. |
| Country import/export volume | sourcing exposure, supplier concentration, and trade-flow dependence. |
| Citric acid trade value | Tracks the most visible and globally traded acidulant signal. |
| Feedstock cost | Helps explain pricing pressure for fermentation-derived acidulants. |
Global Food Acidulants Market Statistics FAQ
Common questions
• What are food acidulants?
Food acidulants are ingredients used to control acidity, improve flavor, adjust pH, support preservation, and improve shelf-life stability in foods and beverages.
• How big is the global food acidulants market?
Mordor Intelligence estimates the market at USD 3.73 billion in 2026 and USD 4.64 billion by 2031, while Marketdata Forecastst places the market at USD 5.87 billion in 2025 and USD 7.74 billion by 2033.
• Which food acidulant is most widely used?
Citric acid is generally the broadest-use acidulant because it is used across beverages, confectionery, dairy, sauces, fruit preparations, and processed foods.
• How large is the citric acid market?
IMARC estimates global citric acid volume at 3.03 million tons in 2025 and 3.78 million tons by 2034, while Market Research Future estimates value at USD 3.98 billion in 2025 and USD 6.18 billion by 2035.
• Which application uses the most food acidulants?
Beverages are one of the most important application areas because acidulants control tartness, flavor balance, pH, sweetness perception, and stability.
• Which region is growing fastest?
Asia-Pacific is one of the strongest growth regions in the dataset, with food acidulants projected to grow at a 7.1% CAGR from 2024 to 2032.
• Why is China important in food acidulants?
China is important because it is a major citric acid supplier. The dataset shows China exported 1.24582 billion kg of citric acid in 2024 and represented 46.8% of total citric acid exports in OEC data.
• How do clean-label trends affect acidulants?
Clean-label demand increases pressure to use familiar, functional, and label-friendly acidulants while still maintaining flavor, pH control, preservation, and shelf-life performance.
• What should companies track in this market?
Companies should track market value, CAGR, acid type demand, application demand, regional growth, country-level trade, feedstock costs, supplier concentration, and regulatory changes.
They should also compare statistics by application, because the same acidulant can play different roles in beverages, confectionery, bakery, dairy, sauces, and ready meals. A market number becomes more useful when it is connected to volume, formulation function, sourcing risk, and the customer category that creates the demand.
Final Takeaway
Food acidulants are small-volume ingredients with high formulation importance across beverages, packaged foods, dairy, confectionery, bakery, sauces, condiments, and ready meals. The statistics show a market supported by steady global growth, strong Asia-Pacific expansion, rising clean-label reformulation, and continued dependence on citric acid as a broad-use ingredient.
The most useful market analysis separates demand by acid type, application, region, country, and supply-chain exposure. If beverage innovation is growing, the acidulant question is about taste, pH, sweetness balance, and stability. If clean-label reformulation is driving product work, the question becomes which acids can preserve function while fitting the label. If procurement teams are planning supply, the key issue is trade concentration, feedstock cost, and supplier reliability.
For ingredient suppliers, food manufacturers, and beverage brands, the practical priority is a food acidulants scorecard that is commercial, technical, and regional at the same time. That means tracking market value, citric acid volume, lactic and malic acid growth, regional CAGRs, country-level trade flows, clean-label expectations, and feedstock economics together. The companies that connect those signals will understand not only how large the market is, but where demand is moving and where sourcing risk can appear.