In today’s rapidly evolving business landscape, decisions made based on intuition alone are no longer sufficient. Businesses must rely on data to drive their decision-making process. This is where Business Intelligence (BI) comes into play—helping organizations leverage data to gain meaningful insights that can influence strategic decisions, improve operational efficiency, and ultimately lead to growth and success. In this article, we’ll explore the concept of business intelligence, why it is essential for modern businesses, and how it can transform your decision-making process.
Understanding Business Intelligence
Business intelligence is a set of processes, technologies, and tools that help organizations collect, analyze, and present business data. The goal of BI is to enable businesses to make informed, data-driven decisions by providing them with a clear and comprehensive view of their operations, market trends, and performance metrics. BI is not just about gathering data—it’s about transforming that data into actionable insights that can guide strategic decisions.
BI systems pull data from various sources, such as sales transactions, customer feedback, market trends, and social media activity, and present it in an organized and digestible format. This data is then analyzed to uncover trends, patterns, and correlations that would otherwise be difficult to identify. Armed with these insights, businesses can make better decisions that are backed by facts, rather than relying on gut feelings or assumptions.
The Core Components of Business Intelligence
At its core, business intelligence is a multifaceted process that involves several key components:
1. Data Collection and Integration
The first step in BI is gathering data from various sources. Businesses collect data from internal systems, such as customer relationship management (CRM) tools, enterprise resource planning (ERP) systems, and accounting software. External data sources, such as social media platforms, market reports, and public databases, are also used to enhance the analysis.
Once the data is collected, BI tools integrate it into a central repository or data warehouse. This integration is critical because it allows businesses to analyze all relevant data in one place, ensuring a comprehensive view of the business landscape.
2. Data Analysis
After data collection, the next step is analysis. BI tools use various techniques to analyze the data, such as statistical analysis, data mining, and machine learning algorithms. These techniques help uncover hidden patterns, correlations, and trends within the data. The goal of this analysis is to identify key insights that can help businesses make more informed decisions.
For example, a retail company may use BI to analyze customer purchase patterns. By doing so, they may identify that a certain product is more popular among customers in a specific geographic region or that sales tend to spike during particular times of the year. This information can guide decisions related to inventory management, marketing strategies, and product development.
3. Data Visualization
One of the most powerful features of BI is its ability to present complex data in an easily understandable format. Data visualization is the process of creating graphical representations of data, such as charts, graphs, and dashboards. These visualizations allow users to quickly grasp key trends and insights, making it easier to interpret and act on the data.
A good BI system will provide interactive dashboards that allow users to drill down into specific data points for deeper insights. For instance, a marketing team may use a dashboard to visualize the performance of various campaigns, showing metrics such as engagement rates, conversions, and ROI. By making data more accessible, BI tools empower decision-makers to act swiftly and confidently.
4. Reporting
Another important aspect of BI is reporting. BI tools can generate detailed reports that summarize key findings and insights. These reports can be customized to meet the specific needs of different stakeholders within the organization. For instance, a finance team may need a report on quarterly revenue performance, while a sales team may require a report on customer acquisition rates.
Interactive reporting features allow users to share real-time insights with other departments, fostering collaboration and alignment across teams. This ensures that everyone in the organization has access to the same information, enabling more coordinated and informed decision-making.
5. Predictive Analytics
One of the most exciting advancements in BI is the incorporation of predictive analytics. Predictive analytics uses historical data and statistical algorithms to forecast future trends and outcomes. This allows businesses to anticipate market changes, customer behavior, and even potential risks before they happen.
For example, a manufacturing company may use predictive analytics to forecast demand for a particular product, helping them adjust production schedules accordingly. A financial services company may use predictive analytics to identify potential credit risks, enabling it to take proactive measures to mitigate losses.
The Role of Business Intelligence in Decision-Making
The primary value of business intelligence lies in its ability to support and improve decision-making processes. In the past, decisions were often based on intuition, historical experience, or anecdotal evidence. Today, however, businesses have access to vast amounts of data, and making decisions based on this data is crucial for staying competitive in the market.
Here are some ways BI can enhance decision-making:
1. Data-Driven Decision-Making
With BI, decisions are no longer based on guesswork or assumptions. By analyzing real-time data, business leaders can make informed decisions that are grounded in facts. For example, if a business is considering entering a new market, BI can provide data on customer demographics, market trends, and competitor performance, helping the company determine whether the move is likely to be profitable.
2. Improved Strategic Planning
Business intelligence tools enable businesses to set clear, data-backed goals and objectives. By analyzing historical data and forecasting future trends, BI can help businesses identify areas of opportunity, potential risks, and market changes. This allows organizations to develop more accurate and effective strategic plans.
For instance, a company may use BI to analyze the effectiveness of its marketing campaigns and adjust its strategies accordingly. If the data shows that a particular campaign is not delivering the expected ROI, the company can pivot its approach before spending more resources.
3. Enhanced Operational Efficiency
BI helps businesses streamline their operations by identifying inefficiencies and bottlenecks in processes. For example, a supply chain manager may use BI to track inventory levels in real time, helping them avoid stockouts or overstocking. By optimizing operations, businesses can reduce costs, improve customer satisfaction, and increase profitability.
4. Real-Time Decision-Making
In today’s fast-paced business world, the ability to make quick decisions is crucial. Traditional methods of decision-making, such as waiting for reports to be generated or consulting with multiple departments, can be slow and cumbersome. BI tools provide real-time data that enables businesses to make immediate decisions.
For example, a retail store may use BI to monitor foot traffic and sales in real time. If the data shows that a particular product is selling out quickly, the store can restock it immediately, preventing lost sales. Similarly, if a marketing campaign is underperforming, the team can adjust it in real time to improve results.
Why Is Business Intelligence Important?
The importance of business intelligence can be seen in its ability to provide businesses with a competitive edge. In today’s data-driven world, companies that can effectively analyze and act on data are more likely to succeed. Here are some key reasons why BI is important for businesses:
1. Informed Decision-Making
The most obvious benefit of BI is that it enables informed decision-making. Instead of making decisions based on gut feelings or assumptions, business leaders can use BI to make decisions based on hard data. This leads to more accurate, reliable, and effective decisions.
2. Competitive Advantage
In a competitive marketplace, businesses that can leverage data to their advantage have a significant edge over those that rely on traditional decision-making methods. BI helps businesses identify market trends, customer preferences, and emerging opportunities, enabling them to stay ahead of the competition.
3. Improved Customer Insights
By analyzing customer data, businesses can gain deeper insights into customer preferences, behaviors, and pain points. This allows companies to tailor their products and services to meet customer needs more effectively, resulting in improved customer satisfaction and loyalty.
4. Increased Efficiency and Cost Savings
BI helps businesses identify inefficiencies in their operations, allowing them to streamline processes and reduce costs. By automating data collection and reporting, businesses can free up time for employees to focus on more value-added activities, improving overall productivity.
The Role of Business Intelligence in Operational Strategy
Operational strategies are the plans and actions that organizations put into place to optimize their day-to-day activities, ensure efficient resource allocation, and drive profitability. BI tools directly impact this by offering real-time data, predictive analytics, and in-depth reports that help companies identify areas for improvement, maximize resources, and align their workforce with overall business goals.
The value of BI tools lies in their ability to provide clarity and facilitate decision-making at every level of operations. Businesses that can harness the power of their data can streamline operations, improve efficiency, and stay ahead of competitors. Here are the key ways BI tools can transform operational strategies:
1. Improved Inventory Management
Managing inventory is crucial for any business that deals with physical products. Whether you’re running a manufacturing plant, a distribution center, or a retail store, inventory management is key to maintaining profitability. If not managed properly, overstocking or stockouts can lead to lost sales and unnecessary costs.
Business intelligence tools help streamline inventory management by providing real-time insights into stock levels, demand patterns, and sales forecasts. These insights allow businesses to predict inventory needs more accurately, ensuring that the right products are available at the right time without overstocking.
For example, a BI tool can analyze past sales data and customer trends to forecast the demand for specific products during certain seasons or promotional periods. This enables businesses to optimize their stock levels, reduce waste, and avoid unnecessary holding costs. Furthermore, BI can help identify slow-moving products, so businesses can focus on promoting more profitable items or adjusting pricing strategies.
2. Enhancing Customer Relationship Management (CRM)
Customer relationship management (CRM) is another area where BI tools play a pivotal role. CRM is about building and maintaining strong relationships with customers, and BI helps businesses gain deeper insights into customer behavior, preferences, and buying patterns.
By using BI tools, businesses can analyze customer data from various touchpoints, such as purchase history, customer feedback, and online interactions. These insights can be used to segment customers into different groups, enabling businesses to tailor marketing efforts and sales strategies to meet the specific needs of each segment. This level of personalization is crucial for enhancing customer loyalty and engagement.
For example, if a company identifies that a particular segment of customers frequently purchases specific products, it can create targeted marketing campaigns, personalized offers, and product recommendations. BI tools can also help identify high-value customers, enabling businesses to focus on retaining them through loyalty programs, exclusive discounts, or improved customer service.
Moreover, BI tools help track and analyze customer satisfaction metrics, enabling businesses to quickly identify and address any issues or concerns that may arise. This proactive approach can improve customer experience and foster long-term relationships.
3. Optimizing Marketing Campaigns
Marketing campaigns are central to driving revenue, but measuring their effectiveness can be challenging. Traditional marketing methods often rely on intuition or limited feedback, making it difficult to assess the true ROI of a campaign. BI tools provide a more accurate and data-driven approach to marketing, helping businesses optimize campaigns and improve their return on investment (ROI).
Through BI, businesses can track and analyze marketing performance in real time. By integrating data from various marketing channels, such as social media, email, and paid advertising, businesses can gain a unified view of their marketing efforts. This enables them to measure key metrics such as click-through rates, conversion rates, customer acquisition costs, and overall campaign effectiveness.
Furthermore, BI tools can provide insights into customer behavior during different stages of the marketing funnel. This data can help businesses identify where prospects are dropping off or which marketing tactics are driving the most conversions. Armed with this information, marketing teams can optimize their strategies, allocate budgets more effectively, and focus on the most profitable channels.
For example, a company running a digital advertising campaign might use BI to identify which ads are generating the most engagement and sales. If certain ads are underperforming, the marketing team can make real-time adjustments, such as changing the messaging or targeting a different audience. This level of agility can significantly improve campaign performance and ROI.
4. Enhancing Supply Chain Management
Supply chain management (SCM) involves the flow of goods and services from suppliers to customers. It is an essential component of operational strategy, and its efficiency directly impacts costs and customer satisfaction. BI tools are increasingly being used to optimize supply chain management by providing visibility into each stage of the supply chain and identifying potential inefficiencies or bottlenecks.
By using BI to analyze data from suppliers, manufacturers, logistics providers, and retailers, businesses can gain deeper insights into their supply chain operations. This enables them to make more informed decisions about inventory levels, order fulfillment, and supplier performance.
For example, BI tools can help identify the most reliable suppliers based on performance data such as on-time delivery rates and product quality. This helps businesses make better decisions when selecting vendors and negotiating contracts. Additionally, BI can help businesses track the movement of goods throughout the supply chain, providing real-time updates on delivery times and inventory levels.
By predicting demand and tracking inventory in real time, businesses can optimize their supply chain processes to reduce lead times, minimize stockouts, and lower shipping costs. With better visibility into the entire supply chain, businesses can improve customer satisfaction by ensuring timely deliveries and reducing the risk of overstocking or understocking.
5. Predictive Analytics for Proactive Decision-Making
One of the most powerful aspects of business intelligence is its ability to use historical data to predict future outcomes. Predictive analytics uses advanced statistical algorithms and machine learning techniques to forecast trends and behaviors. By incorporating predictive analytics into operational strategy, businesses can make proactive decisions rather than simply reacting to changes as they occur.
For example, in sales forecasting, predictive analytics can be used to predict future sales based on historical data, seasonal trends, and market conditions. This allows businesses to adjust production schedules, allocate resources, and set realistic sales targets.
Similarly, predictive analytics can be used in human resources to forecast staffing needs. By analyzing historical data on employee turnover, hiring trends, and seasonal fluctuations, businesses can anticipate when additional workers will be needed and avoid understaffing during peak periods.
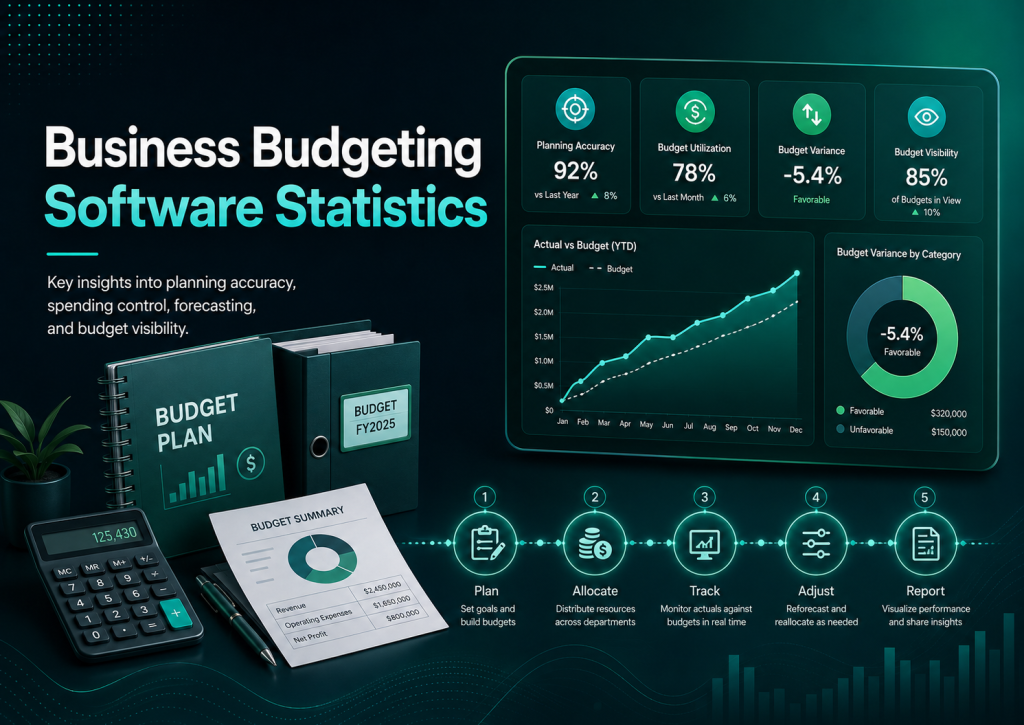
6. Improving Financial Planning and Budgeting
Effective financial planning and budgeting are crucial for ensuring the long-term success and sustainability of a business. BI tools can streamline this process by providing accurate, real-time financial data and performance metrics. These tools allow businesses to track revenue, expenses, and cash flow, enabling them to make informed financial decisions.
BI tools also help businesses create more accurate forecasts by analyzing historical financial data and identifying trends. For example, a company may use BI to forecast quarterly revenue based on sales data, seasonal trends, and marketing campaigns. This helps ensure that the business remains financially stable and can adjust its budget as needed.
Additionally, BI tools can help businesses monitor financial KPIs (key performance indicators), such as profit margins, operating expenses, and return on investment (ROI). By keeping track of these metrics in real time, businesses can identify areas for cost-cutting or investment, ensuring that they remain financially healthy and able to allocate resources effectively.
7. Data-Driven Performance Management
Performance management is the process of monitoring and evaluating the performance of employees, teams, and departments within an organization. BI tools can be used to track individual and team performance by measuring key metrics such as productivity, efficiency, and quality.
By setting specific KPIs and using BI tools to monitor performance in real time, businesses can ensure that employees are meeting their goals and contributing to the overall success of the organization. BI tools also provide valuable insights into which areas of the business may need additional support or training, helping managers make data-driven decisions about staffing, development, and resource allocation.
Exploring Top Business Intelligence Software and Its Impact
We delved into the importance of Business Intelligence (BI) and how it can transform operational strategies. From improving inventory management to optimizing marketing campaigns, BI tools allow businesses to harness the power of data to make informed decisions. Now, we will explore some of the top BI software available in the market today and examine how these tools can revolutionize your business’s data management practices.
The right BI software can bring several advantages, from providing real-time data analytics to enabling better collaboration across teams. With so many options available, it can be challenging to choose the right solution for your business. Below, we’ll take a deep dive into the top three BI tools that cater to businesses of all sizes and industries.
1. SAS Business Intelligence
SAS Business Intelligence is one of the oldest and most established names in the BI industry. Known for its powerful analytics capabilities, SAS provides comprehensive BI solutions that cater to a wide range of business needs. Since its inception in the 1970s, SAS has continuously evolved, making it one of the most advanced and feature-rich platforms available.
Key Features of SAS BI
- Advanced Analytics: SAS provides a suite of advanced analytics tools, including predictive analytics, machine learning, and data mining. These features allow businesses to uncover insights and trends that would be difficult to detect using traditional methods.
- Data Integration: One of the standout features of SAS is its robust data integration capabilities. It allows businesses to integrate data from various sources, including legacy systems, cloud-based solutions, and external datasets. This integration is essential for organizations looking to consolidate their data and gain a unified view of their operations.
- Customizable Dashboards: SAS BI provides highly customizable dashboards, enabling users to visualize data in a way that makes sense for their specific business needs. This flexibility helps ensure that the data is presented in an intuitive and actionable format.
- Comprehensive Reporting: SAS allows for detailed and personalized reporting. Users can generate custom reports tailored to specific departments, teams, or business units. These reports can also be shared across teams, enhancing collaboration and data-driven decision-making.
Why Choose SAS?
SAS Business Intelligence is ideal for organizations looking for an enterprise-level solution with a strong focus on data analytics and integration. It is particularly beneficial for large businesses or enterprises that require advanced features such as machine learning and predictive analytics. Its scalability and flexibility make it an excellent choice for businesses that need to handle complex data across various departments.
Real-World Use Case
A large multinational retail chain uses SAS BI to track customer purchasing behavior across its global network of stores. By integrating point-of-sale data with inventory and supply chain data, the company can predict future demand trends and adjust stock levels accordingly. The predictive analytics functionality helps the company to optimize its inventory, reducing costs and improving customer satisfaction.
2. Zoho Analytics
Zoho Analytics is a cloud-based BI tool designed to be intuitive and user-friendly while offering powerful reporting and analytics capabilities. This tool is popular among small to medium-sized businesses due to its ease of use and affordable pricing.
Key Features of Zoho Analytics
- User-Friendly Interface: One of Zoho’s biggest selling points is its simplicity. The tool is designed for users with little to no technical expertise, which makes it accessible to a wider audience. Its drag-and-drop interface and customizable dashboards make it easy to build visualizations and reports without needing to write any code.
- Automated Data Syncing: Zoho Analytics allows businesses to schedule automatic data syncing from various data sources such as spreadsheets, CRMs, and accounting software. This ensures that the data is always up to date and allows teams to focus on analysis rather than manual data entry.
- Data Integration: Zoho integrates with a wide variety of third-party applications, including Google Analytics, Salesforce, QuickBooks, and many others. This connectivity enables businesses to pull data from all corners of their operations, providing a comprehensive view of performance.
- Advanced Reporting: While Zoho Analytics is known for its ease of use, it doesn’t skimp on advanced reporting features. It allows for detailed drill-down reports and customizable metrics, helping businesses gain a deeper understanding of their performance.
Why Choose Zoho?
Zoho Analytics is perfect for businesses that require a simple, easy-to-implement BI tool without sacrificing essential features. It is particularly beneficial for smaller organizations or startups that want an affordable BI solution that can scale as the company grows.
Real-World Use Case
A growing e-commerce business uses Zoho Analytics to monitor website traffic, sales, and customer engagement across multiple channels. By pulling data from its Google Analytics and Shopify store, the company can gain insights into user behavior, identify which products are most popular, and optimize its marketing campaigns accordingly.
3. Clear Analytics
For businesses that are already familiar with Microsoft Excel, Clear Analytics provides a seamless integration with Excel, allowing users to maintain the comfort of working within their preferred interface while benefiting from the advanced capabilities of BI.
Key Features of Clear Analytics
- Excel Integration: Clear Analytics is entirely built around Microsoft Excel, which makes it particularly appealing for users who are accustomed to Excel’s interface and functions. This integration ensures that there is a little learning curve, making it easy for teams to adopt.
- Automated Data Refresh: Clear Analytics automates the process of data updating, meaning users don’t have to manually refresh or import data from their source systems. This automation ensures that business users are always working with the most current data.
- Data Visualization: While Excel itself is limited in terms of data visualization, Clear Analytics provides powerful tools to create dynamic charts, graphs, and dashboards. This makes it easier for users to analyze data in a more digestible format.
- Self-Service BI: Clear Analytics emphasizes self-service BI, which allows users to create reports and analyze data independently without relying on IT departments. This empowers business users to make faster decisions and enhances overall productivity.
Why Choose Clear Analytics?
Clear Analytics is ideal for organizations that have already adopted Microsoft Excel as their primary data analysis tool and want to add more advanced BI features without completely changing their workflow. It is especially useful for businesses looking for an intuitive and low-maintenance tool to enhance their existing Excel processes.
Real-World Use Case
A financial consulting firm uses Clear Analytics to streamline its data analysis process. The firm imports client data directly into Excel, where it is automatically updated and transformed into actionable insights. The team uses dynamic dashboards and visualizations to present key metrics to clients, helping them make better financial decisions.
Comparing the Three BI Tools
While SAS Business Intelligence, Zoho Analytics, and Clear Analytics each have their unique features and advantages, they are all designed to help businesses make data-driven decisions. The choice between these tools depends on several factors, including the size of the business, the complexity of the data, and the level of customization required.
Scalability and Customization
- SAS: Highly scalable and customizable, making it suitable for large enterprises and businesses with complex data needs.
- Zoho: A more affordable, user-friendly solution that’s perfect for small and medium-sized businesses, but may not offer as much customization as SAS.
- Clear Analytics: Best for businesses already using Excel, Clear Analytics integrates seamlessly with this tool but might lack the flexibility and scalability of the other two options.
Ease of Use
- SAS: While SAS is feature-rich, it may require some technical expertise to fully leverage its capabilities.
- Zoho: Known for its ease of use, even for non-technical users. Its drag-and-drop interface and customizable dashboards make it an accessible choice for businesses looking for simplicity.
- Clear Analytics: If you’re comfortable with Excel, Clear Analytics will feel like a natural extension of your existing processes, minimizing the learning curve.
Pricing
- SAS: Generally more expensive, making it more suitable for larger organizations with more complex data needs.
- Zoho: Offers an affordable pricing model, making it an excellent option for small businesses and startups looking to get started with BI.
- Clear Analytics: While pricing is often dependent on the specific package, it tends to be more affordable for smaller teams or businesses heavily invested in Microsoft Excel.
Implementing Business Intelligence Software: Best Practices and Maximizing Value,
we discussed the importance of BI, explored top BI tools, and examined how they can be utilized to gain insights and drive better business decisions. Now, we will delve into how to effectively implement BI software within your organization and provide best practices for maximizing its value.
Implementing BI software is not just about installing the tool and expecting instant results. To truly harness its power, businesses must integrate it into their workflows, train their teams, and ensure that it aligns with their strategic goals. Here, we’ll break down the key steps involved in implementing BI software successfully, and how to make sure it continues to provide value over time.
1. Set Clear Objectives for Your BI Initiative
Before you begin implementing any BI tool, it is essential to define clear objectives. What do you hope to achieve with BI? Are you looking to improve sales forecasting, optimize supply chain management, or enhance customer service? The goals you set will shape the way you approach the implementation process and will also help you choose the right BI tool.
Key Questions to Ask:
- What specific problems or challenges are you trying to solve with BI?
- What key performance indicators (KPIs) are most relevant to your business goals?
- Who will be the primary users of the BI software? Are they in sales, marketing, operations, or finance?
- How do you plan to measure the success of the BI implementation?
Defining clear objectives not only ensures that the software is used effectively but also helps in identifying which features of the BI software will be most beneficial for your organization. Whether you are aiming for better data visualization or predictive analytics, setting goals ensures that the BI tool will be used to its full potential.
2. Choose the Right BI Tool for Your Needs
Once you have defined your objectives, selecting the appropriate BI tool is crucial. As discussed in previous parts of this series, there are various BI solutions available in the market, each offering a set of features that cater to different business needs. However, it’s important to ensure that the tool you choose aligns with your goals.
Some key factors to consider when selecting a BI tool include:
- Scalability: Can the BI tool grow with your business? Look for a solution that can handle increasing volumes of data and more complex analytical needs as your business expands.
- Ease of Use: Does the software have an intuitive interface? The easier it is for your team to adopt and use the tool, the faster you’ll start seeing results.
- Integration: Does the software easily integrate with your existing systems (CRM, ERP, sales, finance tools, etc.)? Integration is key to ensuring that the BI tool can pull in data from multiple sources to provide a comprehensive view of your business.
- Cost: Is the software within your budget? Pricing models can vary widely between vendors, so ensure that the cost is justified by the value you expect to receive from the BI tool.
By carefully evaluating the software’s features and how they align with your business goals, you can make a more informed decision that will pay off in the long run.
3. Involve Key Stakeholders in the Implementation Process
Successful BI implementation goes beyond just IT and data teams. It’s essential to involve all key stakeholders who will be using the software or impacted by the insights it generates. This includes departments such as marketing, sales, finance, and customer service.
Involving a diverse group of stakeholders ensures that the BI solution will address the needs of all relevant teams and provide a broader understanding of how data flows within the organization. Furthermore, involving your team from the outset increases user adoption and helps create champions for the BI tool across the business.
Steps for Engaging Stakeholders:
- Identify Business Needs: Work with stakeholders to define their business challenges and what data would help address those challenges.
- Establish a BI Task Force: Form a cross-departmental team to oversee the implementation and customization of the BI software.
- Communicate Benefits: Ensure that stakeholders understand how BI will help their teams perform better. Highlight its potential to improve decision-making, efficiency, and overall productivity.
- Set Expectations: Be clear about what the BI tool will and won’t do. Setting realistic expectations from the beginning helps prevent dissatisfaction and ensures that the team remains focused on the tool’s true capabilities.
By engaging stakeholders early on, you can ensure smoother adoption and better alignment between your BI software and business needs.
4. Invest in Data Preparation and Integration
One of the biggest challenges in implementing BI is ensuring that your data is clean, accurate, and well-organized. For a BI tool to provide actionable insights, it must have access to high-quality data. Poor data quality can lead to inaccurate analyses and, ultimately, poor decision-making.
Data Preparation Best Practices:
- Data Cleaning: Ensure that your data is free of inconsistencies, duplicates, and errors. This may involve standardizing formats, removing outliers, and verifying data accuracy.
- Data Integration: Integrate data from various systems (CRM, ERP, finance software) into your BI tool. This ensures that the tool has access to a comprehensive dataset, enabling it to generate more accurate and meaningful insights.
- Data Governance: Establish data governance practices to maintain data quality over time. This includes creating policies for data entry, validation, and access, as well as regularly auditing the data to ensure its ongoing accuracy.
Investing in data preparation and integration is a critical step in ensuring that your BI software delivers value. High-quality data is the foundation of any successful BI initiative.
5. Train Your Team and Foster a Data-Driven Culture
Once your BI tool is in place and your data is prepared, the next step is to train your team on how to use the software effectively. Even the most user-friendly BI tools can be underutilized if employees don’t know how to navigate them or take full advantage of their features.
Training should go beyond simple how-to guides. It should also include best practices for data analysis and the importance of using data to drive decisions. By fostering a data-driven culture within your organization, you can ensure that all teams are aligned in using data to improve performance.
Training Best Practices:
- Hands-On Training: Provide interactive training sessions where employees can learn by doing. This hands-on approach will help them feel more comfortable using the BI software.
- Ongoing Support: BI tools evolve, and so does your business. Offer continuous training and support to keep employees up to date with new features and capabilities.
- Encourage Collaboration: BI is most powerful when teams work together and share insights. Encourage collaboration across departments by using shared dashboards and reports.
6. Monitor, Evaluate, and Optimize Over Time
Implementing BI software is not a one-time event but an ongoing process. As you use the tool, it’s important to continuously monitor its effectiveness, evaluate how well it’s meeting your business goals, and make adjustments as needed.
Key Areas to Monitor:
- Data Accuracy: Regularly check the quality of the data being used in your BI tool. Poor data quality will undermine the accuracy of the insights and reports.
- Tool Usage: Monitor how frequently the tool is being used and by whom. Are all the stakeholders leveraging the software as expected? Are there any areas where usage could be improved?
- Business Impact: Assess how the BI tool is impacting business outcomes. Are sales, customer service, or operational efficiency improving as a result of the insights from the BI tool?
By regularly evaluating your BI tool, you can ensure that it continues to deliver value and that your business stays ahead of the competition.
Conclusion
We’ve explored how to effectively implement and maximize the value of BI software. From setting clear objectives to fostering a data-driven culture, the process of implementing BI involves several steps that ensure your investment pays off. By involving key stakeholders, preparing your data, training your team, and continuously evaluating the software’s impact, you can ensure that your business is well-positioned to make data-driven decisions that drive success.
The world of business intelligence is constantly evolving, and as your business grows, so too will your data needs. By staying proactive and agile, you can continue to use BI as a powerful tool to unlock new insights, improve performance, and make better decisions in every aspect of your business.